We evaluated the biological relevance of our results against two gene
ontology databases: GO and
KEGG. We first measured the
consistency of the predicted network alignment by computing the mean entropy of
the predicted clusters. The entropy of a given cluster S*v is:
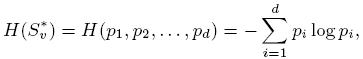
where pi is the fraction of S*v with GO or KEGG group ID i.
Thus a cluster has lower entropy if its GO and KEGG annotations are more
within-cluster consistent. We also measured the fraction of clusters which are exact, i.e.
those in which all proteins have the same GO or KEGG ID. For GO annotation,
we restricted to the deepest categories, removing questions of multiplicity and specificity of annotations.
Note that only 60-70% of the proteins in any of the aligned networks have an assigned GO or KEGG ID,
comparable to the fraction of all known proteins included in GO or KEGG.
Additionally the relative performance under either consistency measure does not
change when restricted to GO or KEGG individually.
| Consistency |
IsoRank & IsoRankN |
| Mean entropy |
0.274 |
| Exact cluster ratio* |
0.380(3079 of 8095) |
| Exact protein ratio* |
0.261(9284 of 35604) |
|
*The fraction of predicted clusters (proteins) which are exact.
|
| Coverage* (# of species) |
IsoRank & IsoRankN |
| Total |
12848/48978 |
|
| 2 |
3844/8739 |
| 3 |
4022/13533 |
| 4 |
2926/13991 |
| 5 |
2056/12715 |
|
*The number of predicted clusters containing exactly # species and number of
constituent proteins in those clusters (#cluster / #proteins)
|
| GO/KEGG |
IsoRank & IsoRankN |
| p-value |
1.28 e-90 |
| GO/KEGG category |
712/2490 |
|
| Human |
632/2200 |
| Mouse |
605/2124 |
| Fly |
574/1787 |
| Worm |
552/1698 |
| Yeast |
368/938 |
|
The number of GO/KEGG categories enriched by IsoRank & IsoRankN. As computed by GO TermFinder, we
remark that this excludes those proteins tagged IEA (inferred from electronic
annotation).
|
