We study the problem of optimally adapting ongoing cloud gaming sessions
to maximize the gamer experience in dynamic environments. The considered
problem is quite challenging because: (i) gamer experience is subjective
and hard to quantify, (ii) the existing open-source cloud gaming
platform does not support dynamic reconfigurations of video codecs, and
(iii) the resource allocation among concurrent gamers leaves a huge room
to optimize. We rigorously address these three challenges by: (i)
conducting a crowdsourced user study over the live Internet for an
empirical gaming experience model, (ii) enhancing the cloud gaming
platform to support frame rate and bitrate adaptation on-the-fly, and
(iii) proposing optimal yet efficient algorithms to maximize the overall
gaming experience or ensure the fairness among gamers. We conduct
extensive trace-driven simulations to demonstrate the merits of our
algorithms and implementation. Our simulation results show that the
proposed efficient algorithms: (i) outperform the baseline algorithms by
up to 46% and 30%, (ii) run fast and scale to large ( ≥ 8000
gamers) problems, and (iii) achieve the user-specified optimization
criteria, such as maximizing average gamer experience or maximizing the
minimum gamer experience. The resulting cloud gaming platform can be
leveraged by many researchers, developers, and gamers.
1 Introduction
provide abundant and elastic resources for offering various online
services, and have made tremendous impacts on our daily life in many ways.
Computer games, along with many other applications, have been pushed into the
clouds [1] in two models: file streaming and video streaming. The
first, more conservative, model leverages the clouds to distribute computer
games, because modern computer games often take more than one DVD to
distribute. File streaming allows gamers to start playing games after a small
subset of files has been downloaded, while the remaining files are streamed in
the background. File streaming allows the game developers, such as Blizzard, to
reduce their costs on manufacturing the physical media, and delivering patches
using the same clouds. However, all these computer games still run on gamers'
computers, and thus gamers: (i) need high-end computers for good graphics effects
and (ii) can only play games on the installed computers.
The second, more aggressive, model offloads intensive computations,
such as rendering, physics, and artificial intelligence, to the clouds,
in order to deliver more visually-appealing effects on less powerful
computers anywhere, anytime over the Internet. Using video streaming,
game service providers, such as OnLive [2],
GaiKai [3], and Ubitus [4], deliver instantaneous
gaming experience to gamers using different client computers (including
mobile devices). This is done by implementing and installing a thin
client on PCs, laptops, tablets, smartphones, and set-top boxes. While
the recent game-specialized cloud infrastructures [5]
support both cloud gaming models, we only consider the more challenging
video streaming model throughout this paper.
Delivering high-quality cloud gaming experience is
challenging [6], mainly because: (i)
modern computer games are mostly resource hungry, (ii) the real-time
nature of games imposes stringent deadline, and (iii) gamers have high
expectations on different aspects of gaming
experience [7]. More specifically, gamers ask for
both high-quality game scenes and low response delay, where the: (i)
quality of game scenes is measured by metrics like resolutions, frame
rates, fidelities, and 3D effect levels, and (ii) the response delay
refers to the time difference between the time when a gamer triggers an
input and the time when the client renders the corresponding effect.
Concurrently achieving both high-quality scenes and fast responses
consumes a huge amount of computation and network
resources [8]. Our prior
work [9] copes with the problem by optimally
selecting the most suitable data centers for incoming gamers to maximize
a configurable objective function, such as overall gaming experience.
The data center selection problems are solved on a portal server, so as
to optimize the gaming experience in large time scales (in the order of
tenths of minutes). However, the cloud systems and network resources
change in small time scales (in the order of seconds), which cannot be
compensated by optimal data center selection alone, and thus a
finer-grained adaptation mechanism is required for each game session.
In this paper, we study the problem of adapting cloud gaming
sessions to maximize the gamer experience in dynamic systems and
networks.
Without adaptations, cloud gaming platforms continuously deliver the cloud
games to gamers at the highest possible quality even when the resources are
insufficient. This may overload the network because a large part of the network
resources is consumed by the downstream traffic (game videos) [10].
Thus, the video bitrate of an ongoing cloud gaming session should be reduced if
the end-to-end bandwidth is insufficient. Moreover, when the bandwidth is
significantly reduced, the video frame rate may have to be reduced to maintain
a satisfying graphics quality. Otherwise, gamers would suffer from degraded
gaming experience due to late and lost frames, and may quit the games
prematurely.
Achieving optimal adaptations is no easy task because
gamers are picky, and love to have both high graphic quality and short
interaction delay. However, concurrently optimizing both gamers' demands is
impossible. Therefore, in order to solve the cloud gaming bitrate adaptation problem,
we carefully study the following three main challenges:
Quantifying gamer experience via crowdsourcing.
The metrics of higher-level gamer experience and lower-level system performance
are quite different, and the mapping between them is affected by many factors.
Conducting a user study in a lab to exercise all the factors requires many
participants, and is tedious and expensive. Hence, we leverage crowdsourcing
for a user study with many more online participants in
Section IV, and derive empirical gamer experience, or Mean Opinion
Score (MOS) model. Crowdsourcing also allows us to conduct the user study
using gamers' actual client computers for more realistic results, compared
to user studies done in a lab.
Reconfiguring video codecs. Compared to audio streams,
encoding and transmitting video streams consume much more
computation/network resources, and thus video codec is the main control
knob for adapting an ongoing cloud gaming session to the available
resources. Changing the codec configuration
on-the-fly is challenging, and we report the lessons
learned in Section V.
Adapting videos in dynamic networks. With the gamer
experience model and codec reconfiguration mechanism, we then develop a
suite of techniques to quickly adapt the video codec configurations to
dynamic networks. The techniques range from optimal resource allocation
algorithms to real-time heuristics to maximize the gamer experience
without excessive resource consumption. These techniques are presented
in Section VI.
The derived models and developed techniques have to be implemented in a
real cloud gaming platform to facilitate experiment-based evaluations.
However, we cannot rely on the commercial cloud gaming
platforms [2,[3,[4], because they are closed and
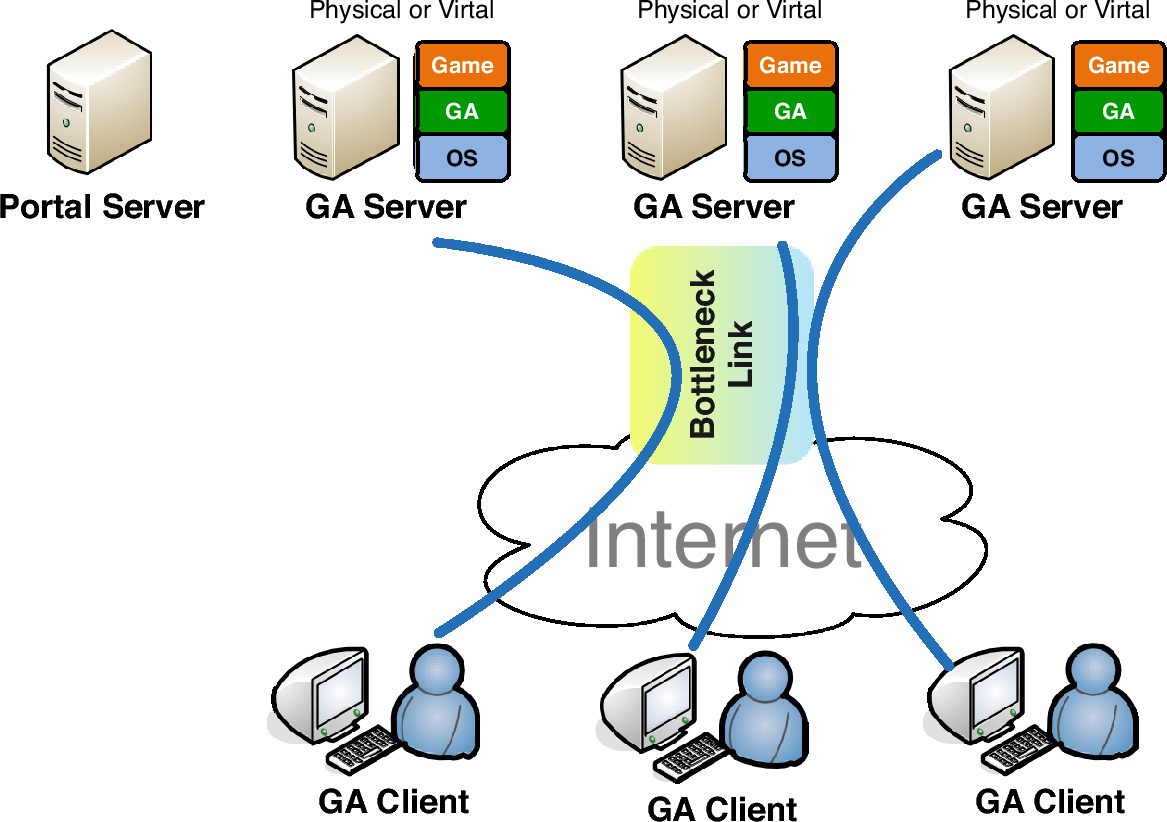
proprietary. Hence, this paper is built upon GamingAnywhere
(GA) [11,[12], which is an
open-source cloud gaming platform designed (see
Figure 1) for researchers, engineers, and gamers. The
design philosophy of GA includes extensibility, portability,
configurability, and openness, and thus is very suitable to cloud gaming
research. At the time of writing, the GA system does not include the
game portal, and we present our game portal design in this paper. The
game portal hosts several optimization algorithms, including the data
center selection algorithm [9] and the adaptation
algorithm. The adaptation algorithm is developed in the current work,
which enhances the GA system to support video codec reconfiguration in
order to adapt to dynamic networks. More details on the original GA are
given in [12].
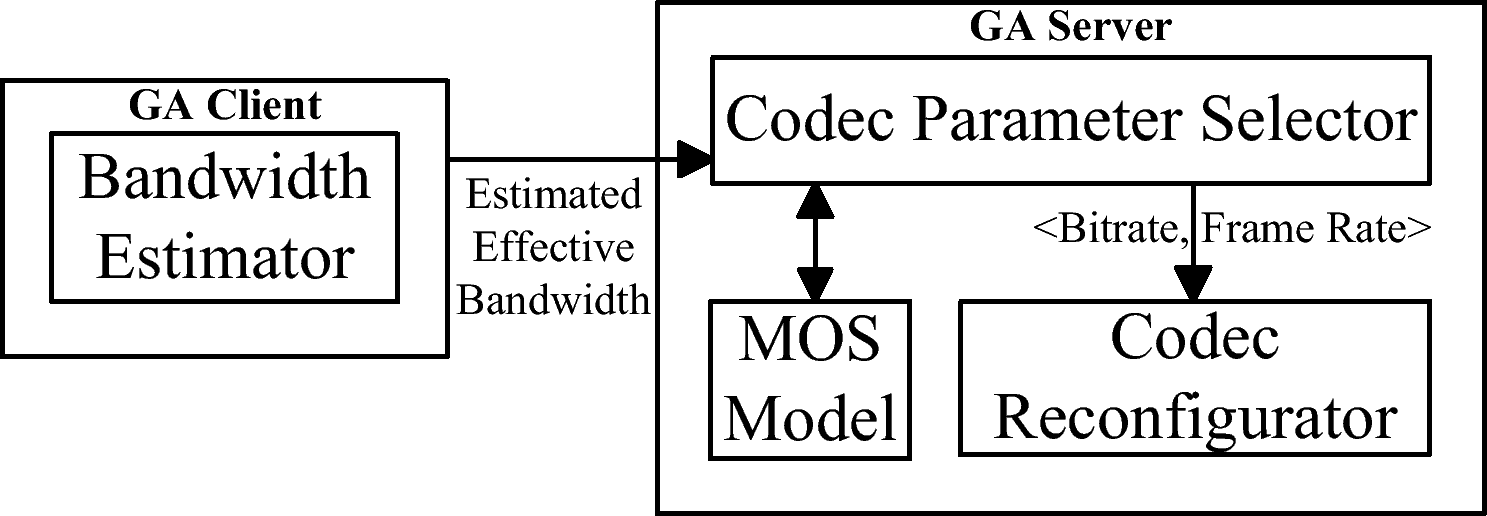
More precisely, we add four software components in GA client/server, as
illustrated in Figure 2, to support adaptation.
Bandwidth estimator monitors the sending/receiving timestamps of video packets
at GA client, so as to estimate the effective bandwidth1. GA client sends the
estimated effective bandwidth to GA server, where codec
parameter selector determines the optimal encoding bitrate and frame rate to
maximize the user experience. Such decisions are made based on an MOS
model, which converts each pair of bitrate and frame rate into a
game-dependent MOS score. The optimal encoding bitrate and frame rate are sent
into codec reconfigurator for on-the-fly video adaptation. We present the
codec reconfigurator and bandwidth estimator in
Section V, and the MOS model and codec parameter selector
in Section VI.
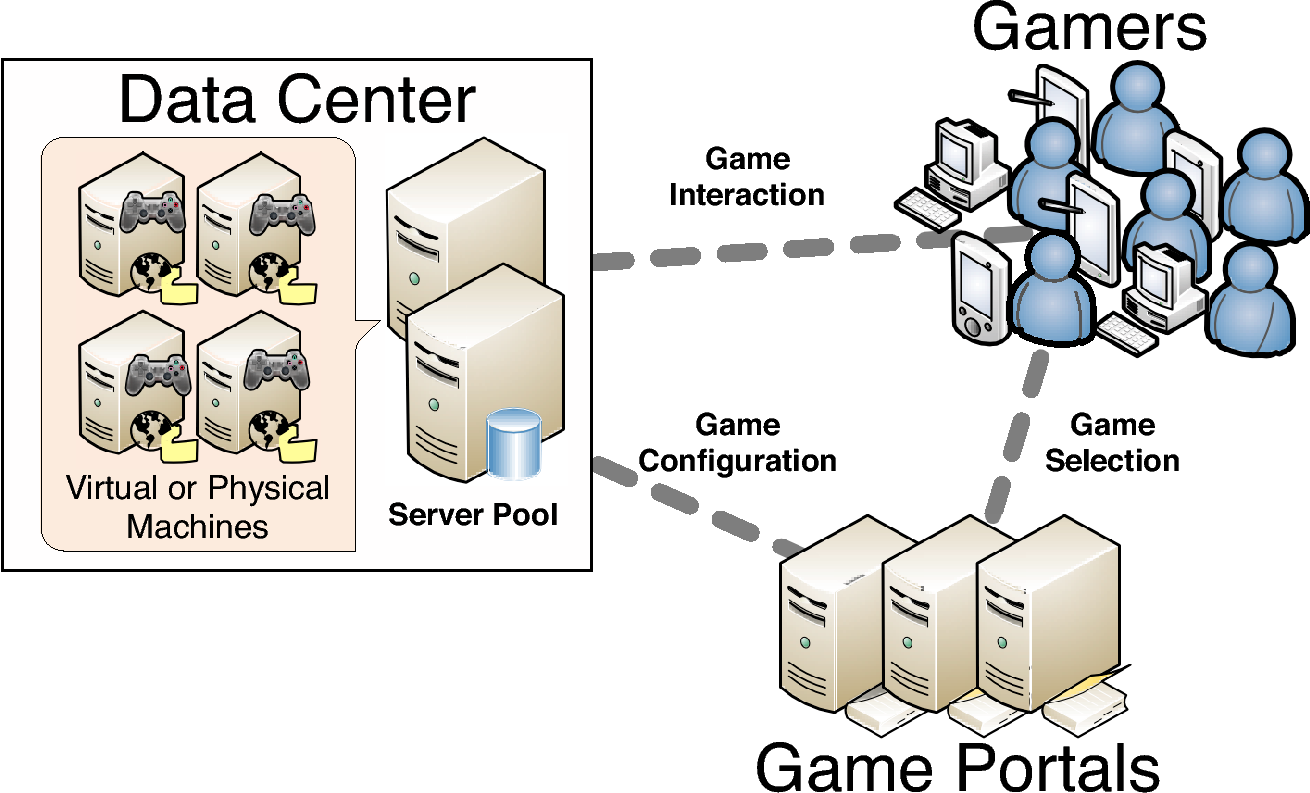
Figure 1: The overview of cloud gaming platforms.
Figure 2: The new components in the proposed adaptive cloud gaming system.
2 Related Work
2.1 Cloud Gaming Platforms
In cloud gaming platforms, there are several approaches to
divide the tasks between the cloud servers and clients. With
graphics streaming[13,[14], the cloud servers send all
graphics commands to the clients, which then render the graphics
commands using the clients' GPUs. This approach dictates more powerful
GPUs to render high-quality game scenes in real time, which is less
applicable for resource-limited mobile devices and set-top boxes. With
post-rendering operations[15,[16], the 3D rendering
is done at the cloud servers, and part of the post-rendering operations
are done on clients. Such post-rendering operations on the clients
include augmenting motions, lights, and texture [17].
This approach complicates the game development and increases the
development cost, which may drive the game developers away from the
cloud gaming platforms. With video
streaming[18,[19], the cloud servers render the game
scenes and stream videos to the clients. The clients decode and
display videos, which is a much lighter weight operation compared to
the other two approaches. Comparatively, the video streaming
approach: (i) demands the least resources at the clients, (ii) is
easier to implement, (iii) is easier to port to heterogeneous clients,
and (iv) requires the minimum augmentations on game code.
Hence, the mainstream commercial cloud gaming platforms, such as
OnLive [2], GaiKai [3], and Ubitus [4],
all adopt the video streaming approach. Similar approaches are taken by
several cloud gaming
platforms [18,[19,[12] in the literature.
Among these platforms, GA [12] is open,
modularized, cross-platform, and efficient. It is the first complete
open-source platform of its kind. GA has been leveraged by several
research projects on cloud gaming, such as mobile cloud
gaming [20,[21],
e-learning applications [22], GPU
consolidation [23], and cloud resource
allocation [9].
2.2 Resource Allocation in Cloud Gaming Platforms
The resource allocation problem in the clouds has been studied for
some game genres. For example, Lee and Chen [24] study the
resource allocation problem for Massively Multiplayer Online
Role-Playing Game (MMORPG), and propose a zone-base algorithm to reduce
the hardware requirements of the servers. However, these game servers
handle short state update messages, and thus are different from cloud
gaming servers that stream high-quality real-time videos to the
clients. Duong et al. [25] and Wu et al. [26] focus
on the admission control problem, to minimize the queueing delay of
cloud gaming platforms. In particular, Duong et al. [25]
develop algorithms to selectively admit incoming users for the highest
profit, and Wu et al. [26] propose a similar algorithm to
quickly serve users in the waiting queue.
Wang and Dey [27] propose an adaptive algorithm to dynamically
adjust the rendering parameters, such as lighting modes and texture
details, to adaptively allocate resources. Cai et al. [28]
study the resource allocation problem between a cloud server and a
client computer. They divide a game into several software components
and intelligently dispatch the components among multiple cloud servers
and client computers.
Our earlier works [9] consider a different problem
of maximizing the gaming Quality of Experience (QoE) of all admitted
users, by placing virtual machines in the best data centers under
diverse network conditions, such as network delay. The current paper, in
contrast, addresses the problem of dynamic adaptations in ongoing game
sessions.
3 System Architecture of the extended Cloud Gaming Platform
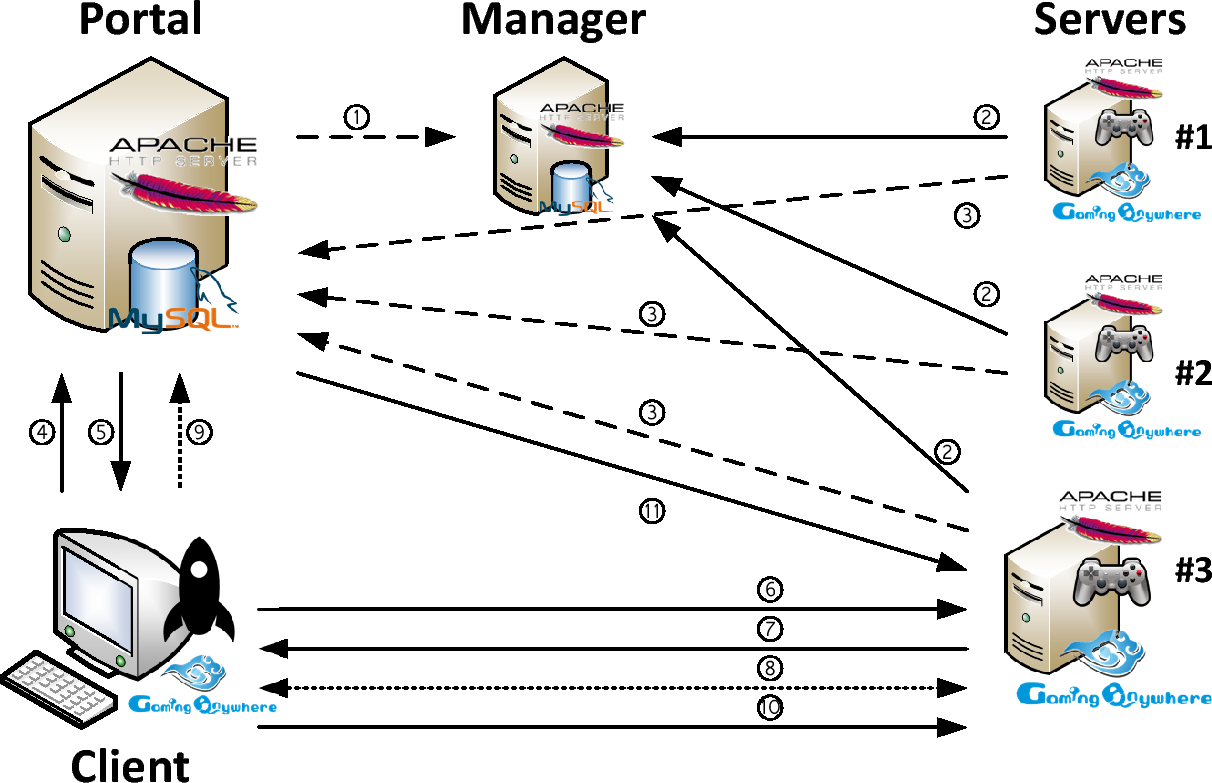
Figure 3: The working flows among the portal, manager, servers, and clients.
We extend GA for a complete cloud gaming service, and the system architecture
is illustrated in Figure 3. The proposed architecture consists
of four entities: a manger, portals, servers, and clients. This figure depicts
the working flows among the entities with numbered steps. The manager is a
logically-centralized entity running on a server or server farm, and is
responsible for pointing servers to portals. Multiple portals can be deployed for
the sake of scalability, although only one portal is shown in the figure for
brevity. Each server is associated with and managed by a portal, and the server
may run on a virtual or physical machine. Heartbeat messages (not shown in the
figure) are periodically exchanged between a pair of associated server and
portal, in order to maintain the awareness of the existence of the other party.
The server is associated with a portal as follows. When the portal is up, it
registers with the manager (step 1). When the server is up, it asks the manager
for available portals (step 2), and then reports to one of the available
portals (step 3). After this, the server, which runs the actual game, is
associated with and managed by the portal. The server repeats steps 2 and 3 if the
connection to the portal is broken.
When a client attempts to use the cloud gaming service, it executes a launcher
to interact with the portal (steps 4 and 5). The launcher retrieves a list of available games
on the portal, lets a player select a game, and gets an available
server for the selected game from the portal. Then the launcher requests the
server to launch the GA server and the selected game (step 6), and
downloads required client setup information from the server (step 7). Last, the
launcher launches the GA client to connect to the server and starts the game
play (step 8). During a game play, the launcher monitors the GA client and
periodically sends a heartbeat message to the portal to indicate that the game
play is still ongoing (step 9). The launcher sends a terminating signal to the
server if the user quits the game (step 10). In case that the client is not
shutdown normally, the portal detects the issue by missing heartbeat messages.
When an abnormal shutdown is detected, the portal sends a cleanup message (step
11) to the corresponding server of the abnormal user, in order to release
the resources, such as CPU, memory, and disk occupied by the client.
The extended system architecture will be released to the
public [11], and can be leveraged by more researchers,
developers, and gamers.
4 Quantifying Gamer Experience via Crowdsourcing
We present a crowdsourcing system built on
GA, a crowdsourced user study, and several new
findings.
Table 1: Summary of the Crowdsourced Study
5pt
5pt
5ptGame
Batman, FGPX, CoD
5ptBitrate
0.5, 1, 2 Mbps
5ptFrame Rate
10, 20, 30 fps
5pt# of Subjects
101
5pt# of Experiments
167
5pt# of Game Sessions
3,020
5ptMean (std) Session Time
173 (59) seconds
5ptTotal Session Time
132.2 hours
5ptMean (std) Graphics Quality
4.13 (1.66)
5ptMean (std) Interactivity Quality
4.44 (1.50)
5ptMean (std) Overall Score
4.16 (1.51)
5pt
4.1 Online Questionnaire System
We first design an automatic online questionnaire system to collect
user experience in playing games via GA under diverse
configurations.
There are several proposals to quantify user experience in cloud gaming
platforms [29,[30,[31]; interested readers are referred to the survey [31]
for a complete list of these quality metrics. In this work, we adopt Mean
Opinion Score (MOS), which is a subjective score from 1 (worst) to 7
(best), as the performance metric of our questionnaire system2.
The system design
is consistent with the architecture given in Figure 3. An
invited participant first launches the questionnaire client using
his/her computer, which connects to the portal server and shows a
welcome message
to describe the experiment.
If the invitee agrees to participate in the experiment, he/she clicks
a button to start the experiment. The questionnaire client
then finds an available GA server registered on the portal, randomly
picks a server configurations, launches the game on the game server,
and runs the GA client for the subject to start the game play. We vary
bitrate, frame rate, and game in different configurations and the
details are summarized in Table I. Each game
session lasts for 2-4 minutes; specifically: (i) a game needs to be
played for 2 minutes before the client can be manually terminated, and
(ii) the client will be forcefully terminated after 4 minutes. After a
game session is finished, the questionnaire client shows an online
questionnaire form for the subject to fill in. The subject then plays
the same game under 8 other configurations (9 configurations in total,
which are in a random order). Each subject needs to play one game
(with 9 configurations), but may opt for more games (3 games in total).
If a subject quits before finishing the 9 configurations for a game,
his/her inputs of the gaming experience are not considered.
The questionnaire client is implemented as a Windows program with an
embedded Internet Explorer object. Both the portal and GA server are
wrapped as web services. The questionnaire client leverages
libcurl to interact with the portal server and launches the
selected GA server with a specific configuration. The online
questionnaire form is created using Google spreadsheet and is presented
to the user in the embedded Internet Explorer object. To prevent the
spreadsheet from being abused by attackers or malicious users, we
generate a keyed Message Authentication Code (MAC) for each game play
and pre-fill it into corresponding questionnaire form. Only forms
with valid keyed MACs are considered in our evaluations.
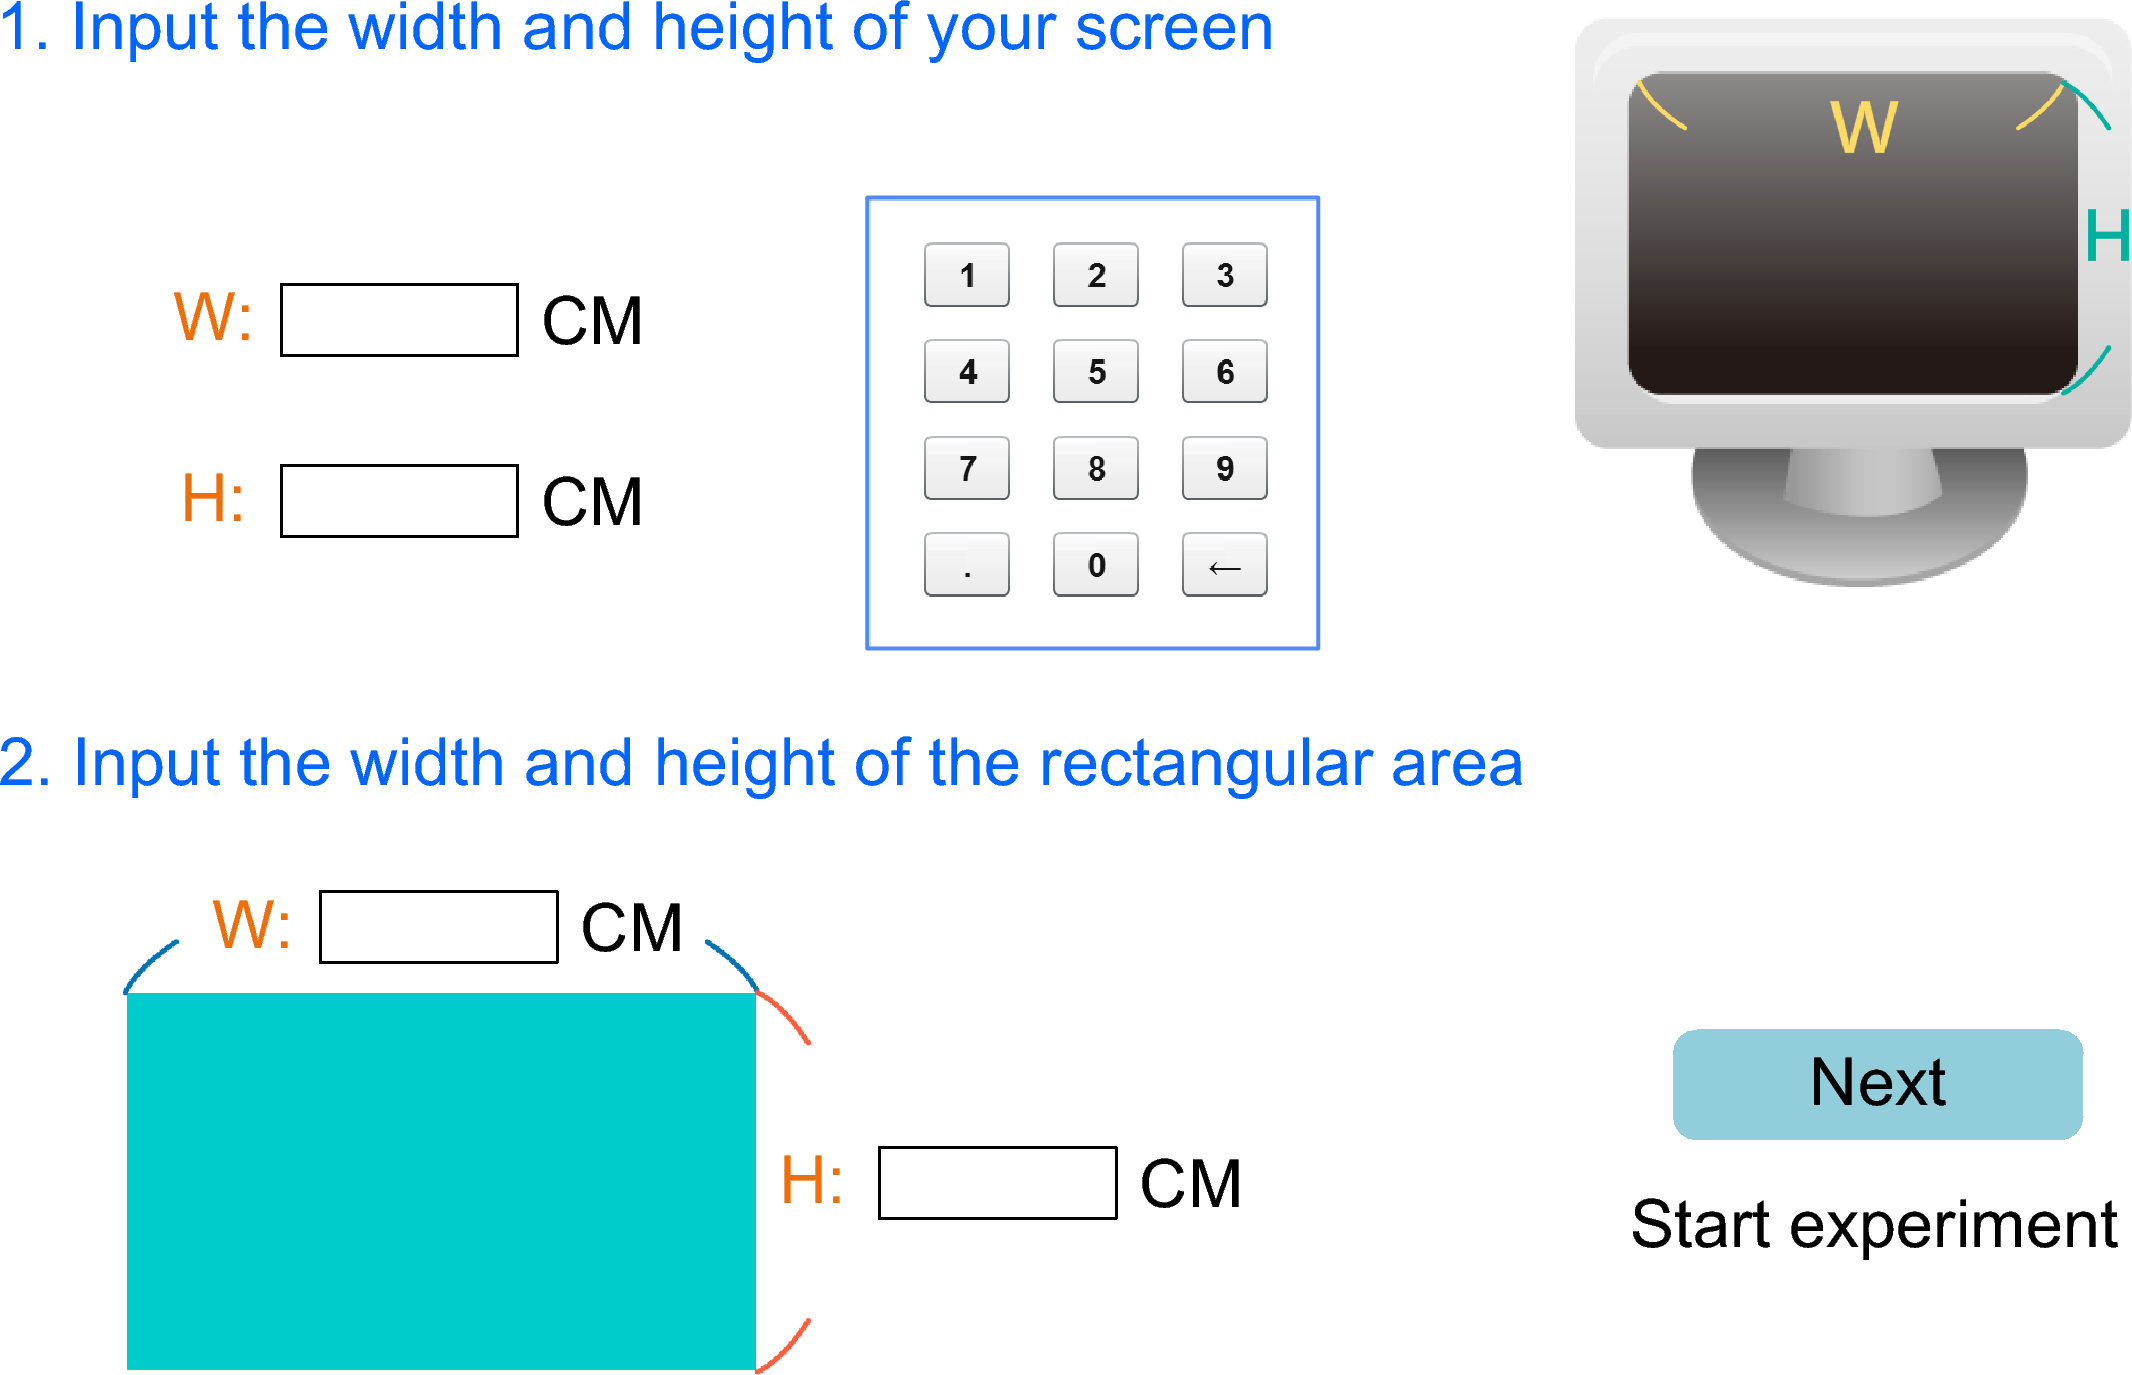
Figure 4: The instructions and interface for users to input the physical
dimension of their computer monitors.
One tricky part of carrying out the crowdsourced user study is:
subjects use their own home/office computers, and thus the physical
monitor dimensions and display resolutions may be quite diverse.
Therefore, we add an additional test to estimate the monitor
characteristics as follows. We first present a user interface in full
screen as illustrated in Figure 4, which asks the
subject to fill in the physical dimension of the monitor. The subjects
may not know the exact sizes, and thus we ask them to measure the
viewable area of the monitor with rulers. To filter out erroneous
information, a rectangle is displayed on the screen and the subjects
are also asked to measure the size of the rectangle on their monitors
with rulers. By comparing both inputs, i.e., the dimensions of the
monitors and those of the rectangle, we filter out erroneous inputs and
exclude these subjects from the user study. The display
characteristics, including monitor size, screen resolution, and pixel
density, are later analyzed to see how they affect game play
experience.
4.2 Overall Results
We conduct the crowdsourced user study online between July and
September 2014. Upon filtering out subjects who made problematic inputs
(such as all the ratings for all the configurations are consistently 1
or 7), we end up with 101 subjects and 167 experiments. Among the
subjects, 51% of them are females and 49% are males; the ages of
subjects are on average 27 years old with a standard deviation of 5.5
years (ranging from 19 to 41 years old); 30% of them are students and
the remaining subjects have diverse professions, including salesperson,
accountant, government officer, and so on. The subjects have quite
diverse experience in computer game play, as their gaming history spans
from 4 to 34 years (with an average of 12 years); in addition, they are
also dissimilar in terms of the average time spent in computer gaming
per day: The daily game play time ranges from 15 minutes to 6 hours
with an average and standard deviation of 2 and 1.5 hours respectively.
These figures indicate that our subjects are from different background;
thus, though the number of subjects is not significantly large, but
they should constitute of a relatively representative sample of the
Internet users. The overall statistics of the dataset we collected from
the experiments are summarized in Table I.
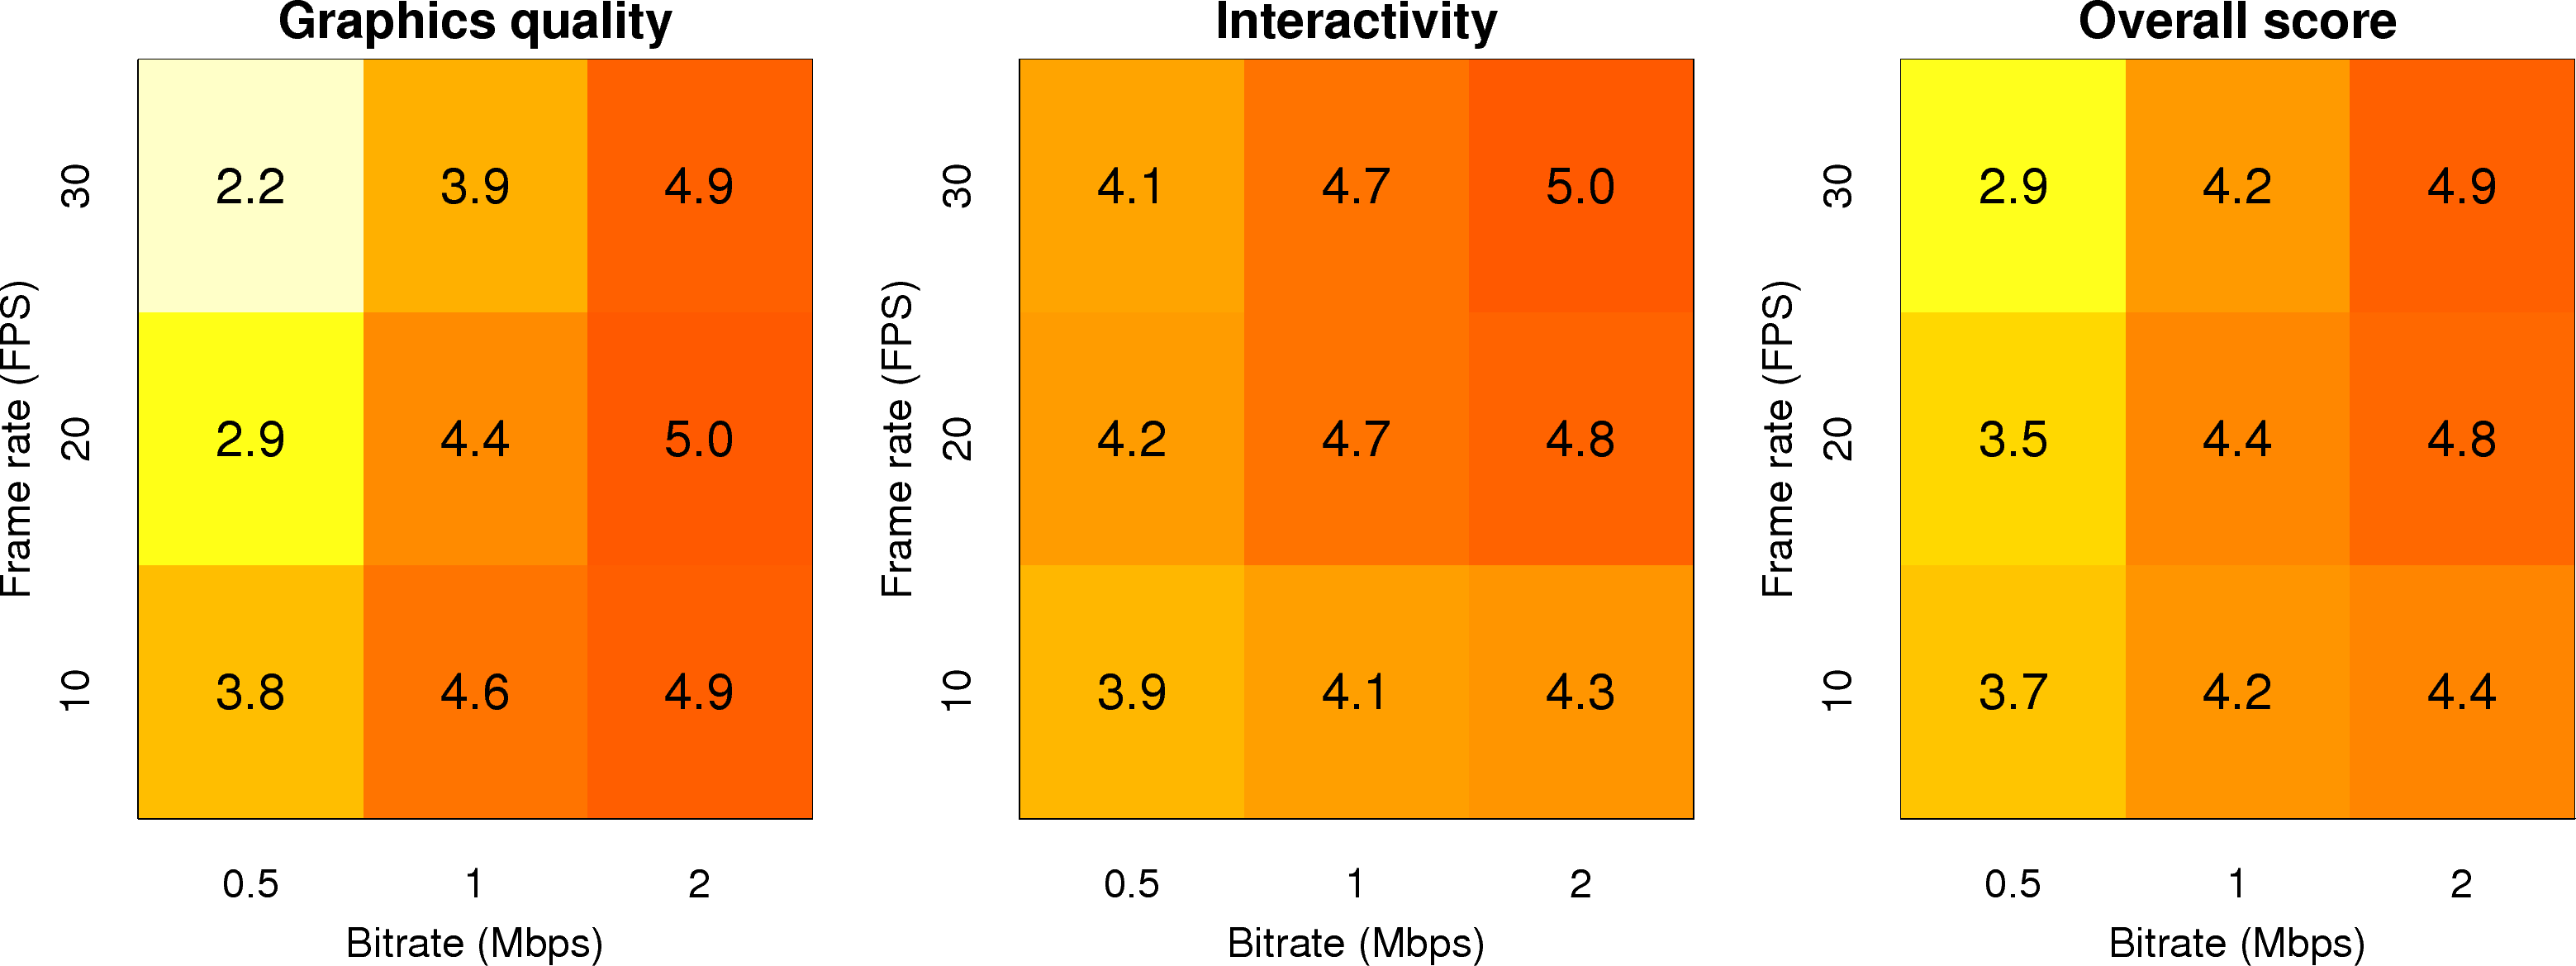
We first compute the aggregated MOS scores under different bitrates and
frame rates, and plot them in Figure 5 with several
observations. First, when the frame rate
is fixed, higher bitrates always result in higher MOS scores,
demonstrating the importance of allocating the available bandwidth
among gamers. Second, higher frame rates lead to lower graphics
quality, because higher frame rates essentially mean more video frames
to encode. Third, higher frame rates result in higher interactivity,
because the games are more responsive. Fourth, and most interesting,
when the bitrate is high (2 Mbps), higher frame rates lead to better
overall scores; when the bitrate is low (0.5 Mbps), higher frame rates
lead to lower overall scores. Such difference may be attributed to the
already inferior graphics quality when bitrate is low: further
degradation on graphics quality due to higher frame rates is not
acceptable. This finding reveals that increasing frame rates not
necessarily improves overall MOS scores, and therefore carefully
choosing the best configuration is critical.
Figure 5: Aggregated MOS scores under different configurations (bitrate
and frame rate).
4.3 Impacts of Games on MOS Scores
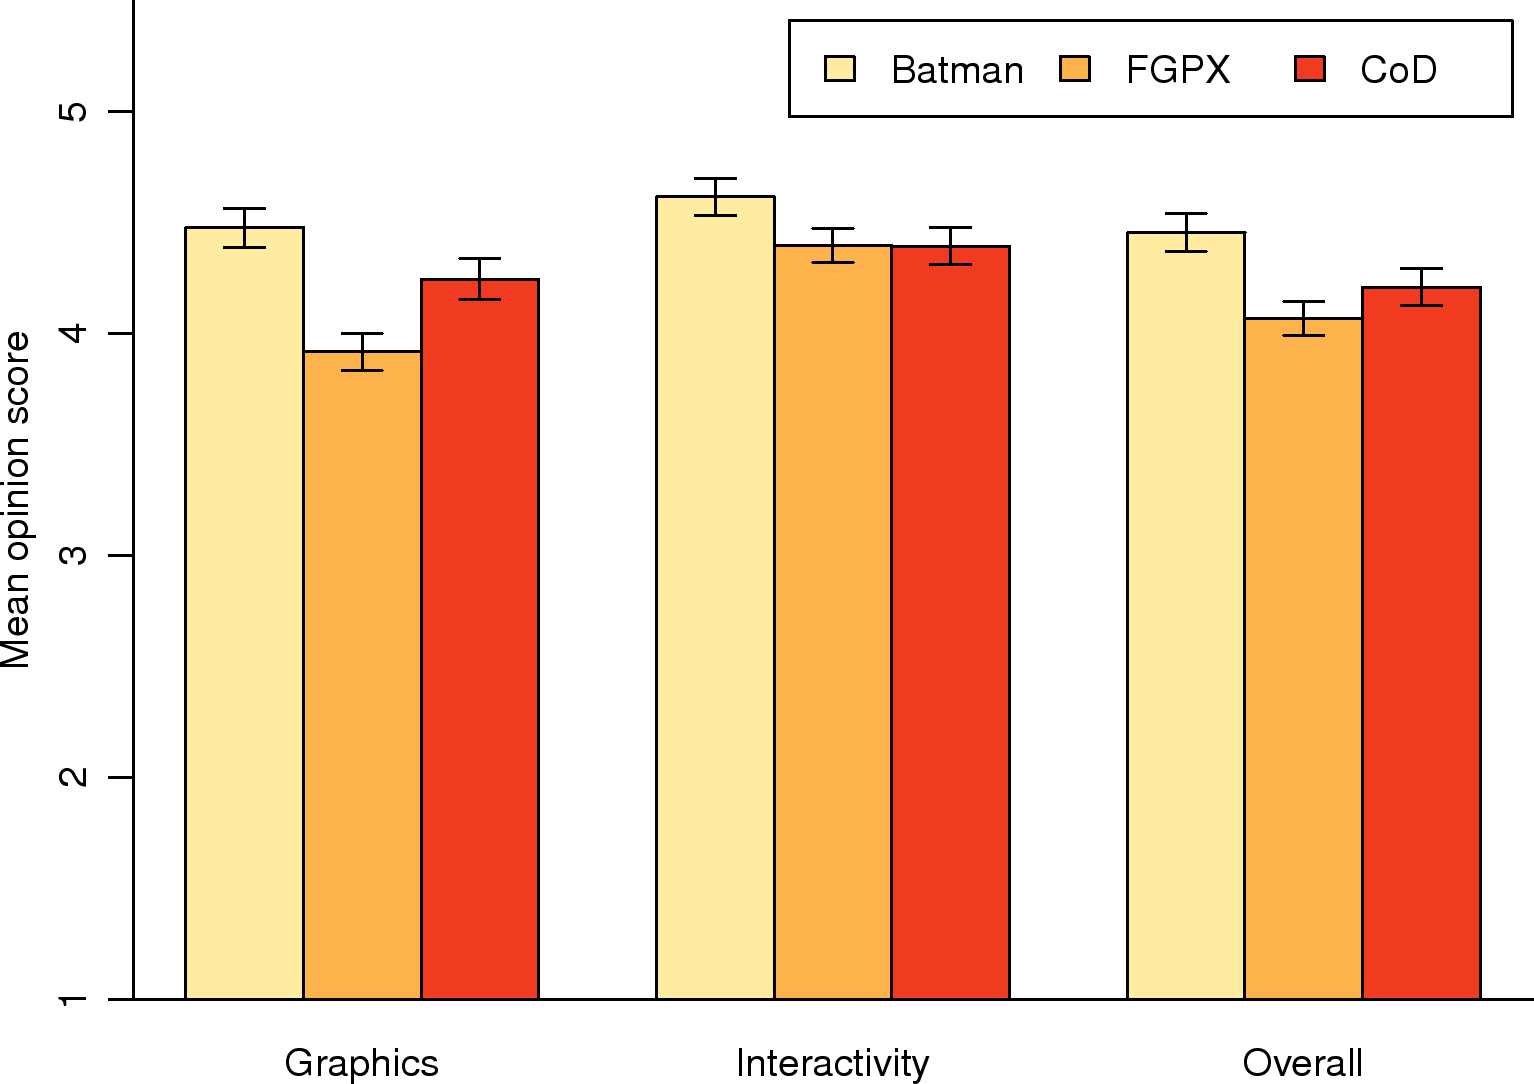
Figure 6: Impacts of games on aggregated MOS scores.
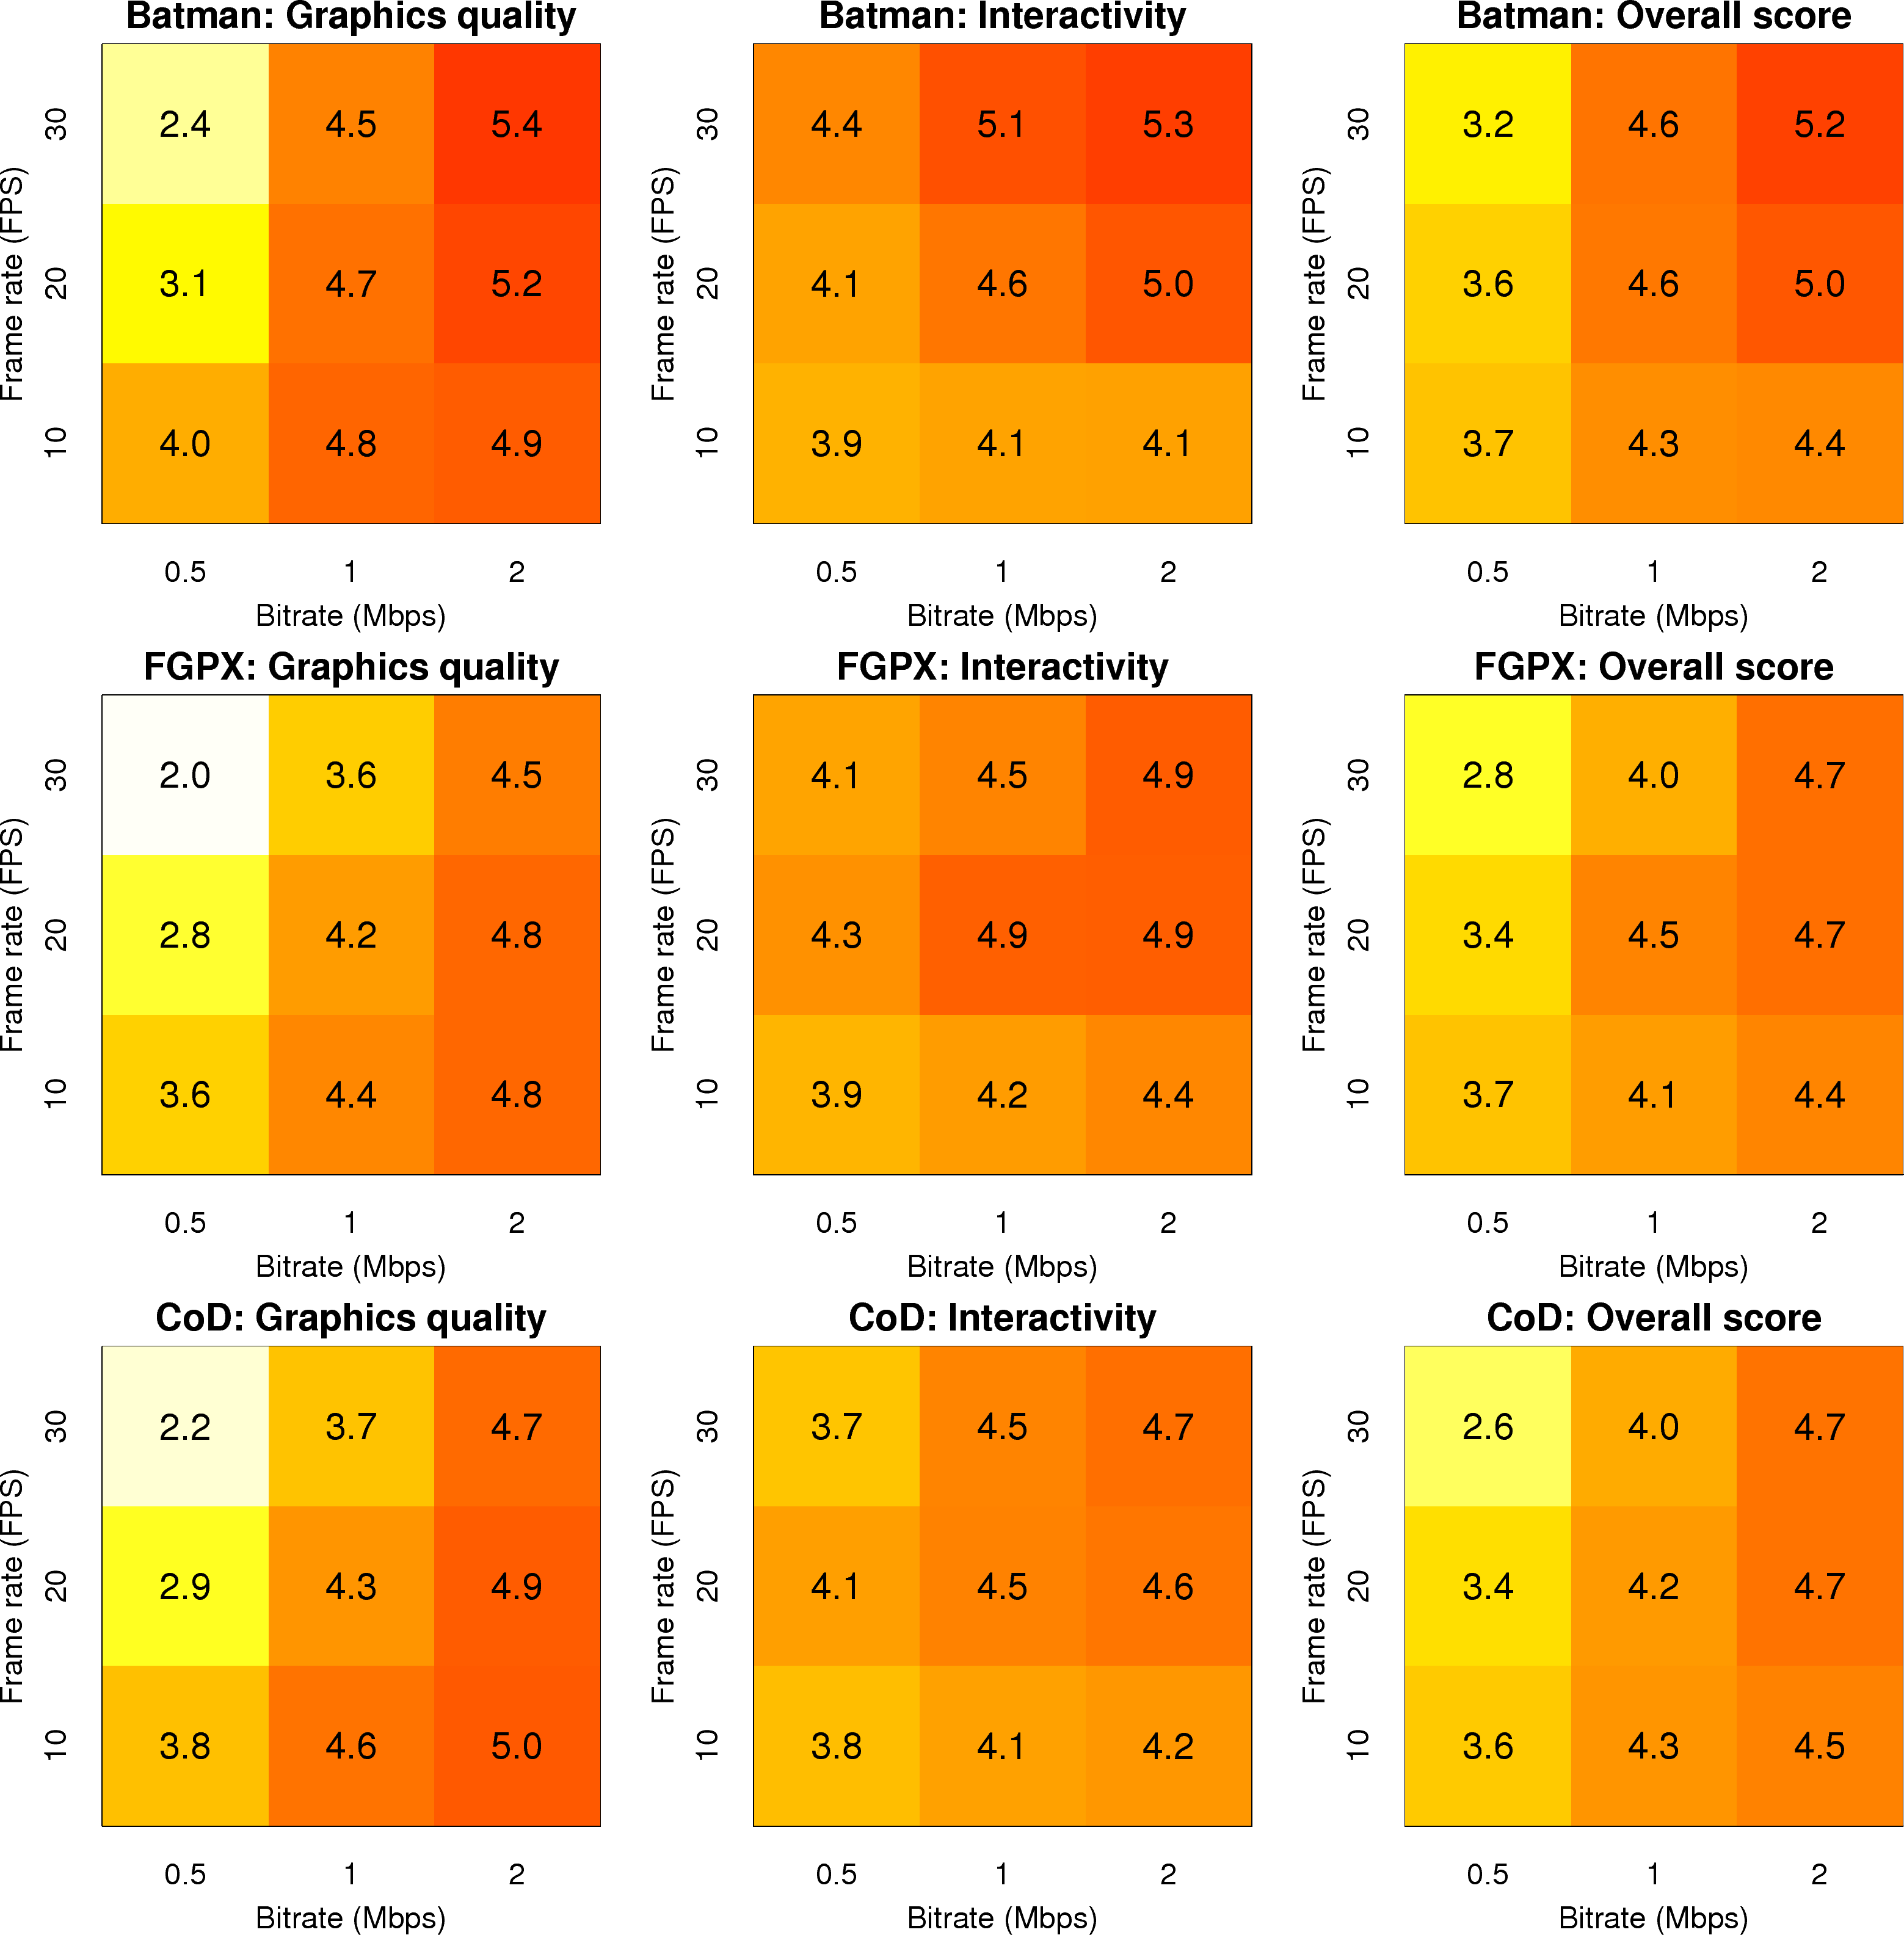
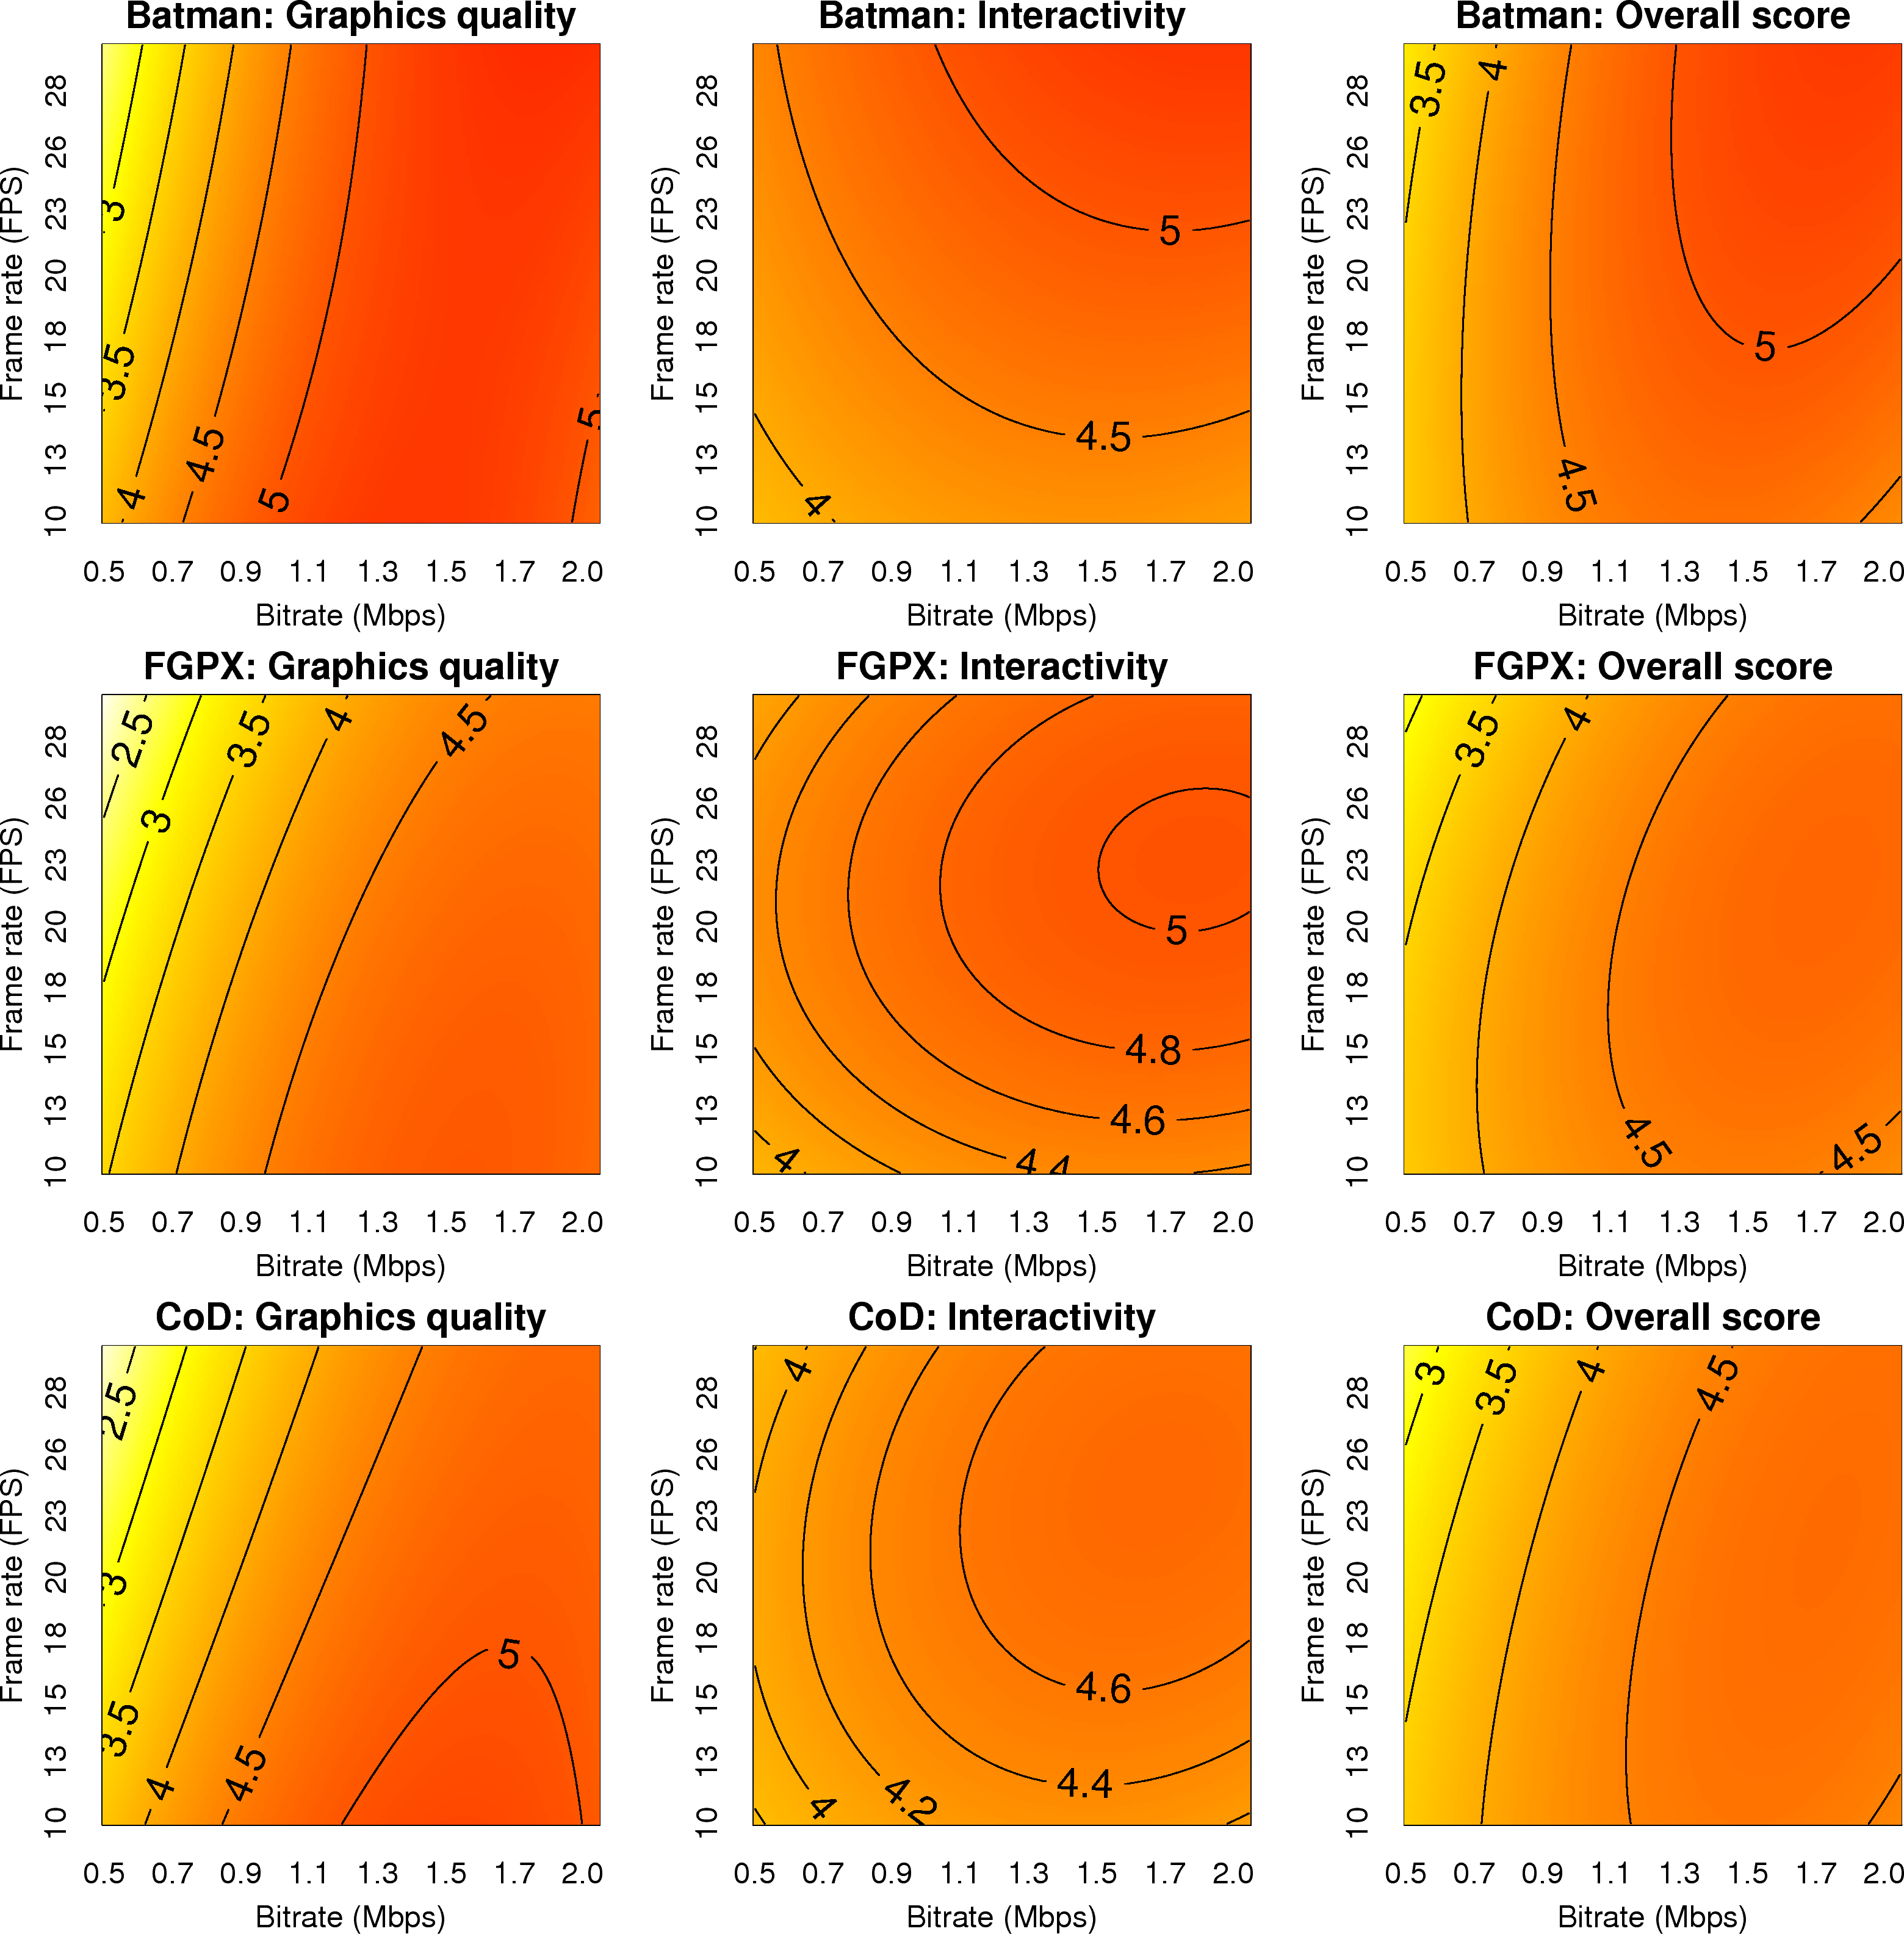
Figure 7: Detailed per-game MOS scores under different configurations (bitrate and frame rate).
Next, we study the implication of different games on MOS scores. The
three considered games are from different game genres. Lego Batman
(Batman) is a 3D adventure game, Sin Cyber Grandprix 2 (FGPX) is a car
racing game, and CoD: Modern Warfare 2 (CoD) is a first-person shooter
game. Among the three games, Batman's game screens consist of rendered
cartoon characters and are easier to compress. The game screens of CoD
and FGPX are more complex and they are in faster pace (especially
FGPX). Such difference can be observed in the per-game overall MOS
scores reported in Figure 6. First, in terms of
graphics quality, Batman outperforms CoD, which in turn outperforms
FGPX. This can be attributed to the less complicated game screens in
Batman, and faster game screen changes in FGPX. Second, in terms of
interactivity, subjects are less picky to the slower-pace Batman. Last,
the overall scores show similar trends as the graphics quality and
interactivity scores.
Next, we plot the per-game MOS scores under different configurations in
Figure 7, which leads to important
observations. First, across the considered games, we see consistent
pattern, similar to the aggregated MOS scores reported in
Figure 5. Second, and more importantly, under the
same configuration, subjects playing different games report different
MOS scores.
This observation, along with earlier ones, concludes that
the MOS scores depend on bitrate, frame rate, and game.
We use the detailed user study results to
derive an empirical MOS model in Section VI, which is
used to estimate the gaming experience under different configurations.
4.4 Impacts of Display Settings on MOS Scores
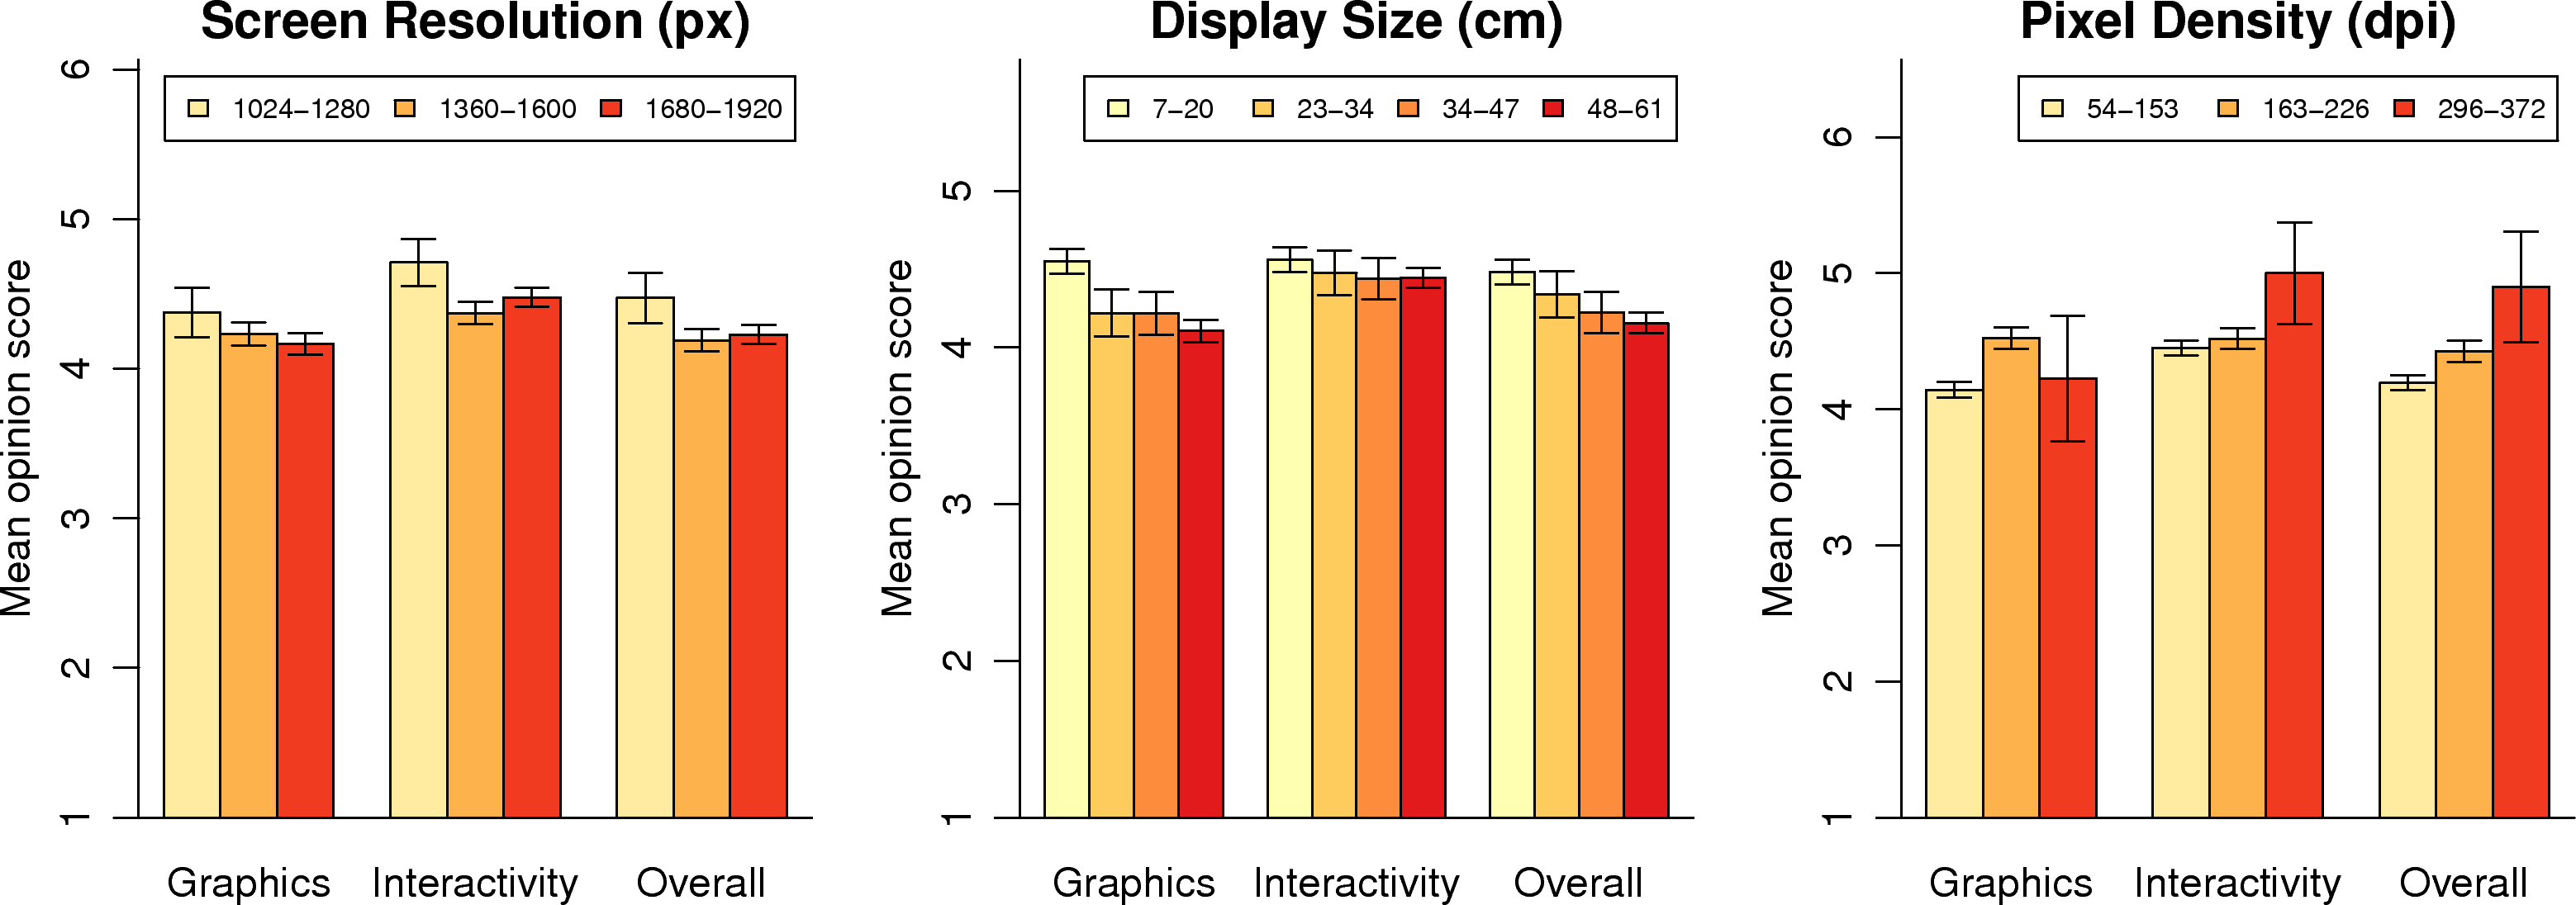
Figure 8: Impacts of display settings on overall MOS scores.
We also report the implication of the display settings on the overall
MOS scores in Figure 8. First, higher screen resolutions result in
lower MOS scores. This is counter-intuitive as it is a common belief
that higher resolutions result in better user experience. We attribute
this observation to the tendency of subjects to deduct MOS scores
when seeing flaws[33]; in other words, higher
resolutions amplify the imperfection if any. Second, larger display
sizes also result in worse MOS scores, which can also be attributed to
the amplified imperfection. Last, if we normalize the screen resolution
and display size into pixel density, we find that higher pixel
densities result in better interactivity and overall MOS scores.
However, the graphics quality suffers when the pixel density is very
low ( ≤ 153 dpi) or very high ( ≥ 296 dpi). To the best of our
knowledge, such observation on cloud gaming platforms has not been made
in other user studies.
4.5 Decomposition of Overall Scores
Figure 9: Decomposition of overall MOS scores on games.
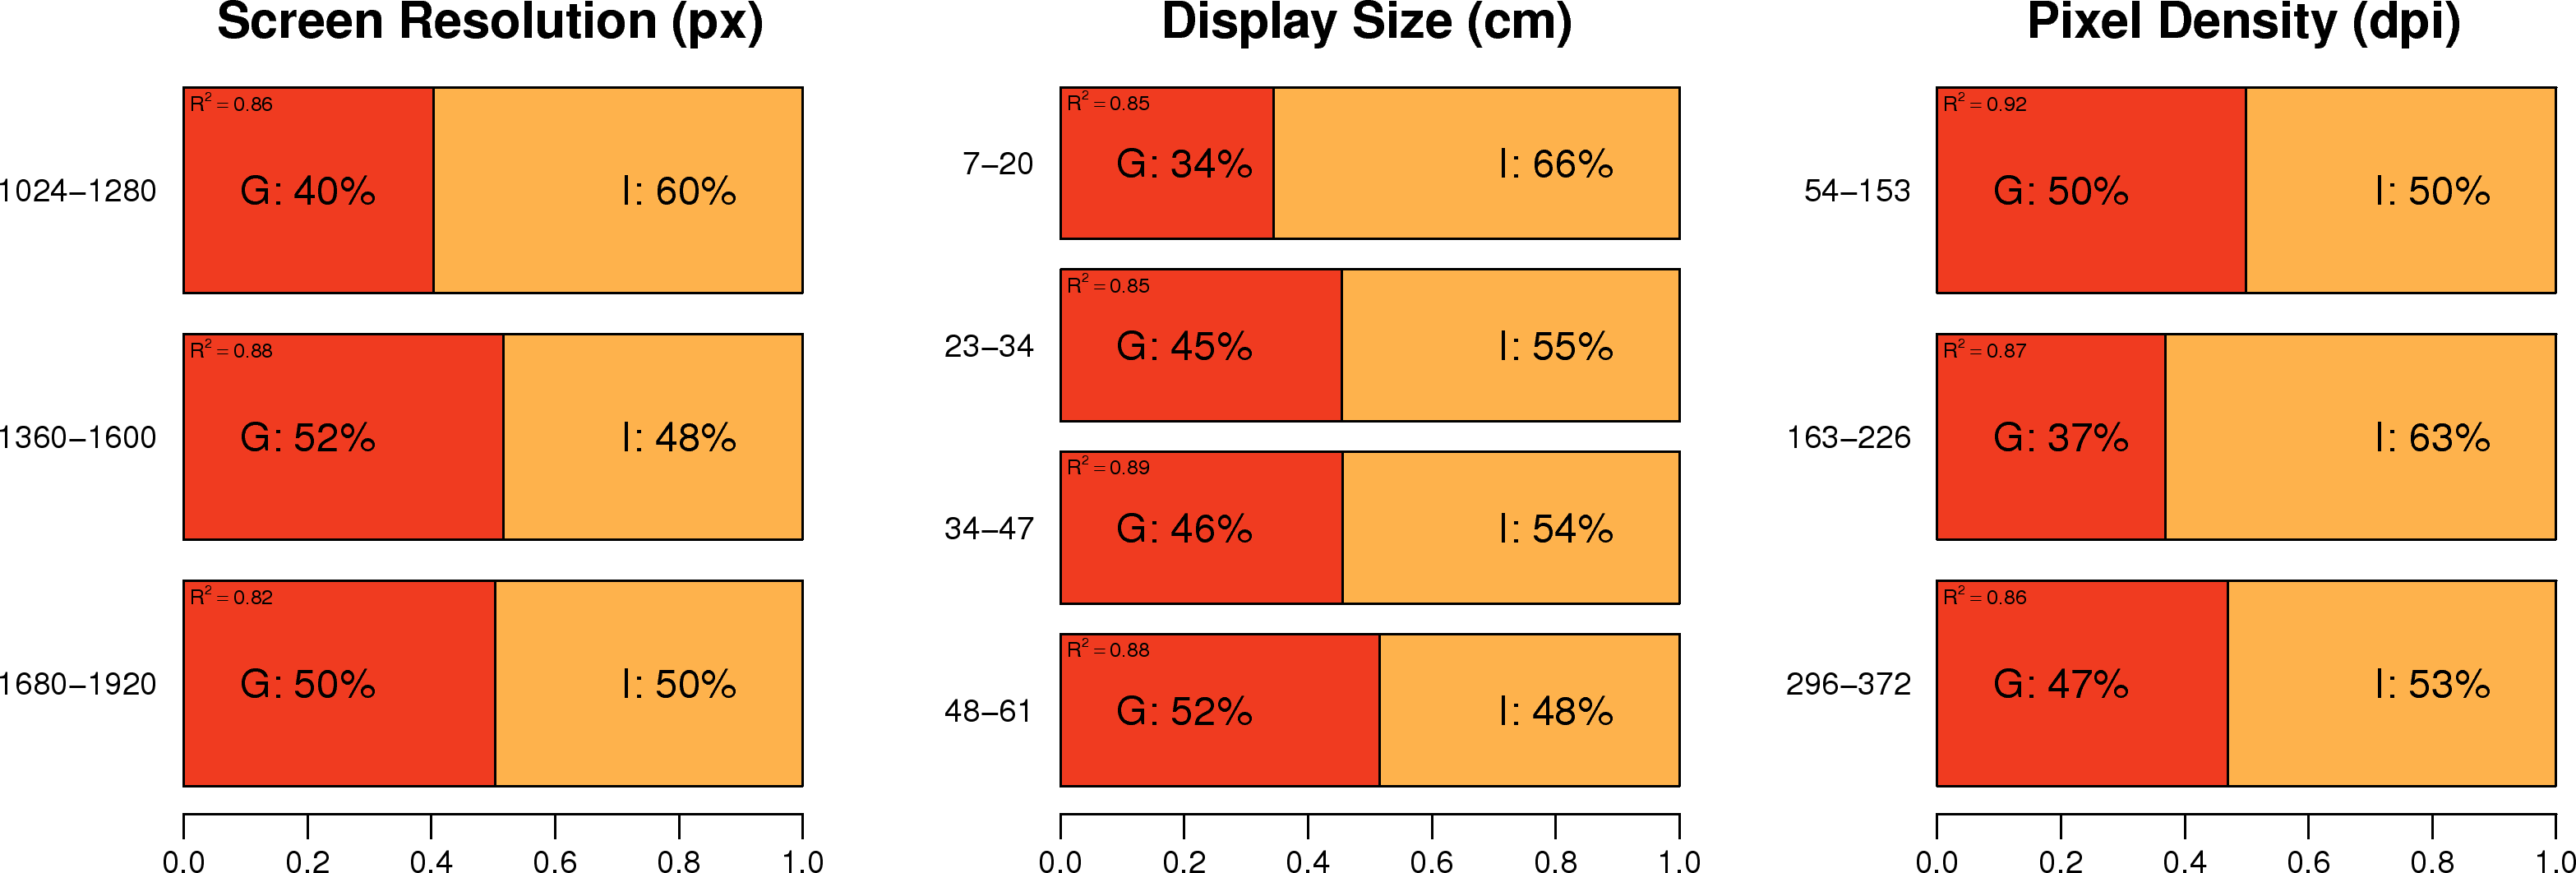
Figure 10: Decomposition of overall MOS scores on display settings.
Last, we study the mapping among the graphics quality, interactivity,
and overall scores. We find that the overall scores can be written as a
weighted linear function of those of graphics quality and interactivity
scores. Figure 9 reports the overall
decomposition for individual games, with adjusted R2 values
annotated. This figure shows that the graphics quality and
interactivity are approximately equally important for all games. FGPX,
as a fast-pace game with complex game screens, leans toward the
graphics quality a bit, but the difference is minor.
However, the variation in overall score decomposition is significant if
we consider the effect of display settings, which we plot in
Figure 10. This figure reveals that higher
resolutions and larger display sizes lead to more weights on the
graphics quality scores. This is consistent with our observations made
in Figure 8: the imperfection is easier to be
noticed by the subjects under higher screen resolutions and larger
display sizes. In addition, Figure 10 also shows
that when the pixel density is low or high, the subjects are more
sensitive to the graphics quality.
5 Reconfiguring Video Codecs in Run Time
We enhance GA to support dynamic video codec
reconfigurations. The improvement covers several aspects, which
are elaborated in this section.
5.1 Migration from ffmpeg to live555
We replace ffmpeg, which supports several codecs and RTSP/RTP
features, with live555 for three major reasons:
(i) It is difficult to add a customized codec into the complicated ffmpeg.
(ii) Using ffmpeg cannot dynamically reconfigure video codecs.
(iii) The RTP feature provided by ffmpeg is tightly coupled with
its implementation. Hence, making a customized non-ffmpeg codec to
work with ffmpeg's RTP stack is not easy.
Unlike ffmpeg, live555 has a built-in RTSP server
implementation. We can use the RTSPServer class to create an
RTSP server object instead of implementing it on our own. However, we
need to create our own RTSP sub-sessions for audio and video streams
and provide corresponding live audio and video sources.
Our current live555-based implementation supports a number of
codecs, namely, MP3, AC3, OPUS (audio codecs) and H.264, H.265, VP8
(video codecs).
Moreover, live555 offers a more comprehensive
RTCP implementation, which allows us to measure and collect the network
statistics, including packet loss rate, bitrate,
round-trip time, and jitter. These numbers can be used as inputs for
optimization algorithms.
Live555 still achieves comparable performance than the ffmpeg-based
GA in terms of game playing latency.
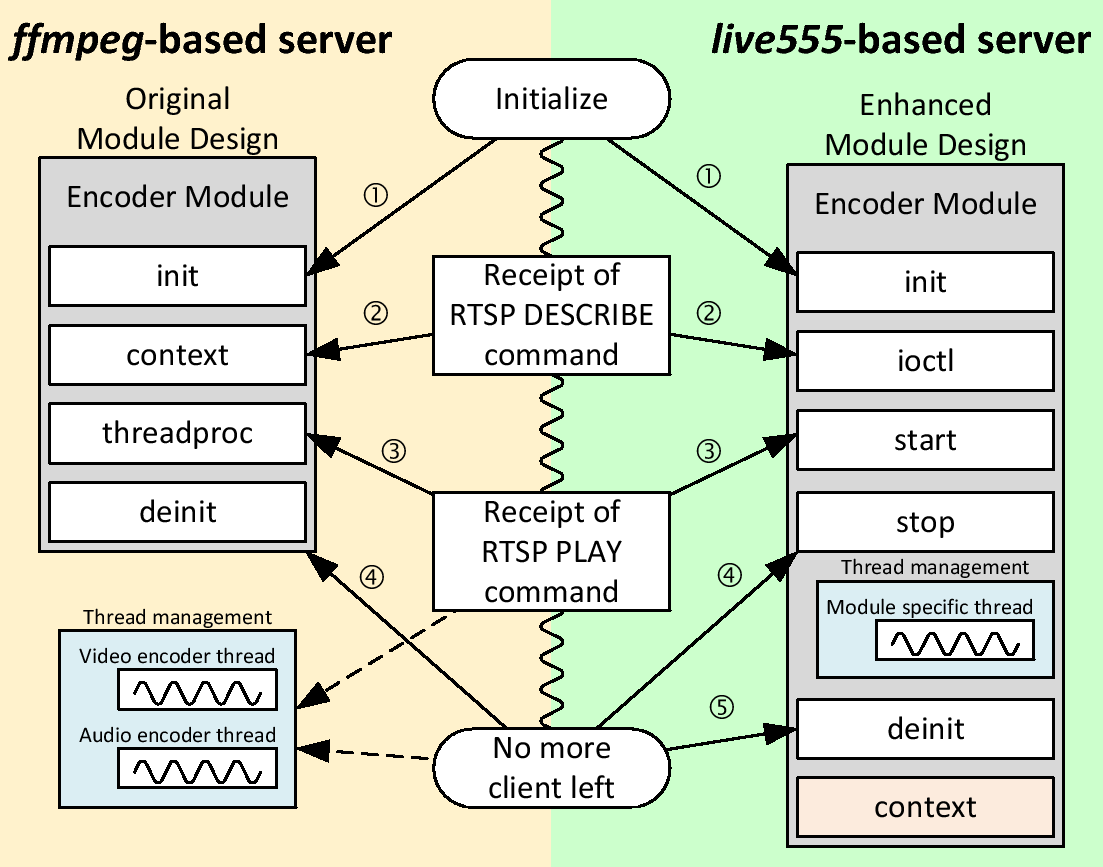
5.2 Enhanced Module Design
Figure 11: Comparison between the original and the enhanced module designs.
Figure 11 compares the original and the enhanced module
design.
The left half of Figure 11 shows the working flow of the
ffmpeg-based server.
The encoder module provides an
interface to the server to retrieve its corresponding codec context. A
codec context is used to generate a SDP (session description protocol)
description, which contains the detailed configuration for an
RTP session, including the adopted codec and associated codec
parameters.
In addition, the original design leaves the management of encoder
threads in the RTSP server. Consequently, the server has to create corresponding
encoder threads, and terminate any running encoder
threads when no clients are connected. Leaving thread management at the
server complicates the implementation of the RTSP server.
The right half of Figure 11 shows the working flow of the
live555-based server. In order to loose the tight relationship
between the server and the modules, we add a new ioctl interface
for GA modules. Therefore, all the GA
components are able to interact with a module using the
ioctl interface.
With the new design, the server now retrieves the required SDP
parameters via the ioctl interface on receipt of a RTSP
DESCRIBE command.
Moreover, the generic ioctl interface also simplifies the task for codec
reconfiguration.
5.3 Codec Reconfiguration
On top of the revised architecture, we implement three H.264
encoder modules that support dynamic codec
reconfiguration.
One is software-based implemented with libx264 and the other two are
hardware-based. The hardware-based codecs work with the
Video Processing Unit (VPU) on Freescale's ARM-based i.MX6 CPU and the
Quick Sync Video (QSV) technology on Intel's HD Graphics and recent
Intel CPUs.
Software-based module. The software-based module is highly flexible
to reconfigure the codec anytime using x264_encoder_reconfig
function.
libx264 provides three rate control modes: ABR, CRF, and CQP.
The ABR mode generates video streams at a given average bitrate, but
the bitrate cannot be changed once the encoder is initialized. Hence, we
stick with either the CRF or the CQP modes, configured via
the crf and qp parameters, respectively.
The generated video
bitrate using CRF and CQP largely depends on the complexity of a frame and the degree of
changes between adjacent frames. We can nevertheless limit the maximum
bitrate by specifying both the vbv-maxrate and
vbv-bufsize parameters. To understand the effect of the CRF
parameter, we measured the relationship between the CRF parameter and
the bitrate of the generated video stream. In the experiments, we stream a 720P
music video at different frame rates from a GA server to a
client over a wireless network. The valid CRF value ranges from 0
(lossless) to 51 (very lossy), where a lower CRF value generates a
better quality video in principle. Since we are working with H.264's
main profile, the minimum valid CRF value is 1 and the default CRF
value adopted by libx264 is 23.
Table II shows that when the vbv-maxrate parameter is
much lower than the required CRF setting,
some mosaic blocks appear on video frames while the rest part of the
frames is clear. This may be because the rate control algorithm runs
out of the available bits specified by vbv-maxrate in the
middle of encoding a frame, it has to switch to low-quality
configurations for un-encoded parts. Such quality degradations happen
when the two parameters (i.e., CRF and vbv-maxrate) are
largely mismatched, which indicates that a careful tuning of such
parameters is required.
Table 2: Measured bitrate under various CRF settings
Measured bitrate
Measured frame loss rate
Frame rate
CRF
Min
Max
Min
Max
Avg.
24
1
2.5Mbps
36Mbps
0%
0%
0%
12
2.2Mbps
12Mbps
0%
0%
0%
23
1.3Mbps
4.1Mbps
0%
0%
0%
37
600Kbps
1.1Mbps
0%
0%
0%
51
150Kbps
450Kbps
0%
0%
0%
30
1
2.9Mbps
41Mbps
0%
0%
0%
12
2.6Mbps
13Mbps
0%
0%
0%
23
1.6Mbps
4.5Mbps
0%
0%
0%
37
750Kbps
1.2Mbps
0%
0%
0%
51
169Kbps
476Kbps
0%
0%
0%
50
1
4.9Mbps
43Mbps
0%
34.49%
10.19%
12
4.0Mbps
16Mbps
0%
0.42%
0.12%
23
2.3Mbps
5.4Mbps
0%
0.23%
0.04%
37
991Kbps
1.5Mbps
0%
0.12%
0.0003%
51
221Kbps
602Kbps
0%
0.13%
0.0000%
Hardware-based module. The other two hardware-based encoder modules
are based on VPU and QSV
technologies, respectively. They generally achieve
shorter encoding latencies and incur lower CPU loads than
software-based modules. However, such efficiency may
sacrifice the flexibility.
The VPU implementation supports H.264 hardware codecs with the baseline, main, and high
profiles. VPU requires the YUV420 format and supports the dynamic
reconfiguration of the bitrate, frame rate, GOP number, and slice mode,
via the vpu_EncGiveCommand API. Such reconfiguration can be
done in either the frame level or the macroblock level.
The QSV implementation supports several hardware-based
codecs. Meanwhile, they provide quite a few Video Pre-Processing (VPP)
operations, such as color space conversion, resizing, and de-interlacing.
The encoders provided by QSV only support
the NV12 pixel format; thus we use its VPP feature to
convert the original pixel format of the source frames to NV12.
QSV also supports codec reconfiguration in run time,
but it is less flexible.
From its SDK reference manual, it supports at least the run-time
reconfiguration of the video bitrate without resetting an encoder. In
case an encoding parameter cannot be dynamically reconfigured, the
encoder will be reset.
QSV supports several rate control modes, including CBR, VBR, CQP, and
AVBR. If the bitrate capping is required, one can choose CBR, VBR, or
AVBR mode. In CBR and AVBR mode, only the target bitrate
(TargetKbps) can be reconfigured, where both the target bitrate
and max bitrate (MaxKbps) can be
reconfigured in VBR mode at run time.
We have integrated both hardware encoders into GA.
5.4 Effective Bandwidth Estimation
We implement a bandwidth estimator inspired by WBest [34] to estimate
the effective bandwidth. Different from other
proposals [34,[35,[36], we leverage existing video packets for
effective bandwidth estimation, without incurring network overhead. We can do
this for two reasons: (i) the workload of sending video packets is high (for
30-fps videos, we send a frame every 33 ms) and (ii) the size of a video frame
is typically higher than MSS (Maximum Segment Size), so each video frame is
split into multiple back-to-back packets. Our bandwidth estimator keeps track
of the dispersion time of the video packets. To cope with fluctuations, we
select the median value as the estimated capacity from every W packets. We
then send video packets at the estimated capacity to measure the effective
bandwidth with W video packets. The value of W is empirically selected by
experiments, and we consider W ∈ {100,200,300,400,500}. The estimation
accuracy with W=100 is 50% in the worst case. In other cases (200 ≤ W ≤ 500), the accuracy is as high as 80+% and the differences among
different W values are smaller than 5%. Hence, we let W=200
as default for shorter reaction time.
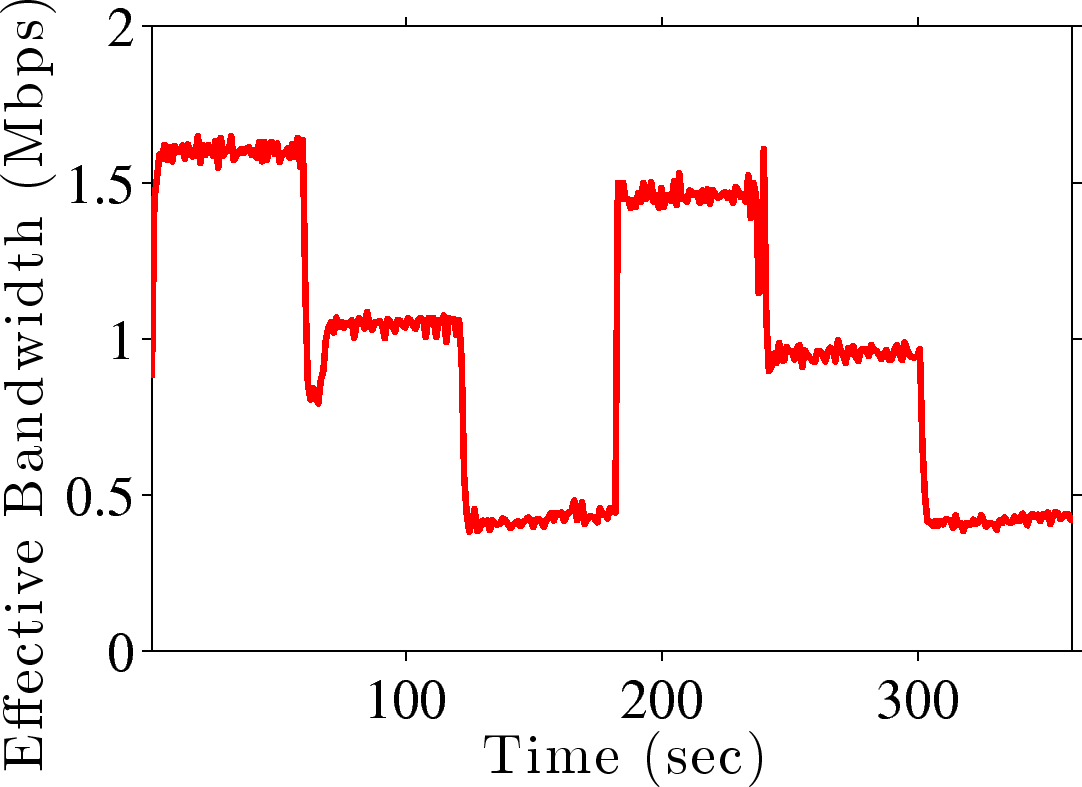
(a)
(b)
Figure 12: The measured: (a) effective bandwidth and (b) frame rate.
5.5 Experiments on a Real Testbed
We conduct real experiments to show the
effectiveness of our reconfiguration feature. We set up a testbed with a GA
server and a GA client, and connect them via a Dummynet box.
GA's off-the-shelf video codecs allow
us to adaptively reconfigure video bitrate and frame rate. The
bitrate is reconfigured to be the estimated effective bandwidth and the frame
rate is chosen using Eq. (4) in Section VI.
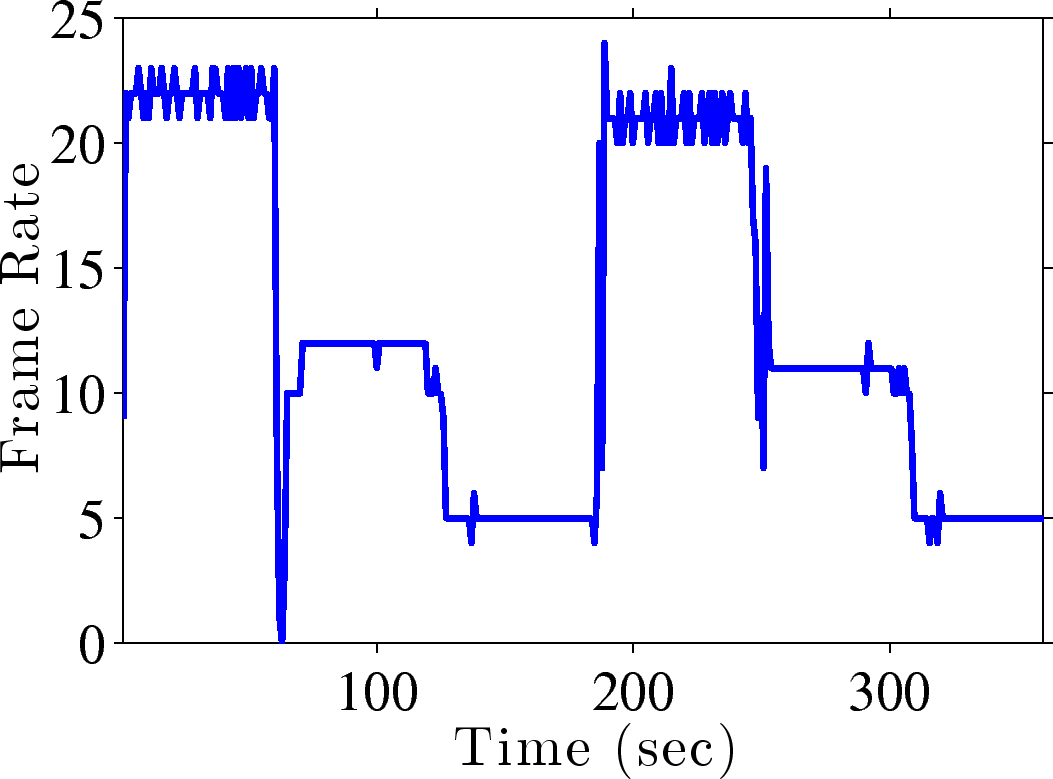
Next, we evaluate the adaptive GA platform running CoD as follows. We write a script on the
Dummynet box to repeatedly switch the bandwidth among 2048, 1024, and 512 kbps
once every 60 secs. We then adaptively reconfigure the video bitrate and frame
rate. Figure 12(a) reveals that our bandwidth estimator
successfully detects the bandwidth changes. Figure 12(b)
shows that the codec parameter selector quickly recovers from sudden frame rate
drops due to throttled bandwidth, by adjusting the video coding parameters
(bitrate and frame rate). Our experiments demonstrate how our cloud gaming platform
adapts to network dynamics for a single gamer. We consider the adaptation problem
across multiple gamers sharing a bottleneck link in the next section.
6 Adapting Videos of Multiple Gamers in Dynamic Networks
We solve the resource allocation problem among
multiple gamers. Our proposed algorithm runs on the portal server.
Figure 13: Adapting videos of GA servers in a data center.
6.1 Notations and Model
We consider a data center serving U gamers as illustrated in
Figure 13, where each gamer is connected to a GA server.
All U GA servers share an outgoing link of the data center, and we let R be
the current available link bandwidth. The value of R is
fluctuating due to the background traffic, and we employ Exponentially Weighted
Moving Average (EWMA), or similar techniques, to estimate the R value. We let f (1 ≤ f ≤ F) and b (1 ≤ b ≤ B) be frame rate and
bitrate, respectively and they are specified by the system
administrators. We let g (1 ≤ g ≤ G) be the game supported by the
cloud gaming platform, and pu be the game played by gamer u, where 1 ≤ u ≤ U and 1 ≤ pu ≤ G. We let mg,f,b be the MOS score of playing
game g at frame rate f and bitrate b, which can be derived via
off-line user studies or online regression.
For concrete discussions, we adopt
the user study reported in Section IV-C in general, and in
Figure 7 in specific, to empirically model the MOS
scores.
We note that our MOS model is designed to drive the codec reconfiguration
decisions at the GA server, rather than estimate the actual user experience at
the GA client. The MOS model implicitly considers the available bandwidth, and
ignores the network latency. This is because the network latency is not
controllable by GA server/client during ongoing cloud gaming sessions.
When a game session is affected by higher packet loss rate or longer end-to-end delay, our
bandwidth estimator (Section V-D) reports lower effective bandwidth.
Then, the codec parameter selector picks a new target bitrate (as a function of effective bandwidth),
using the MOS model that converts the bitrate and frame rate into the expected MOS score.
Different from our MOS model, there are full-fledged QoE
models in the literature for precise user experience. For example, Game Mean Opinion Score
(GMOS) [29,[30,[31] is an objective quality metric, which is a function of codec, frame
rate, resolution, PSNR (Peak Signal-to-Noise Ratio), network latency, and
packet loss rate. Compared to our simple MOS model, GMOS is too complicated
for video codec reconfiguration purpose.
More importantly, the additional complexity comes from factors that are not directly controllable by the GA server/client.
Table 3: The MOS Models for Individual Games
-48pt
-48pt
-48pt
Batman
FGPX
CoD
-48pt
-48pt
(1)
(2)
(3)
-48pt
-48ptfps, αg,1
0.010 (0.036)
0.038 (0.041)
-0.011 (0.037)
-48ptrate (Mbps), αg,2
2.940^*** (0.484)
2.297^** (0.553)
2.529^** (0.491)
-48ptI(fps[^\mkern6mu]2), αg,3
-0.001 (0.001)
-0.002 (0.001)
-0.001 (0.001)
-48ptI(rate[^\mkern6mu]2), αg,4
-1.150^*** (0.176)
-0.868^** (0.201)
-0.939^** (0.178)
-48ptfps:rate, αg,5
0.043^** (0.008)
0.036^** (0.009)
0.037^** (0.008)
-48ptConstant, αg,6
2.248^** (0.428)
2.369^** (0.490)
2.621^*** (0.434)
-48pt
-48ptR2
0.988
0.981
0.987
-48ptAdjusted R2
0.968
0.949
0.966
-48ptF Stat. (df = 5; 3)
49.518***
31.040***
46.130***
-48pt
-48pt
Note:*p < 0.1; **p < 0.05; ***p < 0.01
Figure 14: Illustration of the resulting per-game QoE models.
We tried several popular functions, and decided to use the
following quadratic MOS model:
m(g,f,b) = αg,1f+αg,2b+αg,3f2+αg,4b2+αg,5fb+αg,6,
(1)
where αg,1-αg,6 are game-specific model parameters. The
goodness-of-fit statistics are summarized in Table III,
which demonstrates that the model closely follows the results of our
user study. The derived models are visualized in
Figure 14, which are consistent with the ground-truth
reported in Figure 7.
We note that, deriving the model parameters may not be trivial, and
there are a number of ways to ease the burden. For example, one may
classify the computer games into a few genres such that games in the
same genre share similar video and game play characteristics or
therefore are similarly friendly to cloud gaming QoE [7].
In addition, a service provider can
continuously and probabilistically collects users' experience ratings
via simple questions to derive game-specific models. Such post-session
questionnaires are frequently adopted by various online services.
Next, we let [^k]u and \checkku be the maximal and minimal bitrates
of gamer u, respectively. The minimal \checkku is assigned by the system administrator
based on some practical concerns. For example, a rule-of-thumb may indicate any
bitrates less than 50 kbps do not produce meaningful reconstructed videos,
leading to \checkku = 50 kbps. [^k]u, on the other hand, comes
from a common property of hybrid video coders: the video quality saturates when
the bitrate is increased [37].
Hence, it yields less significant improvements while the bitrate is
increased beyond, e.g., [^k]u = 5 Mbps.
Moreover, the gamer's access
link may be narrow and shared by multiple users/applications, leading to a
bandwidth limitation on u's access link. [^k]u is also used to
accommodate this bandwidth limit: the administrator can set [^k]u to be
the minimum between the link bandwidth limitation and the quality-saturating
bitrate, so that the allocated bitrate to u will not be wasted.
6.2 Problem Statement
Our adaptation problem is to select the best frame rate and bitrate
for each gamer, in order to maximize the overall gaming quality under the bandwidth constraints. We consider two
optimization criteria: (i) maximizing the average MOS score and (ii) maximizing the
minimum MOS score across all gamers. We refer to these two optimization problems as:
(i) quality-maximization and (ii) quality-fairness problems, respectively throughout this article. We
let xu and yu (∀ 1 ≤ u ≤ U) be the decision variables,
where 1 ≤ xu ≤ F (frame rate) and 1 ≤ yu ≤ B (bitrate). With the defined notations, we
write our problem with the quality-maximization objective as:
_u=1^U m_p_u, x_u, y_u
_u=1^U y_u R;
_u^ y_u^ _u^, 1 u^ U;
1 x_u F, 1 y_u B, 1 u U.
For the quality-fairness objective, we replace Eq. (2a) with:
maximize
U min
u=1
mpu, xu, yu.
(2)
The optimization problems are solved periodically, say once every T seconds
in order to accommodate to the system and network dynamics. In the next two
sections, we present optimal and efficient algorithms to solve the problems.
6.3 Optimal Algorithms
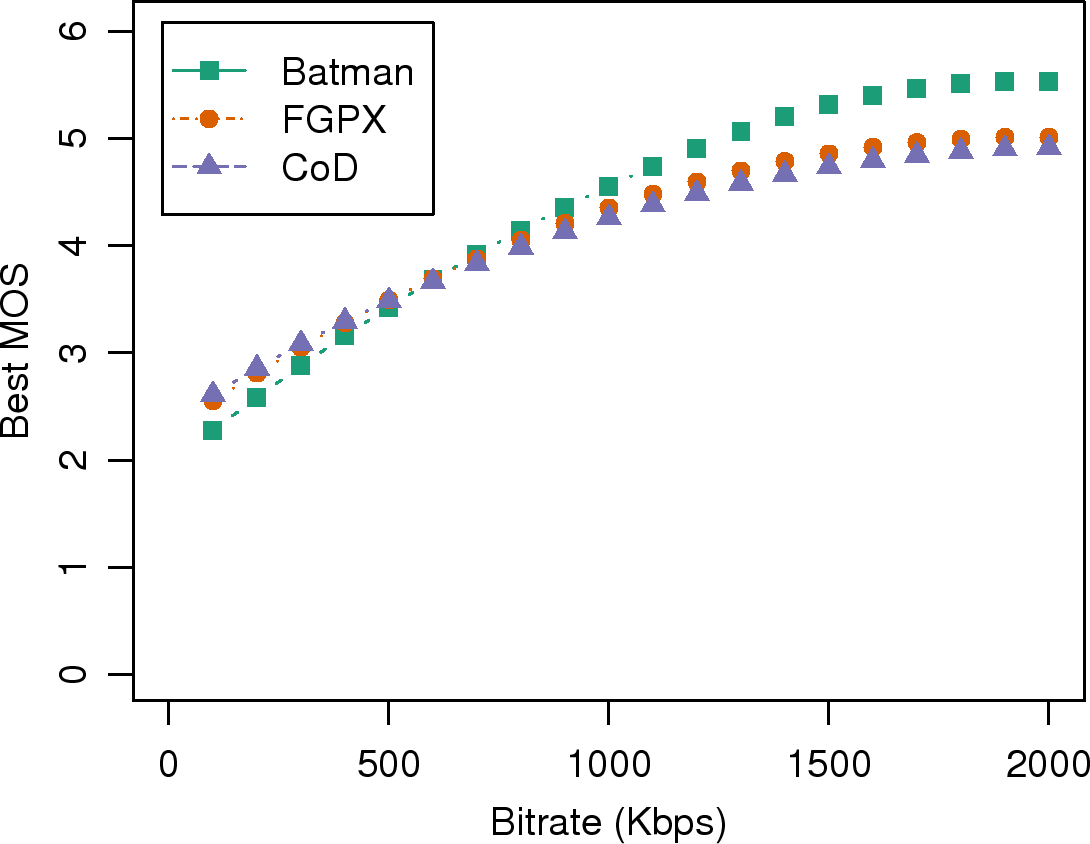
Figure 15: The best MOS scores under different bitrates.
Solving the quality-maximization and quality-fairness problems is challenging
due to the complex relations among the frame rates, bitrates, games, and MOS
scores. The problems can be solved using commercial problem solvers, such as
CPLEX [38].
The CPLEX comes with two solvers: the CPLEX solver and the CP solver. In our
problems, because of the min(imum) operation in Eq. (3), we have to
use the CP solver. We refer to the CPLEX based algorithms for the
quality-maximization and quality-fairness problems as OPTavg and
OPTmm, respectively.
(a)
(b)
(c)
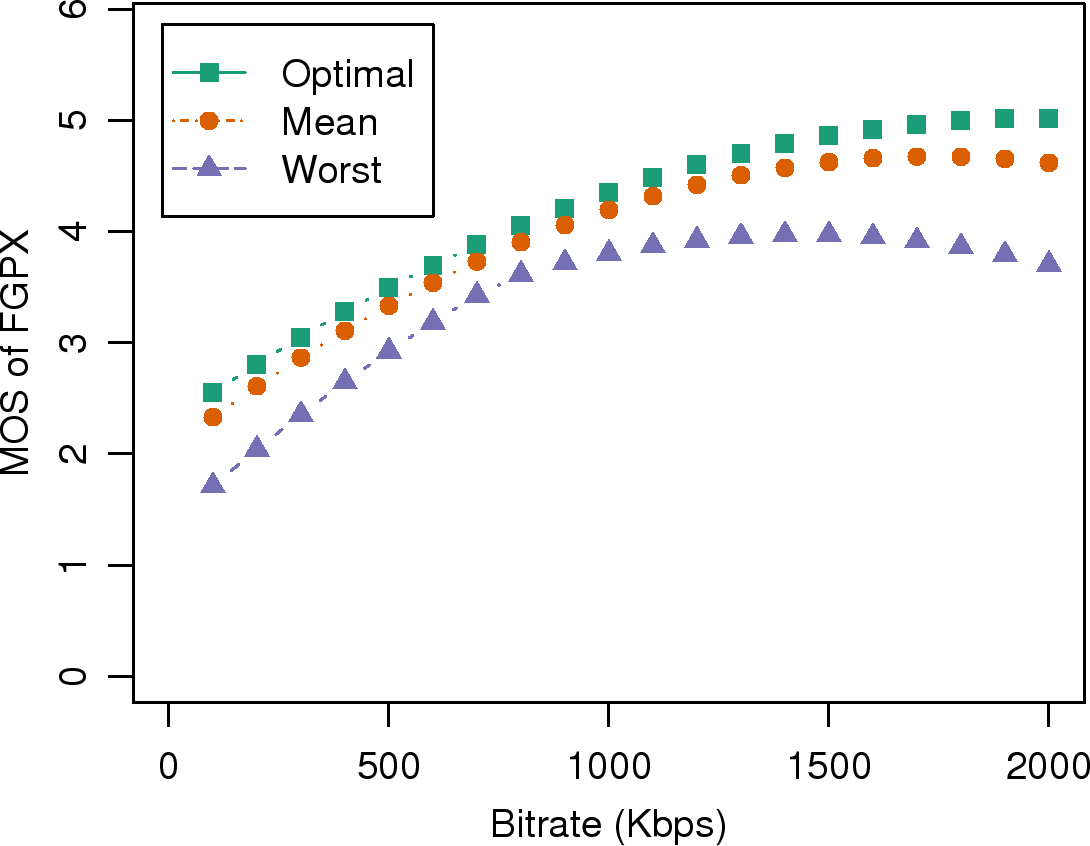
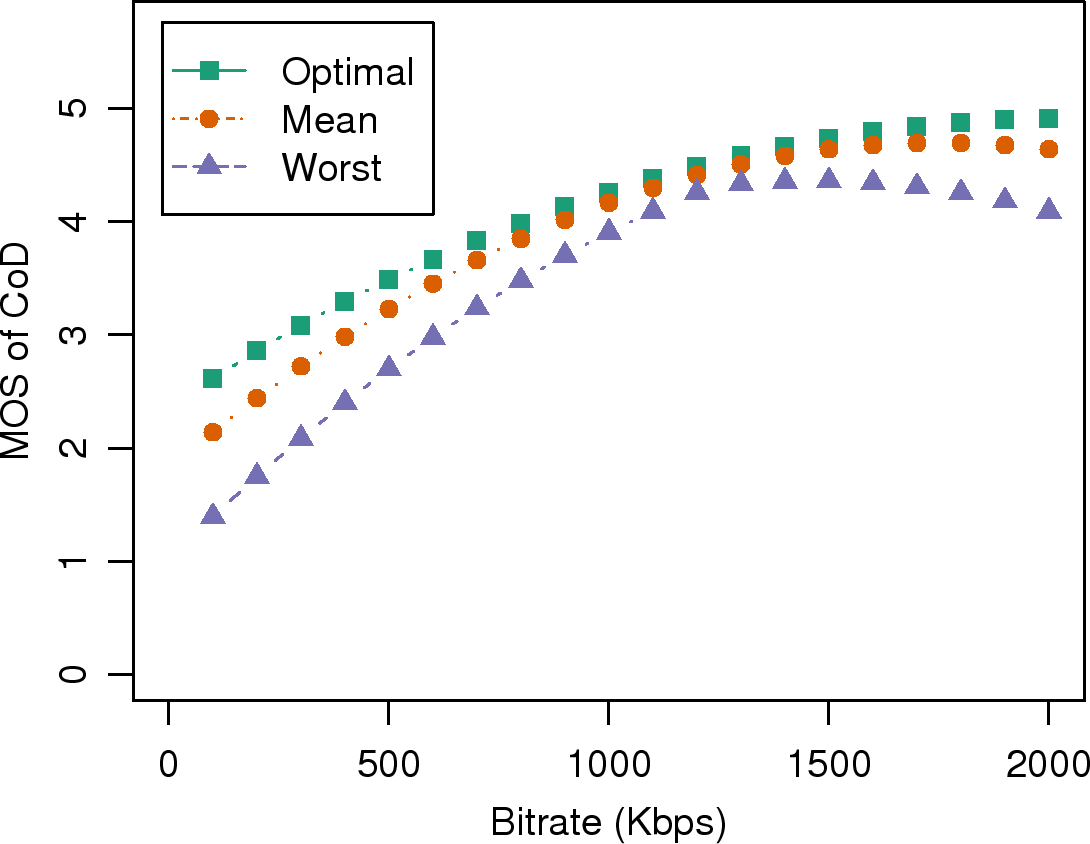
Figure 16: Benefits of choosing optimal frame rate of different games: (a) Batman, (b) FGPX, and (c) CoD.
6.4 Efficient Algorithms
While the OPTavg and OPTmm algorithms give the optimal bitrate
allocation, they suffer from exponential running time, and are not suitable to
real-time systems like cloud gaming platforms. Next, we develop two efficient
algorithms. The intuition behind the efficient algorithms is iteratively
allocating some bandwidth to the gamer that can boost the objective function
value the most. Given that we iteratively add more bitrate to each gamer,
the bitrate of any gamer is known at each step.
By taking the partial derivative of Eq. (1) with respect to
f, we have the optimal frame rate as:
f*(b,g) =
−(αg,1+αg,5b)
2αg,3
,
(3)
which selects the optimal coding parameter for a gamer playing game g at
the accumulated bitrate b. Next, we write the MOS scores under f*(b,g)
as mos*(g,b), where:
mos^*(g,b) =
_g,1f^*(g,b)+_g,2b+_g,3(f^*(g,b))^2
+
_g,4b^2+_g,5f^*(g,b)b+_g,6.
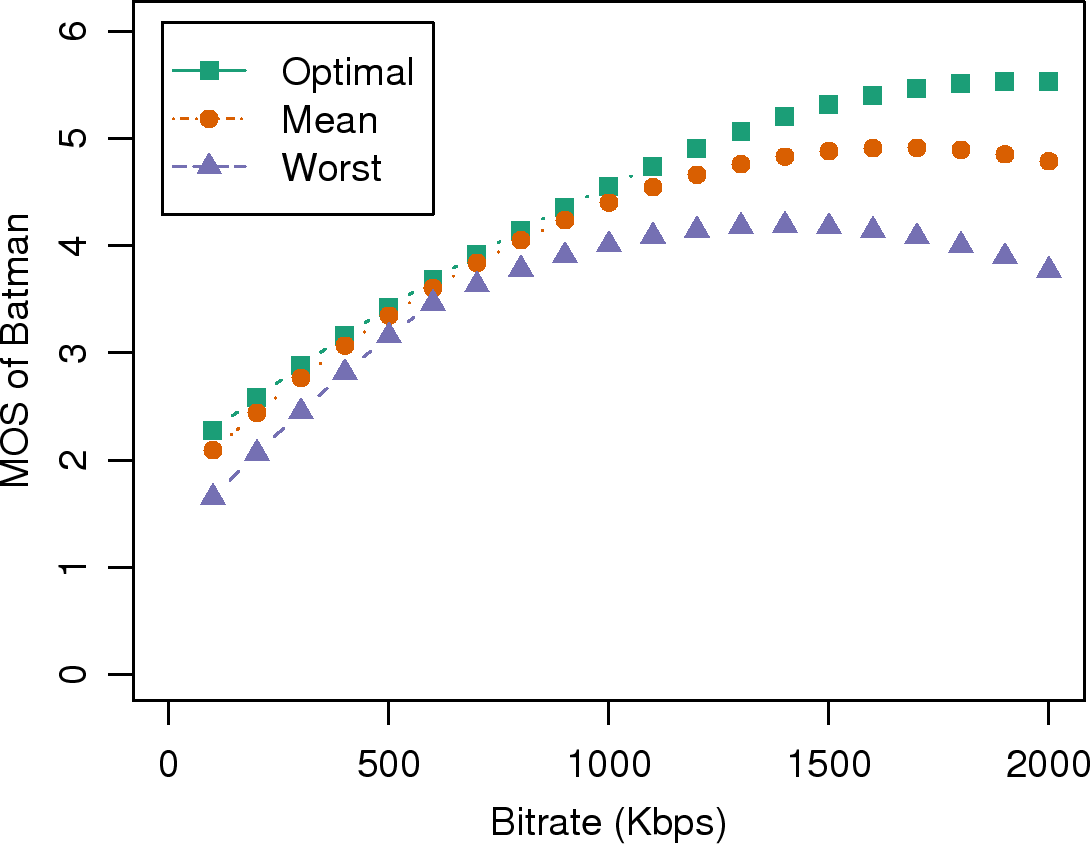
We plot the best MOS scores mos*(g,b) derived from the model parameters
(given in Table III) in Figure 15. This figure
shows that mos*(g,b) curves are monotonically increasing and saturate at
∼ 2 Mbps. We also plot the optimal, mean, and worst MOS scores of different games in
Figure 16. This figure reports that how much benefit
we can get when choosing the bitrates using Eq. (4).
The gaps between the optimal and the worst MOS scores in Batman, FGPX, and CoD are up to 1.885, 1.410, and 1.122,
respectively. Such gaps are nontrivial, and thus show the effectiveness of our approach.
Using Eqs. (4) and (5), we essentially
transform the problem of choosing the best xu (frame rate) and yu
(bitrate) into selecting the best yu. For the efficient algorithms, we start
from setting [^(yu)]=\checkku for all 1 ≤ u ≤ U, and
iteratively add bitrate to the gamer that needs additional bitrate the most. We
let w be the unit of allocating additional bitrate, and set w = 1 kbps if
not otherwise specified. At each step, we define an MOS score improvement
function cu as:
cu = mos*(pu,
^
yu
+w) − mos*(pu,
^
yu
),
(4)
which quantifies the benefits of investigating bandwidth w to gamer u. We
also use [^R] to denote the residue bandwidth on the bottleneck link.
For the quality-maximization problem, we iteratively allocate w to the gamer with
the highest MOS improvement cu that has not exceeded the bandwidth limitation
and quality-saturating bitrate (Eq. (2c)). More specifically, we
first put all U gamers in a heap sorted on their cu in the descending
order. We then follow this order to allocate the residue bandwidth until
we reach the limitation of the constraint ∑u=1U [^(yu)] ≤ R. The
pseudocode of our proposed EFFavg is given in Figure 17.
For the quality-fairness problem, we iteratively allocate w to the gamer playing
with the lowest MOS score. More specifically, we first put all the gamers in a
heap sorted on their current MOS scores mos*(pu, [^(yu)]) in the
ascending order. We then follow the order to allocate w to gamer u, as long as the allocation
does not violate the limitation of the constraint ∑u=1U [^(yu)] ≤ R. The pseudocode of our proposed EFFmm is given in
Figure 18.
[1]
let [^R] = R
store gamers in a heap on quality improvement cu(·) in the dsc. order
pop and remove the gamer u with the maximal cu(·) from the heap
let [^(yu)]=[^(yu)]+w
let [^R] = [^R]−w
insert the gamer u to the heap
remove gamer u from the heap
let yu* = [^(yu)] ∀ 1 ≤ u ≤ U
return all yu*
Figure 17: The pseudocode of the EFFavg algorithm.
[1]
let [^R] = R
store gamers in heap on MOS scores mos*(·) in the asc. order
pop and remove the gamer u with the minimal mos*(pu, [^(yu)]) from the heap
let [^(yu)]=[^(yu)]+w
let [^R] = [^R]−w
insert the gamer u to the heap
remove gamer u from the heap
let yu* = [^(yu)] ∀ 1 ≤ u ≤ U
return all yu*
Figure 18: The pseudocode of the EFFmm algorithm.
Lemma 1[Optimality of EFFmm]
The EFFmm algorithm produces optimal bitrate allocation.
The EFFmm algorithm always allocates residue bandwidth w to gamer u
with the lowest MOS score at each step. Consider any alternative allocation of
w to a gamer u′ ≠ u. We note that adding w to yu′
does not improve the objective function value in Eq. (3). Compared
to allocating w to u, this alternative allocation must be followed by
allocating another w bandwidth to u to reach the same objective function
value, as gamer u is the gamer with the lowest MOS score. Hence, no
alternative allocation can lead to better solution when [^R] = 0. This
yields the lemma.
Lemma 2[Optimality of EFFavg]
The EFFavg algorithm produces optimal bitrate allocation if the slope of
mos*(g,b) monotonically decreases when the bitrate is increased.
The MOS score improvement cu defined in Eq. (6) is proportional to
the slope. Since EFFavg allocates residue bandwidth to the gamer with the
highest cu, the algorithm always finds the steepest slope at the current
step (locally) and across all future steps (globally). This yields the lemma.
Next, we check whether the slope of mos*(g,b) is monotonically decreasing
under the empirically-derived model parameters. First, we take double
derivative of mos*(g,b) in Eq. (5), which leads to:
mos^*(g,b)^ =
2_g,4-_g,5^2/2_g,3.
mos*(g,b) is monotonically
decreasing if the value of this equation is negative. The model
parameters in Table III satisfy the condition. Hence EFFavg is optimal.
Lemma 3[Time Complexity]
The EFFavg and EFFmm algorithms terminate in polynomial time.
We first create the max heap and min heap for EFFavg and EFFmm,
respectively. For the outer loop, we go through all residue bandwidth
[^R]. We also make sure that in each iteration, the value of [^R] is
decreased at least w kbps, which is a small integer. Hence, the complexity
of the outer loop is O(R). Inside the loop, we first pop and remove the first gamer.
In this step, the time complexity is
O(log(U)). Next, we check the condition and try to modify the bitrate of the
gamer u. If the bitrate is changed, we insert u to the heap and decrease
the value of [^R], which also costs O(log(U)).
Hence, the complexity of the two efficient algorithms is O(Rlog(U)).
(a)
(b)
(c)
(d)
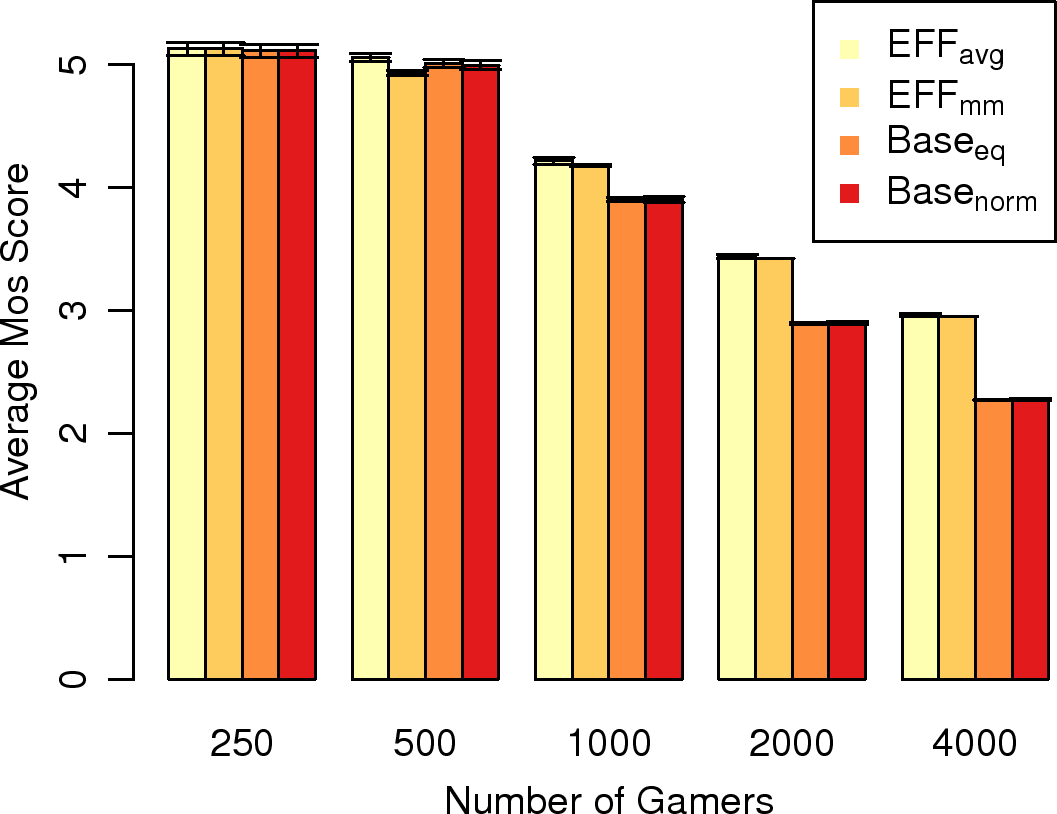
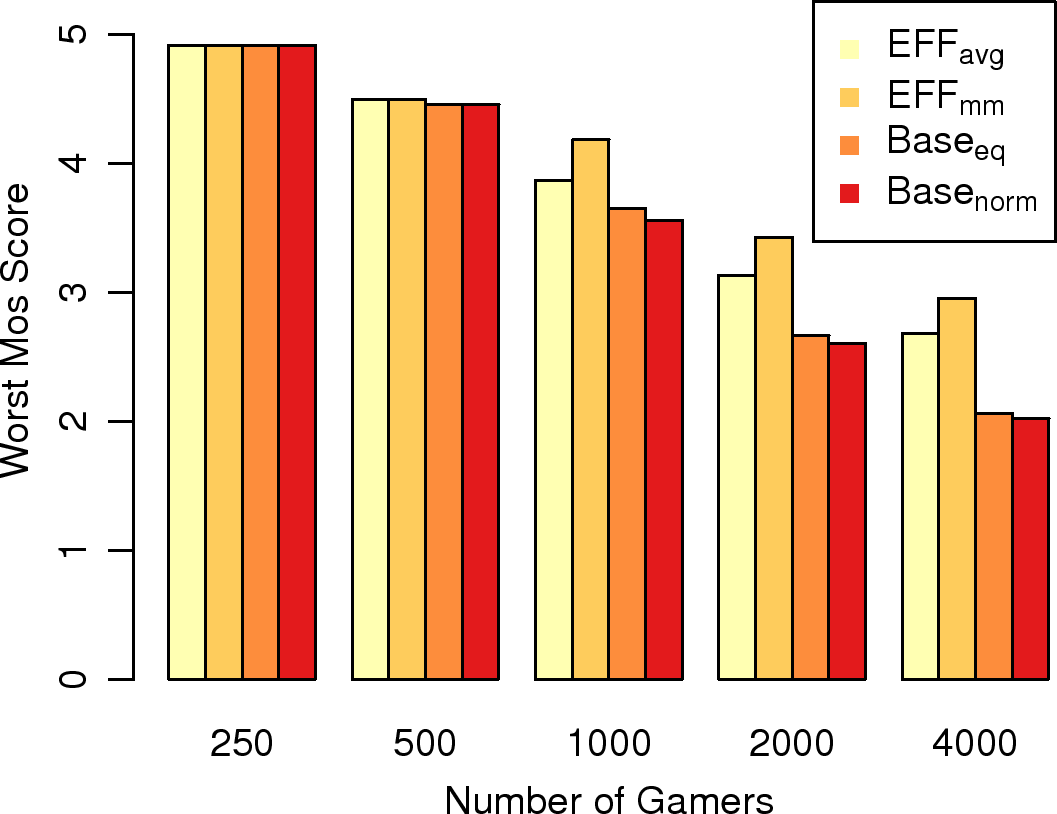
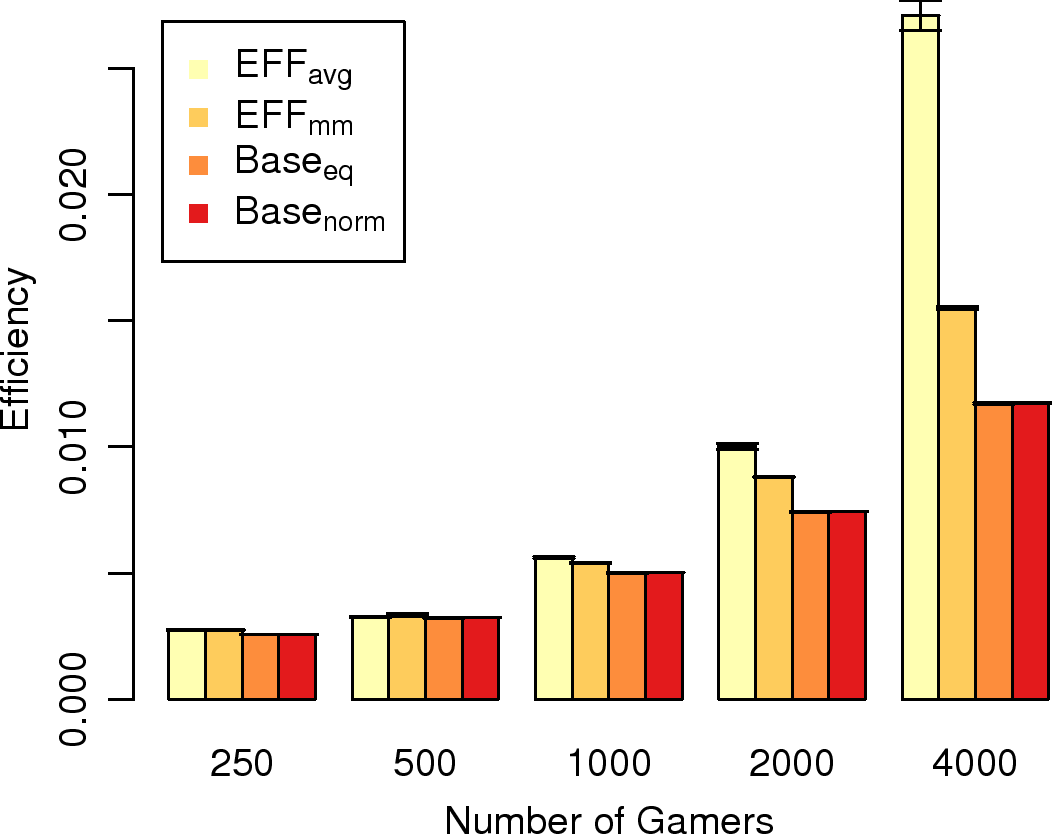
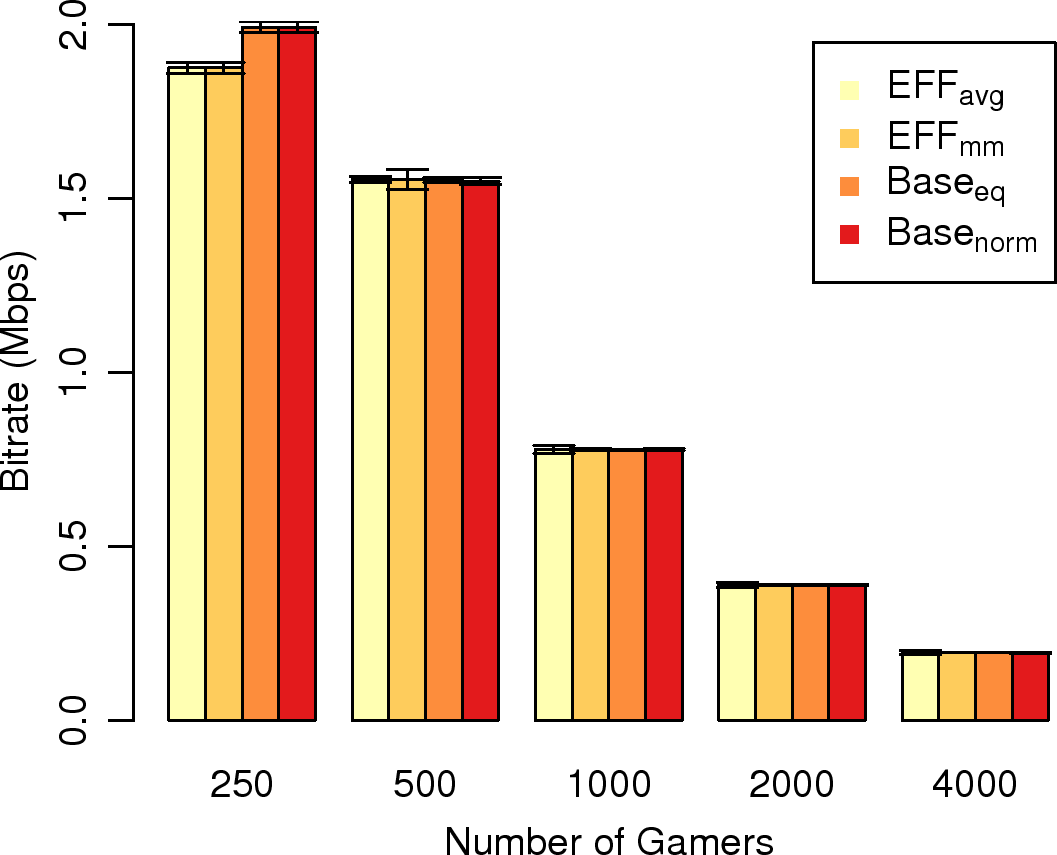
Figure 19: Performance of different algorithms: (a) mean MOS scores, (b) worst MOS scores, (c) overall efficiency, and (d) allocated average bitrate per gamer.
7 Evaluations
7.1 Setup
We build our simulator using Java and implement the proposed efficient
algorithms in the simulator. For comparisons, we also implement two baseline
adaptation algorithms called Baseeq and Basenorm. The Baseeq
algorithm equally allocates the available network resources to the gamers.
Basenorm algorithm allocates the available network resources to gamers
proportional to the average MOS scores of the games played by individual gamers
(cf. Figure 7). For example, the overall MOS score
of Batman is higher, and Basenorm allocates more network resources to
Batman for better overall MOS scores. For brevity, Baseeq and
Basenorm set the frame rate to be 30 fps if not otherwise specified.
For realistic simulations, we drive the simulator using real traces. Each new
gamer u is randomly assigned a bandwidth [^k]u based on the worldwide
bandwidth dataset collected between January and October 2014 [39].
Each gamer also randomly selects a game from Batman, FGPX, and CoD. We use
Amazon EC2 and PlanetLab nodes to collect traces of data center bandwidth R.
We create an EC2 instance in Virginia, and select
four PlanetLab nodes at the US East Coast. We use iperf to measure the
bandwidth from the EC2 to each PlanetLab node once every 15 minutes for a whole
day on October 12, 2014. Then, for each sample, we pick the maximal bandwidth
across all four nodes, and use it as the data center bandwidth R. The average
R over the 96 samples is 760 Mbps.
simulator to solve the adaptation problem once every T=60 seconds if not otherwise specified. We vary
the number of gamers U ∈ {250, 500, 1000, 2000, 4000}.
We run the simulations on a PC with a 2.8 GHz i7 processor
and 16 GB memory. The considered metrics are:
MOS: the overall MOS score. We report both average MOS scores
across all gamers, and the worst MOS scores among them. They align with
objective functions of the quality-maximization and quality-fairness problems.
Bitrate: the bitrate consumed by each gaming session.
Efficiency: the ratio between the MOS score over the consumed bandwidth in Mbps.
Running time: the execution time of each run of the adaptation algorithms.
In the next section, we report average results with 95% confidence intervals
whenever applicable.
Table 4: MOS Scores of the Efficient and Optimal Algorithms
OPTavg
EFFavg
OPTmm
EFFmm
Mean
Mean
Worst
Worst
100
5.16
5.16
1
5.53
5.53
200
5.15
5.15
2
5.01
5.01
400
5.15
5.15
4
4.91
4.91
800
4.49
4.49
8
4.91
4.91
Table 5: Running Time of the Efficient and Optimal Algorithms (s)
OPTavg
EFFavg
OPTmm
EFFmm
Mean
Max
Mean
Max
Mean
Max
Mean
Max
100
0.02
0.03
0.090
0.097
1
0.02
0.01
0.009
0.009
200
0.15
0.16
0.102
0.103
2
0.36
0.37
0.015
0.016
400
0.95
0.96
0.153
0.157
4
4.47
4.48
0.022
0.023
800
5.01
5.02
0.237
0.248
8
125.8
127.1
0.029
0.029
7.2 Results
Comparisons between the optimal and efficient algorithms.
We first compare the efficient algorithms against the optimal ones. Invoking
OPTavg and OPTmm potentially takes prohibitively long time, and thus
we set U ∈ {100, 200, 400, 800} and U ∈ {1, 2, 4, 8} for
OPTavg and OPTmm, respectively. We run each setting for a day and
report the average MOS scores and running time in Tables IV
and V. Table IV shows that our
proposed efficient algorithms indeed produce the optimal adaptations, as proved
in Lemmas 1 and 2. Table V
reveals that the efficient algorithms run much faster than the optimal
ones: more than 21 and 4337 times of running time reductions are observed.
The running time gap is going to be even bigger with more gamers, as EFFavg
and EFFmm run in polynomial time, but OPTavg and OPTmm do not.
Given that the efficient algorithms achieve the optimal adaptations in polynomial
time, we no longer consider the optimal algorithms in the rest of this section.
Comparisons between the efficient and baseline algorithms.
We first report the performance results of the efficient and baseline
algorithms in Figure 19. Figure 19(a) and
19(b) show that the proposed EFFavg and EFFmm achieve the
design goals: (i) EFFavg leads to the highest average MOS scores and (ii)
EFFmm results in the highest worst MOS scores. Moreover, they
outperform the two baseline algorithms by up to 30% and 46%.
Figure 19(c) reveals that EFFavg leads to higher efficiency
than EFFmm, but both of them outperform the baseline algorithms. Last,
Figure 19(d) shows that when U ≥ 500, all four algorithms
allocate roughly equal bitrate to gamers. This indicates that the superior
performance of our efficient algorithms is not built upon excessive resource
consumption. We take a closer look by reporting the link utilization in
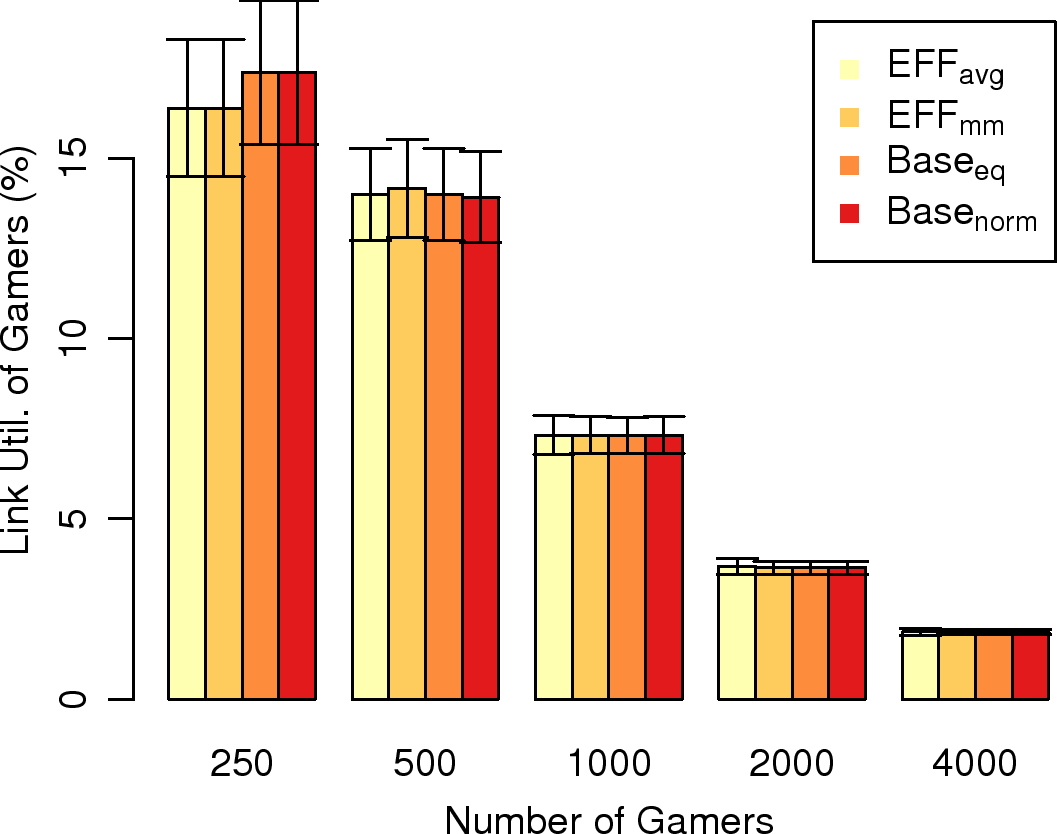
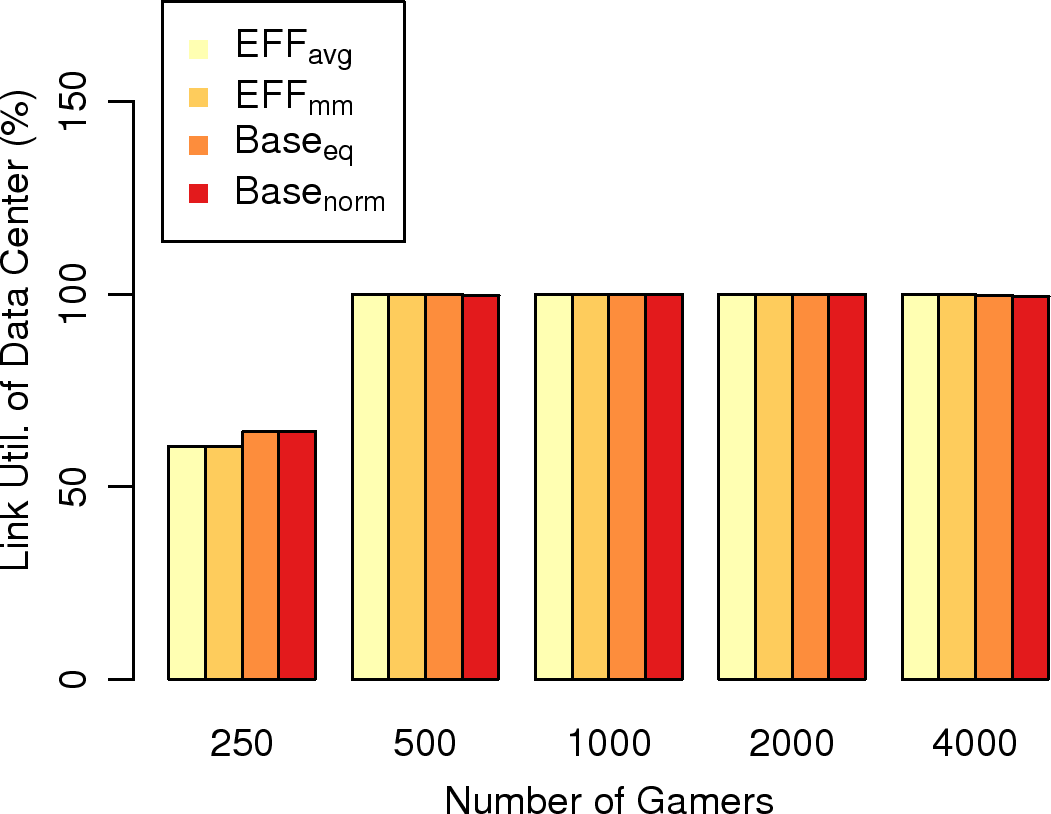
Figure 20. Figure 20(a) reveals that our
efficient algorithms lead to gamer link utilization no larger than that of the
baseline algorithms. Furthermore, more gamers result in lower gamer link
utilization, indicating that the bottleneck is at the data center. This is
confirmed by Figure 20(b): the data center link
utilization reaches 100% when there are more than 500 gamers. Another
observation on Figure 20 is that no algorithm overloads the links,
which illustrates the correctness of our algorithm design and simulator
implementation.
(a)
(b)
Figure 20: Link utilization: (a) across all gamers and (b) of the data center under different adaptation algorithms.
(a)
(b)
Figure 21: Mean MOS scores under different numbers of gamers using two adaptation algorithms: (a) EFFavg and (b) EFFmm.
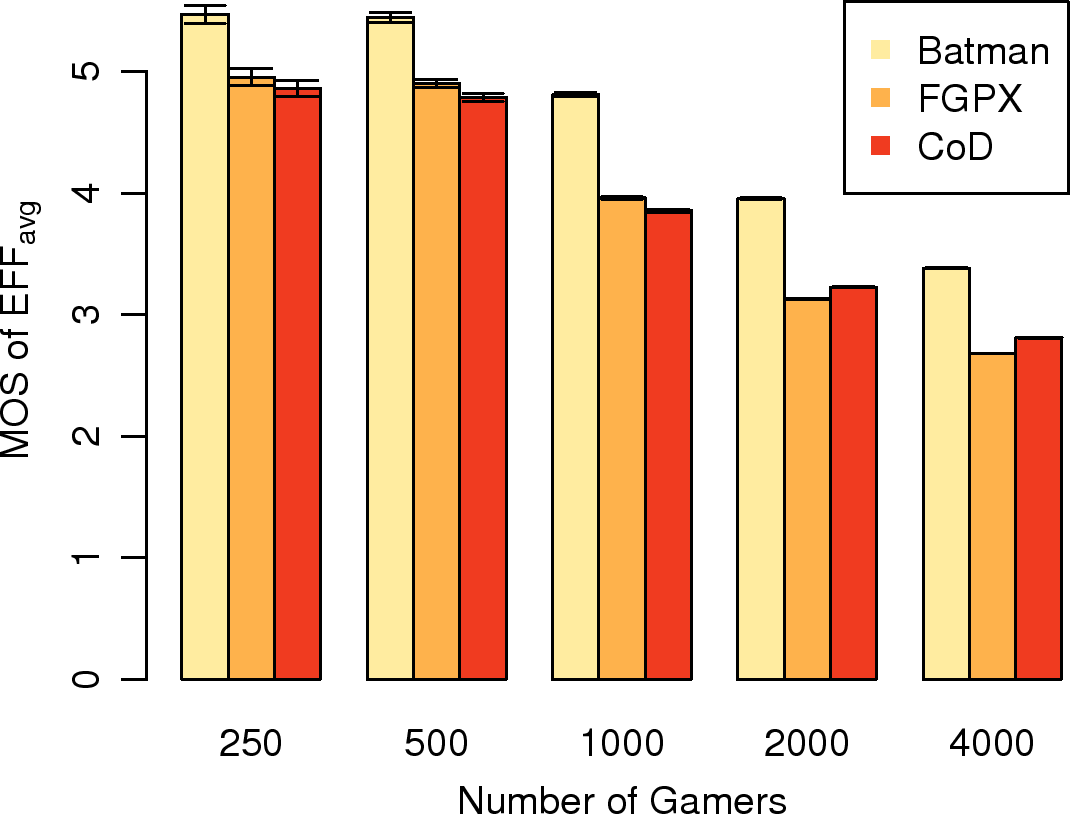
Difference between EFFavg and EFFmm.
The two efficient algorithms target different optimization criteria, and are
optimal in terms of mean MOS scores and minimum MOS scores, respectively. We plot
the average MOS scores of individual games in Figure 21.
Figure 21(a) shows that with EFFavg, the gamers
playing Batman achieve higher MOS scores, which can be attributed to the
optimization criterion: investing bandwidth on Batman leads to higher
improvement on the MOS scores. In contrast,
Figure 21(b) demonstrates that EFFmm indeed
achieves fairness on the MOS scores: gamers playing all three games achieve the
same MOS score except when U=250. A closer look (cf.
Figure 20(b)) indicates that when there are fewer
gamers, there are actually more than enough bandwidth for all gamers to achieve
the highest MOS scores. This demonstrates that our EFFmm algorithm is
designed in a way that it does not only maintain fairness, but also capitalize
all the available resources.
Implication of different data center available bandwidth.
We report the MOS scores under different values of R ∈ {0.5R, 1R, 2R, 4R}
in Figure 22. It shows that higher available bandwidth
leads to smaller gap between our efficient algorithms and the baseline
algorithms. This can be explained by
Figure 22(b). It shows that higher available
bandwidth results in low data center link utilization. More specifically, when
the data center bandwidth increases, gamers' links become the bottlenecks. This
reduces the optimization room of our algorithms, and results in smaller gaps.
Our efficient algorithms scale to large problems.
To verify the scalability of our efficient algorithms, we measure the running
time of the EFFavg and EFFmm algorithms under various number of
gamers. We report the average running time in Table VI,
which shows that it takes at most ∼ 1.7 seconds to solve an adaptation
problem with more than 8000 gamers, showing that the efficient algorithms
scale to large cloud gaming platforms.
Table 6: Running Time in Seconds
EFFavg
EFFmm
Mean
Max
Mean
Max
500
0.181
0.183
0.179
0.184
1000
0.296
0.299
0.287
0.290
2000
0.523
0.531
0.520
0.533
4000
1.000
1.104
1.060
1.066
8000
1.677
1.681
1.654
1.661
(a)
(b)
Figure 22: Impacts of different available bandwidth R: (a) average MOS scores and (b) data center link utilization.
8 Conclusion
In this paper, we studied the problem of adapting cloud gaming sessions to
maximize the gamer experience in dynamic environments in three steps. First, we
conducted a crowdsourcing-based user study to measure and model the
gamer experience under different video codec configurations. Second, we
enhanced GA, an open-source cloud gaming platform to support video codec
reconfigurations, which allows the cloud gaming platform to adapt the frame
rate and bitrate of each cloud gaming session on-the-fly. Third, with the gamer
experience model and adaptation mechanism, we presented two formulations with
different optimization criteria of: (i) maximizing the average MOS scores
across all gamers and (ii) maximizing the minimum MOS scores among all gamers.
We then proposed two optimal and two efficient algorithms to solve these two
adaptation problems. We analytically showed that the proposed efficient
algorithms run in polynomial time, yet achieve optimal adaptations. We
carried out extensive trace-driven simulations, and the simulation results
comply with our analysis. In addition, the proposed efficient algorithms: (i)
outperform the baseline algorithms by up to 46% and 30%, (ii) run fast and
scale to large ( ≥ 8000 gamers) problems, and (iii) indeed achieve the
user-specified optimization criteria. The enhanced cloud gaming platforms will
be made publicly available, which can be leveraged by many researchers,
developers, and gamers.
References
[1]
"Why cloud hosting is the future of online gaming," April 2014,
http://www.developer-tech.com/news/2014/apr/15/why-cloud-hosting-future-online-gaming2/.[2]
"OnLive web page," July 2014, http://www.onlive.com/.[3]
"GaiKai web page," July 2014, http://www.gaikai.com/.[4]
"Ubitus web page," July 2014, http://www.ubitus.net.[5]
"Internap online gaming," July 2014,
http://www.internap.com/solutions/industry/online-gaming/.[6]
K.-T. Chen, C.-Y. Huang, and C.-H. Hsu, "Cloud Gaming Onward: Research Opportunities and Outlook," in Proceedings of IEEE C-Game 2014, 2014.
[7]
Y.-T. Lee, K.-T. Chen, H.-I. Su, and C.-L. Lei, "Are All Games Equally Cloud-Gaming-Friendly? An Electromyographic Approach," in Proceedings
of IEEE/ACM NetGames 2012, Oct 2012.
[8]
K.-T. Chen, Y.-C. Chang, H.-J. Hsu, D.-Y. Chen, C.-Y. Huang, and C.-H. Hsu,
"On The Quality of Service of Cloud Gaming Systems," IEEE
Transactions on Multimedia, Feb 2014.
[9]
H.-J. Hong, D.-Y. Chen, C.-Y. Huang, K.-T. Chen, and C.-H. Hsu, "Placing Virtual Machines to Optimize Cloud Gaming Experience," IEEE
Transactions on Cloud Computing, Jan 2015.
[10]
M. Claypool, D. Finkel, A. Grant, and M. Solano, "Thin to win? network
performance analysis of the onlive thin client game system," in Proc.
of ACM Annual Workshop on Network and Systems Support for Games
(NetGames'12), Venice, Italy, October 2012.
[11]
"GamingAnywhere: An open source cloud gaming project," 2013,
http://gaminganywhere.org.[12]
C.-Y. Huang, K.-T. Chen, D.-Y. Chen, H.-J. Hsu, and C.-H. Hsu,
"GamingAnywhere: The First Open Source Cloud Gaming System," ACM
Transactions on Multimedia Computing Communications and Applications, pp.
1-25, Jan 2014.
[13]
P. Eisert and P. Fechteler, "Low delay streaming of computer graphics," in
Proc. of IEEE International Conference on Image Processing (ICIP'08),
San Diego, CA, October 2008, pp. 2704-2707.
[14]
A. Jurgelionis, P. Fechteler, P. Eisert, F. Bellotti, H. David, J. Laulajainen,
R. Carmichael, V. Poulopoulos, A. Laikari, P. Perala, A. Gloria, and
C. Bouras, "Platform for distributed 3D gaming," International
Journal of Computer Games Technology, vol. 2009, pp. 1:1-1:15, January
2009.
[15]
S. Shi, C. Hsu, K. Nahrstedt, and R. Campbell, "Using graphics rendering
contexts to enhance the real-time video coding for mobile cloud gaming," in
Proc. of ACM Multimedia (MM'11), Scottsdale, AZ, November 2011, pp.
103-112.
[16]
F. Giesen, R. Schnabel, and R. Klein, "Augmented compression for server-side
rendering," in Proc. of International Fall Workshop on Vision,
Modeling, and Visualization (VMV'08), Konstanz, Germany, October 2008.
[17]
Y. Chen, C. Chang, and W. Ma, "Asynchronous rendering," in Proc. of ACM
SIGGRAPH symposium on Interactive 3D Graphics and Games (I3D'10),
Washington, DC, February 2010.
[18]
D. Winter, P. Simoens, L. Deboosere, F. Turck, J. Moreau, B. Dhoedt, and
P. Demeester, "A hybrid thin-client protocol for multimedia streaming and
interactive gaming applications," in Proc. of ACM International
Workshop on Network and Operating Systems Support for Digital Audio and Vid
eo (NOSSDAV'06), Newport, RI, May 2006.
[19]
O. Holthe, O. Mogstad, and L. Ronningen, "Geelix LiveGames: Remote playing
of video games," in Proc. of IEEE Consumer Communications and
Networking Conference (CCNC'09), Las Vegas, NV, January 2009.
[20]
C.-Y. Huang, C.-H. Hsu, D.-Y. Chen, and K.-T. Chen, "Quantifying User Satisfaction in Mobile Cloud Games," in Proceedings of ACM MoVid
2014, 2014.
[21]
C.-Y. Huang, L.-L. Huang, Y.-H. Chi, K.-T. Chen, and C.-H. Hsu, "To Cloud or Not to Cloud: Measuring the Performance of Mobile Gaming," in
Proceedings of ACM MobiGames 2015, May 2015.
[22]
I. Ghergulescu, A.-N. Moldovan, and C. Muntean, "Energy-aware adaptive
multimedia for game-based e-learning," in IEEE International Symposium
on Broadband Multimedia Systems and Broadcasting (BMSB'14), June 2014, pp.
1-6.
[23]
H.-J. Hong, T.-Y. Fan-Chiang, C.-R. Lee, K.-T. Chen, C.-Y. Huang, and C.-H.
Hsu, "GPU Consolidation for Cloud Games: Are We There Yet??" in
Proceedings of IEEE/ACM NetGames 2014, 2014.
[24]
Y.-T. Lee and K.-T. Chen, "Is Server Consolidation Beneficial to MMORPG? A Case Study of World of Warcraft," in Proc. of IEEE CLOUD 2010,
February 2010.
[25]
T. Duong, X. Li, R. Goh, X. Tang, and W. Cai, "QoS-aware revenue-cost
optimization for latency-sensitive services in IaaS clouds," in
Proc. of IEEE/ACM 16th International Symposium on Distributed
Simulation and Real Time Applications (DS-RT'12), Dublin, Ireland, October
2012.
[26]
D. Wu, Z. Xue, and J. He, "iCloudAccess: Cost-effective streaming of video
games from the cloud with low latency," IEEE Transactions on Circuits
and Systems for Video Technology, January 2014, accepted to appear.
[27]
S. Wang and S. Dey, "Rendering adaptation to address communication and
computation constraints in cloud mobile gaming," in Proc. of IEEE
Global Telecommunications Conference (GLOBECOM'10), 2010.
[28]
W. Cai, M. Chen, and V. Leung, "Towards gaming as a service," IEEE
Transactions on Internet Computing, vol. 18, no. 3, pp. 12-18, May 2014.
[29]
S. Wang and S. Dey, "Modeling and characterizing user experience in a cloud
server based mobile gaming approach," in Proc. of IEEE Global
Telecommunications Conference (GLOBECOM'09), December 2009.
[30]
--, "Cloud mobile gaming: Modeling and measuring user experience in mobile
wireless networks," ACM Transactions on Mobile Computing and
Communications Review, vol. 16, no. 1, pp. 10-21, January 2012.
[31]
Y. Xu and S. Mao, "A survey of mobile cloud computing for rich media
applications," IEEE Transactions on Wireless Communications, vol. 20,
no. 3, pp. 46-53, June 2013.
[32]
L. Lozano, E. Garcia-Cueto, and J. Muniz, "Effect of the number of response
categories on the reliability and validity of rating scales," European
Journal of Research Methods for the Behavioral and Social Sciences, vol. 4,
no. 2, pp. 73-79, 2008.
[33]
C.-Y. Huang, C.-H. Hsu, D.-Y. Chen, and K.-T. Chen, "Quantifying User Satisfaction in Mobile Cloud Games," in Proc. of ACM Workshop on
Mobile Video Delivery (MoVid'14), March 2014, pp. 4:1-4:6.
[34]
M. Li, M. Claypool, and R. Kinicki, "Wbest: a bandwidth estimation tool for
ieee 802.11 wireless networks," in Proc. of IEEE Conference on Local
Computer Networks (LCN'08), Montreal, Canada, Oct 2008, pp. 374-381.
[35]
V. Ribeiro, R. Riedi, R. Baraniuk, J. Navratil, and L. Cottrell, "Pathchirp:
Efficient available bandwidth estimation for network paths," in Proc.
of Passive and Active Monitoring Workshop (PAM'03), vol. 4, San Diego, CA,
Apr 2003.
[36]
R. Kapoor, L. Chen, L. Lao, M. Gerla, and M. Y. Sanadidi, "Capprobe: A simple
and accurate capacity estimation technique," in Proc. of SIGCOMM'04,
Portland, OR, Aug 2004, pp. 67-78.
[37]
Y. Wang, J. Ostermann, and Y. Zhang, Video Processing and
Communications. Prentice Hall, 2001.
[38]
"IBM ILOG CPLEX optimizer,"
http://www-01.ibm.com/software/integration/optimization/cplex-optimizer/.[39]
"NetIndex real time global broadband and mobile data,"
http://www.netindex.com/.
Footnotes:
1. Packet losses and delays are considered
when estimating the effective bandwidth.2.
In our pilot tests, some subjects reported that it's hard to make decisions
in a typical score range between 1 and 5 as the differences between the video quality in
different rounds are sometimes subtle. Thus, we are suggested to increase the
range of scores such that subjects can report minor differences [32]. On the other
hand, the range cannot be too large as it is limited by psychometric properties
of humans. Therefore, we choose the maximum suggested range of
seven [32] in our questionnaires.
Sheng-Wei Chen (also known as Kuan-Ta Chen) http://www.iis.sinica.edu.tw/~swc
Last Update September 28, 2019

 (a)
(a)
 (b)
(b)
 (a)
(a)
 (b)
(b)
 (c)
(c)
 (a)
(a)
 (b)
(b)
 (c)
(c)
 (d)
(d)
 (a)
(a)
 (b)
(b)
 (a)
(a)
 (b)
(b)
 (a)
(a)
 (b)
(b)