In an e-learning system, inferring the de facto relationships between a
10-20 large number of exercises and arranging curriculums accordingly is
difficult because 1) the pairwise relationship between exercises is
multi-dimensional, such as similarity and difficulty; 2) there may be hundreds
of exercises in a curriculum, thus the number of pairwise relationship is
fairly large; and 3) the relationship between exercises is highly subjective,
i.e., depending on enormous factors of the students (exercise takers) such as
background knowledge, context, capability, and motivation for learning.
Previous approaches to tackle this challenge is either based on knowledge
engineering or analysis of exercise taking logs. However, the knowledge
engineering approach usually demands massive amount of human annotations on the
exercise content, while the log analysis approaches is subject to the bias of
exercise taking behavior; therefore, ....
To overcome the aforementioned challenges, we integrate the strengths of
knowledge engineering and log analysis approaches and propose a unified model
that can extract information from both human annotations and exercise taking
logs using regression analytics. The proposed model can be used to quantify
the similarity, difficulty, and prerequisite relationships
between any two exercise in a curriculum. As a case study, we collaborate with
Junyi Academy, a popular e-learning platform similar to Khan Academy, and infer
the pairwise relationships for 370 exercises in its mathematics curriculum. We
verify the effectiveness of the proposed model in terms of relationship
inference accuracy and show that it can predict exercise relationships as well
as experts do with much less human efforts (3% in our case) involved. We
expect the introduction of the proposed unified model can be easily generalized
to other domains as well as other e-learning platforms to help ....
personalized education
1 Introduction
Estimating relationships between items has wide range of applications in
educational data mining (EDM). For example, curriculum
arrangement [7,4,12,1]
and adaptive testing [13,15,18] are often
based on the estimations of difficulty and prerequisite relationships between
courses, knowledge components, or exercises. Furthermore, the similarity and
prerequisite relationships between exercises (sw: and problem steps) in
exercises can improve the quality of knowledge
components [21,23] and student
modeling [5,8,3,9]. In this
paper, we focus on studying the relationships between exercises (i.e., complete
question units), which can facilitate personalized education in the future.
Take curriculum arrangement for example, if a student has answered an exercise
correctly, we can suggest the student to spend less time taking its
prerequisite exercises in the following courses or tests [3].
In the meantime, it is becoming more and more difficult to manually organize
the growing number of exercises in large and dynamic e-learning websites. For
instance, Junyi Academy1, an
e-learning platform in Taiwan
similar to Khan academy2. Junyi
Academy provides over 300 interactive exercises for its mathematics cirr....;
there have been many complex prerequisite links in the knowledge tree as shown
in Figure 1, so it is very time consuming to
manually validate how appropriate the links are and whether there are better
choices for the prerequisite links of each exercise.
thus, the cir.. staff needs to consider hundreds of candidate exercises when
determining the prerequisites for a new exercise.
To manage the ..., several approaches are proposed to estimate the
relationships between exercises. The knowledge engineering approach, i.e.,
human annotations of ..., is an intuitive solution. When the number of
exercises is small, we can certainly adopt this solution to manually label
relationships between every pair of exercises [27]. However, this
approach is labor-intensive and would become infeasible as the number of
exercises beyond a few hundreds. Other researchers discover the relationships
by item response theory
(IRT) [25,7,19], by
inferencing Bayesian model of students
[5,8,21,3,9], by
factor analysis [17], by association rule
learning [12,1], by assuming a known
Q-matrix [23], or by assuming students would perform
better after they practice prerequisite or similar exercises in
advance [21,20,26]. Despite various data-driven
methods were explored, they mainly rely on the log data generated when students
practice those exercises, which limits their generalization and performances
due to the following reasons: 1) ... 2) ..
First, bias ... scientists need to develop a specific learning algorithm for
every kind of relationship, and the algorithm usually requires large amount of
data which come from many students with various proficiency levels. Such data
might not be available for a new system or for a new
exercise [27,19]. In addition, students' accuracy on
different exercises are affected by many factors including whether exercises
examine related concepts, the differences in terms of their difficulty, and
learning progression of students over time. Inferring their prerequisite
relationships might be misleading if we neglect some important factors like
time difference between answering [3]. Moreover, many e-learning
websites, such as Khan Academy and Junyi Academy, allow students to select any
exercise they want to practice or browse without actually answering them. As
pointed out in [27], the freedom of selection would make some
exercises lack of sufficient amount of responses and degrade the performances
of the data-driven approaches. The bias of answering patterns also offer
challenges to identify the difficulty and prerequisite relationships between
exercises, even if abundant student responses are available. This issue will be
further discussed in Sec. 2.3.
Figure 1: Part of the knowledge map in Junyi Academy. Each node is an interactive exercise problem, and the links between nodes represent the prerequisite structure in the knowledge tree .
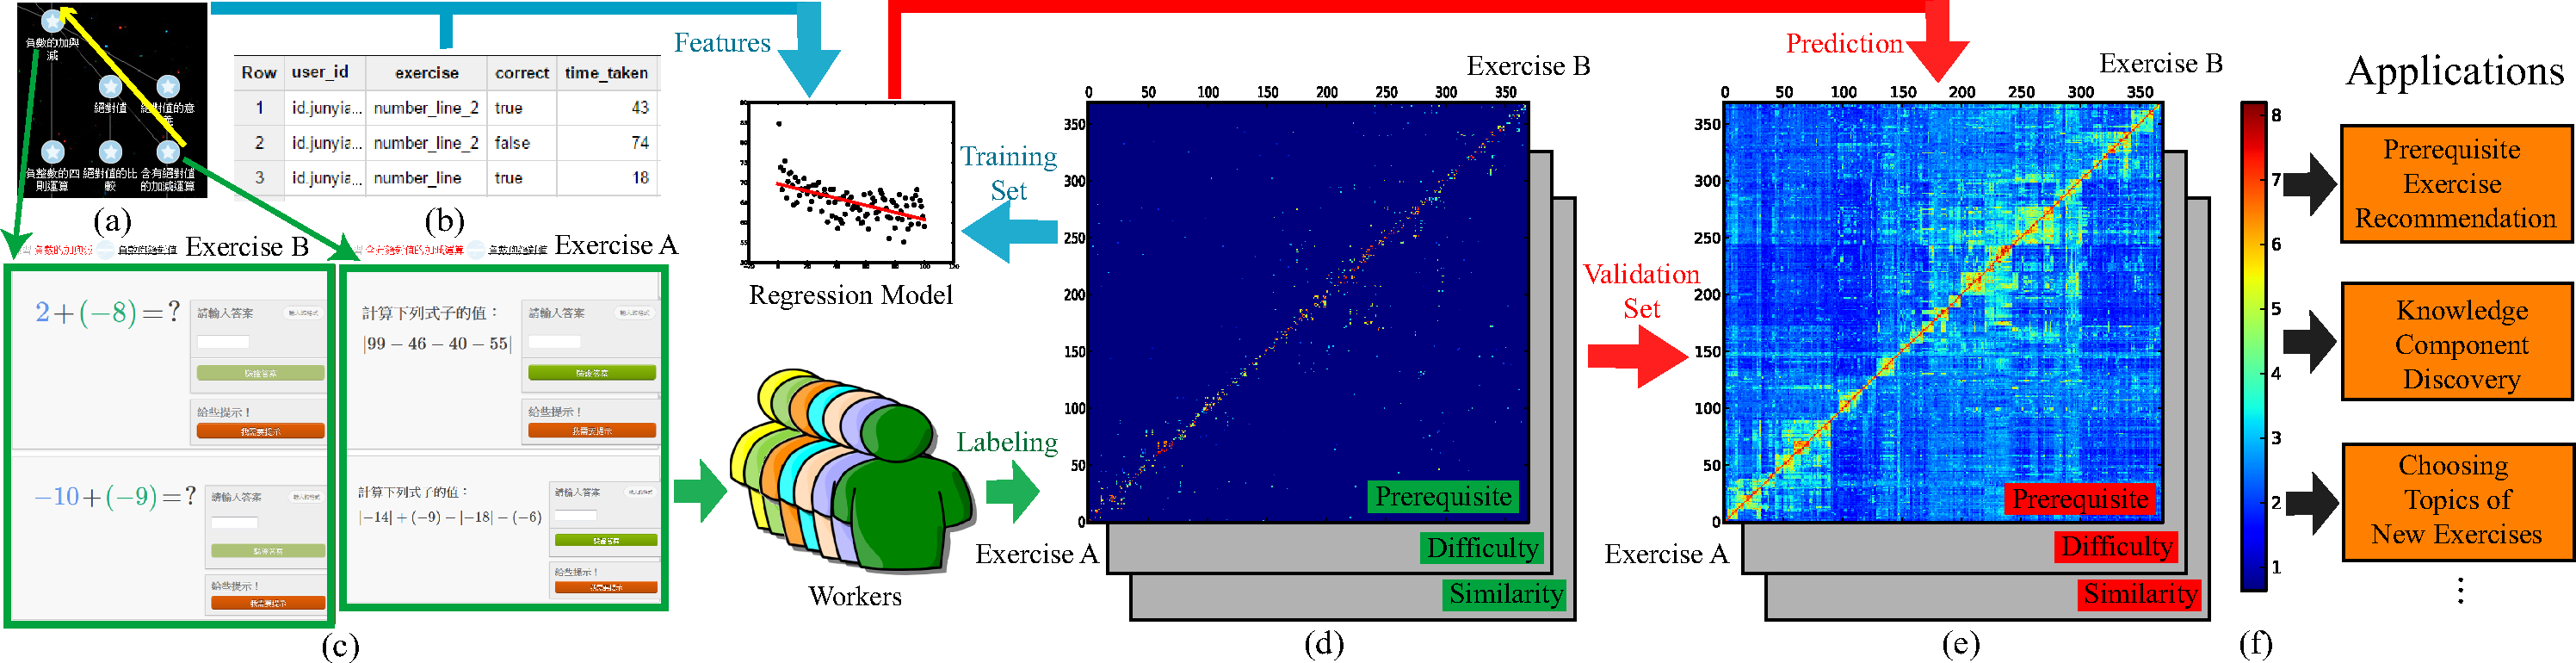
Figure 2: The proposed work flow. (a) A screen shot of the local knowledge tree, (b) examples of usage logs, (c) a example of exercise pairs, (d) the sparse similarity matrices labeled by workers, (e) the dense similarity matrices predicted by a regression model, and (f) the color code of (d) and (e). Note that higher value of element (a,b) in the prerequisite similarity matrix represents exercise b is more likely to be a prerequisite of exercise a, and the exercise ID in similarity matrices is sorted by agglomerative hierarchical clustering.
In this work, our goal is to figure out the relationships which are able to
reflect as many viewpoints of students as possible. To solve the problems
generally, efficiently, and accurately, we advocate a hybrid method which
integrates the power of crowdsourcing and machine learning
as [24] did for finding prerequisite relationships
among documents. As illustrated in Figure 2, we first
quantify the similarity, difficulty, and prerequisite relationships of exercise
pairs using crowd wisdom. That is, we recruit workers to compare some samples
of mathematical exercise pairs, and use their average opinions as our labels.
Then, we characterize each exercise pair by various types of features extracted
from the title of exercises and user practice logs. After having labels and
features, relationships of every exercise pairs can be predicted by a
regression algorithm.
Generally, performing quantitative evaluation is challenging for the data-driven approaches which focus on usage logs like [21,3]. In our case, collected labels can be used to quantitatively evaluate the prediction of machines. Interestingly, experiment shows that predictions generated by regression models are much closer to crowd consensus than most of individuals. At the end of this work, we apply the relationship information between 370 mathematical exercises on Junyi Academy to recommend prerequisite exercises, to discover knowledge components, and to choose topics of new exercises.
Our contributions in this paper are three-fold:
We propose an unified approach which efficiently quantify pairwise relationships between exercises.
For similarity, difficulty, and prerequisite relationships of exercises, our method identifies which kinds of features are important for each type of relationships.
Relationships predicted by machines are evaluated quantitatively and qualitatively in Junyi Academy.
2 Relationship Discovery
2.1 Label Collection
As we discussed above, the relationships between exercises are hard to define objectively from usage logs. Since our goal is to find relationships which most students and instructors would agree, the results would be more representative if more subjective labels with high quality could be collected. In addition, more opinions from different workers are also helpful for removing subject bias by taking the average of responses. Recently, Wauters et al. [27] demonstrated that as the number of workers increase, the average difficulty of each exercise scored by students converge to a steady value, which is highly correlated with the result inferred by IRT model [25].
For the interest of costs effectiveness, we collect labels from both online workers and people who work in the lab, and apply several quality control methods to the collection process. First, workers are tested by mathematical questions from the entrance exam of senior high school in Taiwan. After excluding the unqualified workers, the remaining workers are randomly assigned questionnaires, where the relationships of exercise pairs are compared. Next, we check their answering times and the variances of responses in each questionaires to eliminate the unserious workers. Finally, crowd consensus is adopted to detect and filter out the malicious workers as [16] did.
Pairwise comparison has shown to be an effective subjective labeling approach in video quality assessment [22]. Similarly, we first present two exercise A and B like (c) of Figure 2 at each section of questionnaires. For any target relationship between exercise pairs, a question could be designed to define the relationship. In this work, we ask the workers to choose 1 ∼ 9 score for following questions, which correspond to similarity, difficulty, and prerequisite relationships of exercise pairs, respectively.
How similar is the knowledge required for answering these two exercises?
How difficult is exercise B compared with exercises A (Scoring higher means B is more difficult than A, and scoring 5 indicate that they have the same difficulty)?
After students learn how to answer exercise B, how appropriate do instructors utilize exercise A to improve the students' understanding on the topic step by step?
For workers, it is often easier and more meaningful to compare two highly related exercises than unrelated ones, so we sample exercise pairs by the help of the knowledge tree and student modeling. As depicted in Figure 1, prerequisite relationships among exercises in the knowledge tree are visualized by a directed acyclic graph (DAG), where a parent of each node is one of its prerequisite exercise.
In our questionnaires, each exercise of interest is paired with one of its parents, children, siblings, parents of parents (such as exercise B in (a) of Figure 2), and 0 ∼ 2 randomly chosen exercises. As studied in [21,20,26], students' performances on the exercise of interest would be improved after practicing its prerequisite or similar exercises. Thus, the exercise of interest is paired with another exercise whose log data are the most useful feature for predicting students' performances in the exercise of interest (the prediction model will be further described in Sec. 2.2). If there is no exercise which fits our selection criteria (e.g., exercise A has no sibling node in the graph), we will skip the comparison. Thus, each exercise is consecutively compared with 1 ∼ 7 other exercises in a questionnaire, where the order of comparisons is randomly determined.
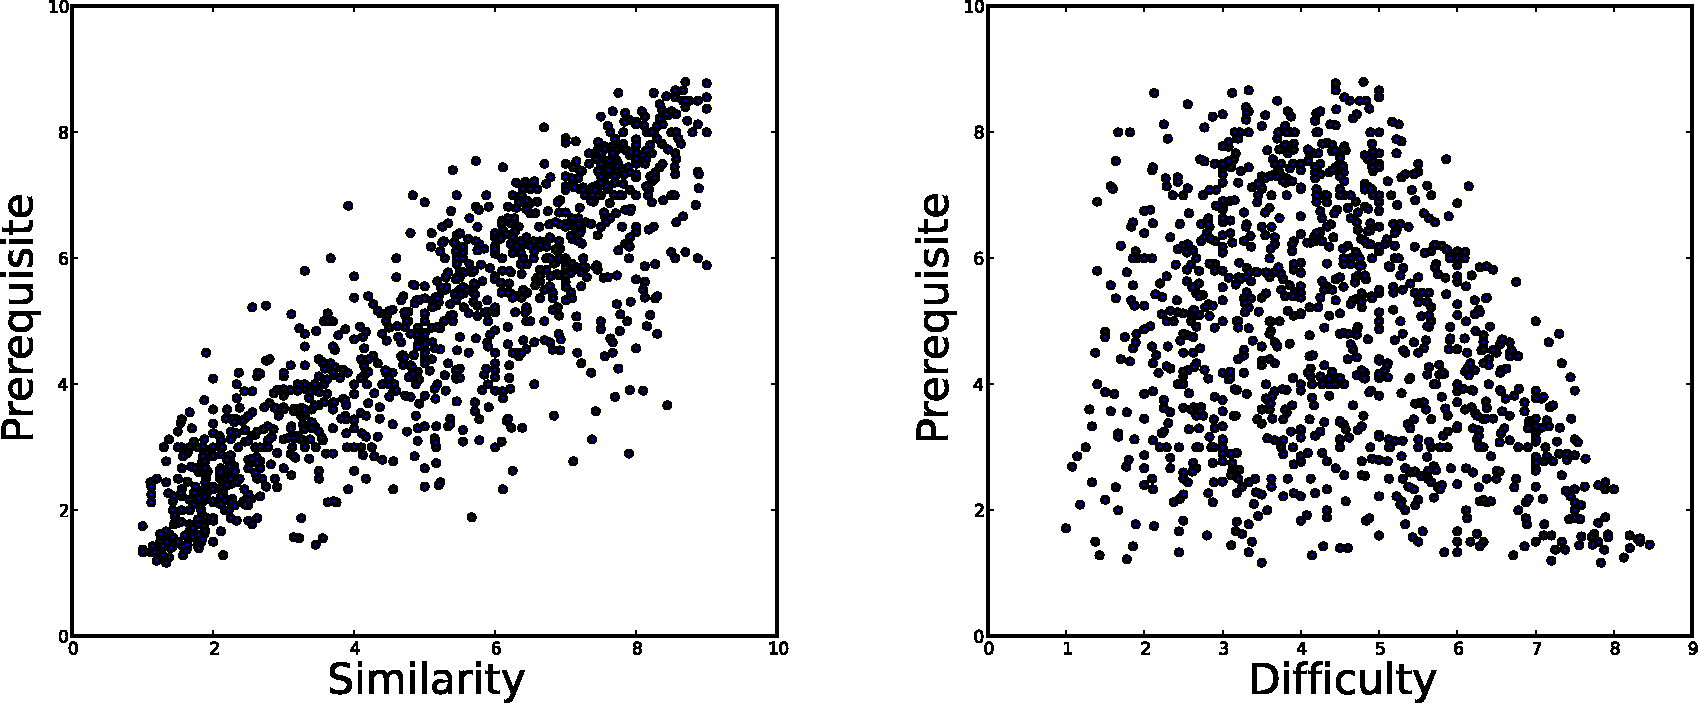
Figure 3: The scatter plot of workers' responses for the relationships of mathematical exercises on Junyi Academy. Each dot is a score rated by a worker.
It is worth mentioning that the relationships between exercises might not be independent with each other. For example, our intuition suggests that two exercises are very likely to have prerequisite relationships, if one is similar with and slightly easier than the other. As visualized in Figure 3, we can see that prerequisite and similarity relationships are highly correlated (with correlation coefficient 0.87), and a more difficult exercise in a pair is less likely to become the prerequisite of the other. If we perform principle component analysis (PCA) on the 3 dimensional relationship space, the last PCA component only explains less than 3% of data variance. These analyses verify the intuition that 2 degree of freedom in the distribution can explain most of workers' ratings.
2.2 Feature Extraction
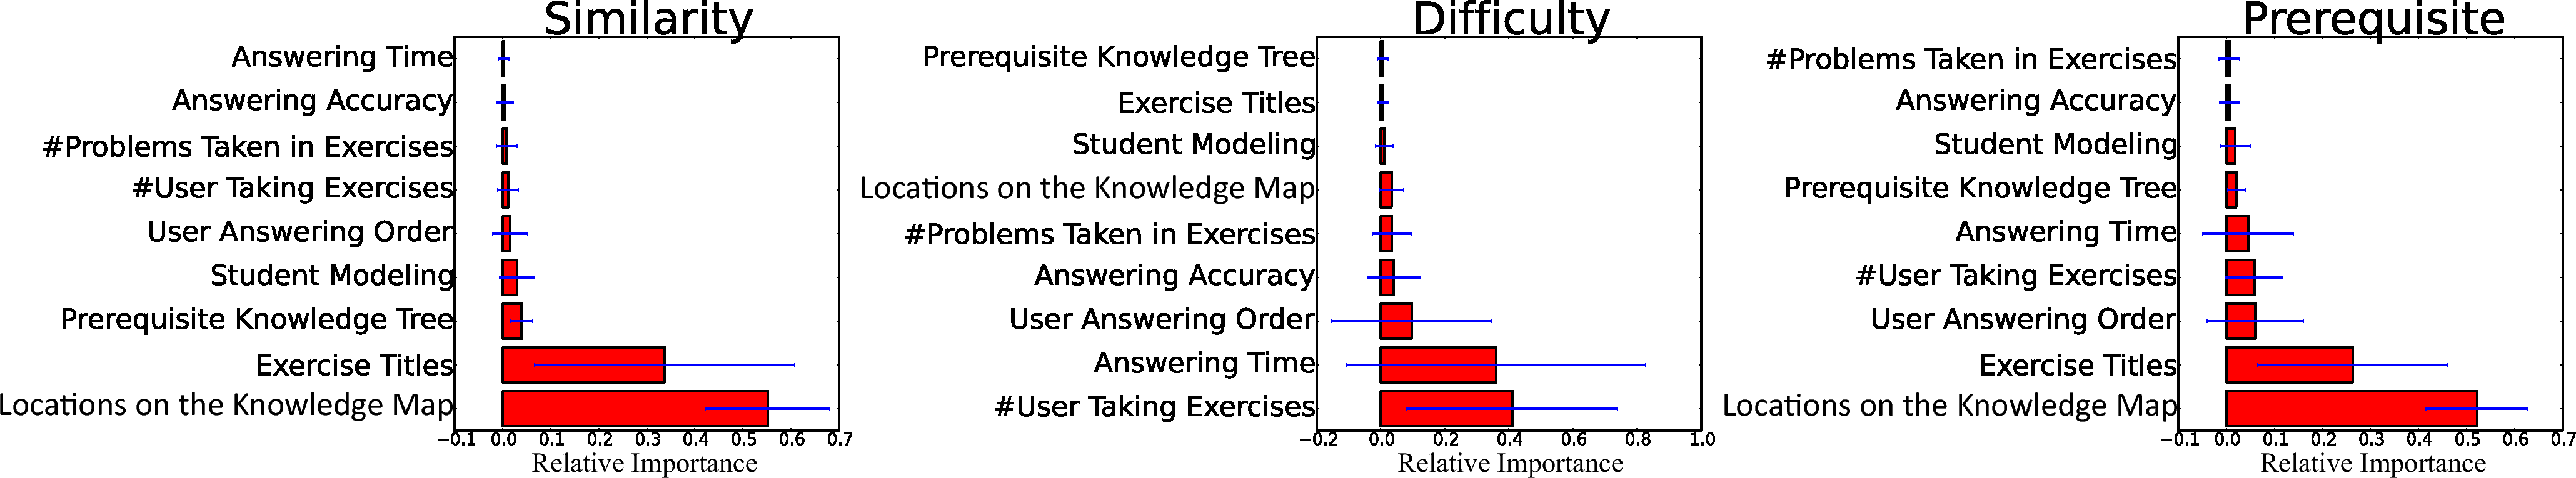
Figure 4: Feature importance identified by random forest regressor [2] for our relationships prediction task in the training dataset of Junyi Academy. The red bar of each category means the summation of all the feature importance in the category, and blue error bar is the summation of the standard deviation for each feature importance in the forest. Symbol # represents "the number of".
To automatically predict the relationships, we extract the usage logs from Oct. 2012 to July 2014 in Junyi Academy, which contains over 10 million answering records from over 100 thousand users. Based on the practice history of each student, we model the student by predicting his/her accuracy on every exercise which is not done by the student. Using students' previous records on the other exercises as features, we can formulate the student modeling task as regression/classification problem like [28] did. We suppose that similar or prerequisite exercises would play important roles in such prediction, so feature importance in the random forest regressor [2] is extracted to help us choose exercise pairs while collecting labels and to help us predict the relationships between exercise pairs.
When describing relationships between exercise A and exercise B, we extract the following features from usage log and cluster them into 6 categories: Student Modeling (4 features)
includes feature importance of log data in B for predicting students' accuracy of answering A, and the corresponding importance of A for the prediction of B. Furthermore, we normalize the values of feature important by the maximum of all importance, and use them as our additional 2 features. Answering Time (6 features) includes the difference between average answering time of A and B (i.e., (time for A) − (time for B) ), the logarithm difference of their average answering time (i.e., log(time for A) − log(time for B) ), the difference and the logarithm difference of their answering time on average of users' first answers, and on average of users' correct answers. Answering Accuracy (6 features) includes the difference and the logarithm difference between accuracy of A and B on average of users' first answers, on average of users' last answers, and on average of all answers, where accuracy is defined by [(#correct answers)/(#total answers)]. Note that # means "the number of". #Problems Taken in Exercises (4 features) includes the difference and the logarithm difference between #total problems or #correct problems taken in A and B, where the problems in the same exercise examine the same concept or skill, but they might have different numbers or forms. An example of problem's differences in the same exercises could be seen in the top and bottom row of (c) in Figure 2. #User Taking Exercises (3 features) includes the difference and the logarithm difference between #users taking A and B, and the Euclidean distance between #users distribution vectors of A and B, where each element in the distribution vector of A records the #users who have done another exercise correctly before A. User Answering Orders (6 features) include #users who practice A before B, #users who do B before A, the ratio of above two #users, #correct answers for A before answering B, the corresponding #answers for B before A, and the ratio of above two #answers.
As pointed out in [15,12,19,17], different types of tags on exercises or courses labeled by experts are useful information for determining their relationships. Therefore, we additionally extract exercise-related tags from Junyi Academy, which can be grouped into following 3 categories: Prerequisite Knowledge Tree (5 features) include whether B is a parent of A in the knowledge tree (i.e., the directed acyclic graph), whether B is a sibling of A, distance between A and B in the directed acyclic graph, in the transpose graph of the knowledge tree (generated by reversing every edge), and in the undirected graph of the knowledge tree (generated by removing the direction of every edge). Locations on the Knowledge Map (3 features) include Euclidean distance between A and B on the map, and coordinate difference between A and B on x-axis and y-axis in the knowledge map (e.g., the length and the coordinate vector of the yellow arrow in (a) of Figure 2). Exercise Titles (3 features) include edit distance between their Chinese and English titles of A and B, and summation of the minimal edit distances between English words in their titles.
2.3 Feature Importance
To know the effectiveness of our 40 dimension features, random forest regressor [2] is applied to know the importance of feature categories, which are depicted in Figure 4. In the figure, we can first observe that the feature importance of prerequisite relationships could more or less be construed as the combination of the importance of similarity and difficulty relationships, which are consistent with our observation in Figure 3.
Compared with whether the exercises are answered correctly or not, the numbers of users who actually practice exercises are much better features for predicting the difficulty difference between exercises. One of the reasons which causes the fact is the freedom of choosing exercises we mentioned in the Sec. 1. In fact, around 70% of students correctly answer each mathematical exercise on Junyi Academy at their first attempt, which shows that students tend to skip exercises they cannot answer. The behavior makes #user taking exercises important features and undermines the effectiveness of features based on answering accuracy.
For the similarity and prerequisite relationships, the original prerequisite structure in the manually maintained knowledge tree surprisedly has relatively low feature importance. Instead, the locations in the knowledge map are the strongest features for the tasks. An explanation for the observation is that instructors usually maintain close distances between similar exercises in the knowledge map, and the exercises are often good prerequisite candidates for each other. However, when they assign the prerequisite links in the knowledge tree, the graph needs to keep sparse to ensure the clarity and simplicity of its layout.
Though knowledge maps or trees might not be accessible in other interactive learning environments, Figure 4 also illustrates that the information contained in the titles of exercises is much more correlated with the prerequisite relationships in Junyi Academy than features extracted from student modeling and answering accuracy, which are the focus of many previous works such as [5,8,21,3]. Therefore, it would be interesting to investigate whether the observation is still valid in other systems which probably have different rules for naming titles or for recommending exercises to students. Additionally, another future research topic would be to design proper rules of naming or laying out exercises so as to improve the prediction of relationships.
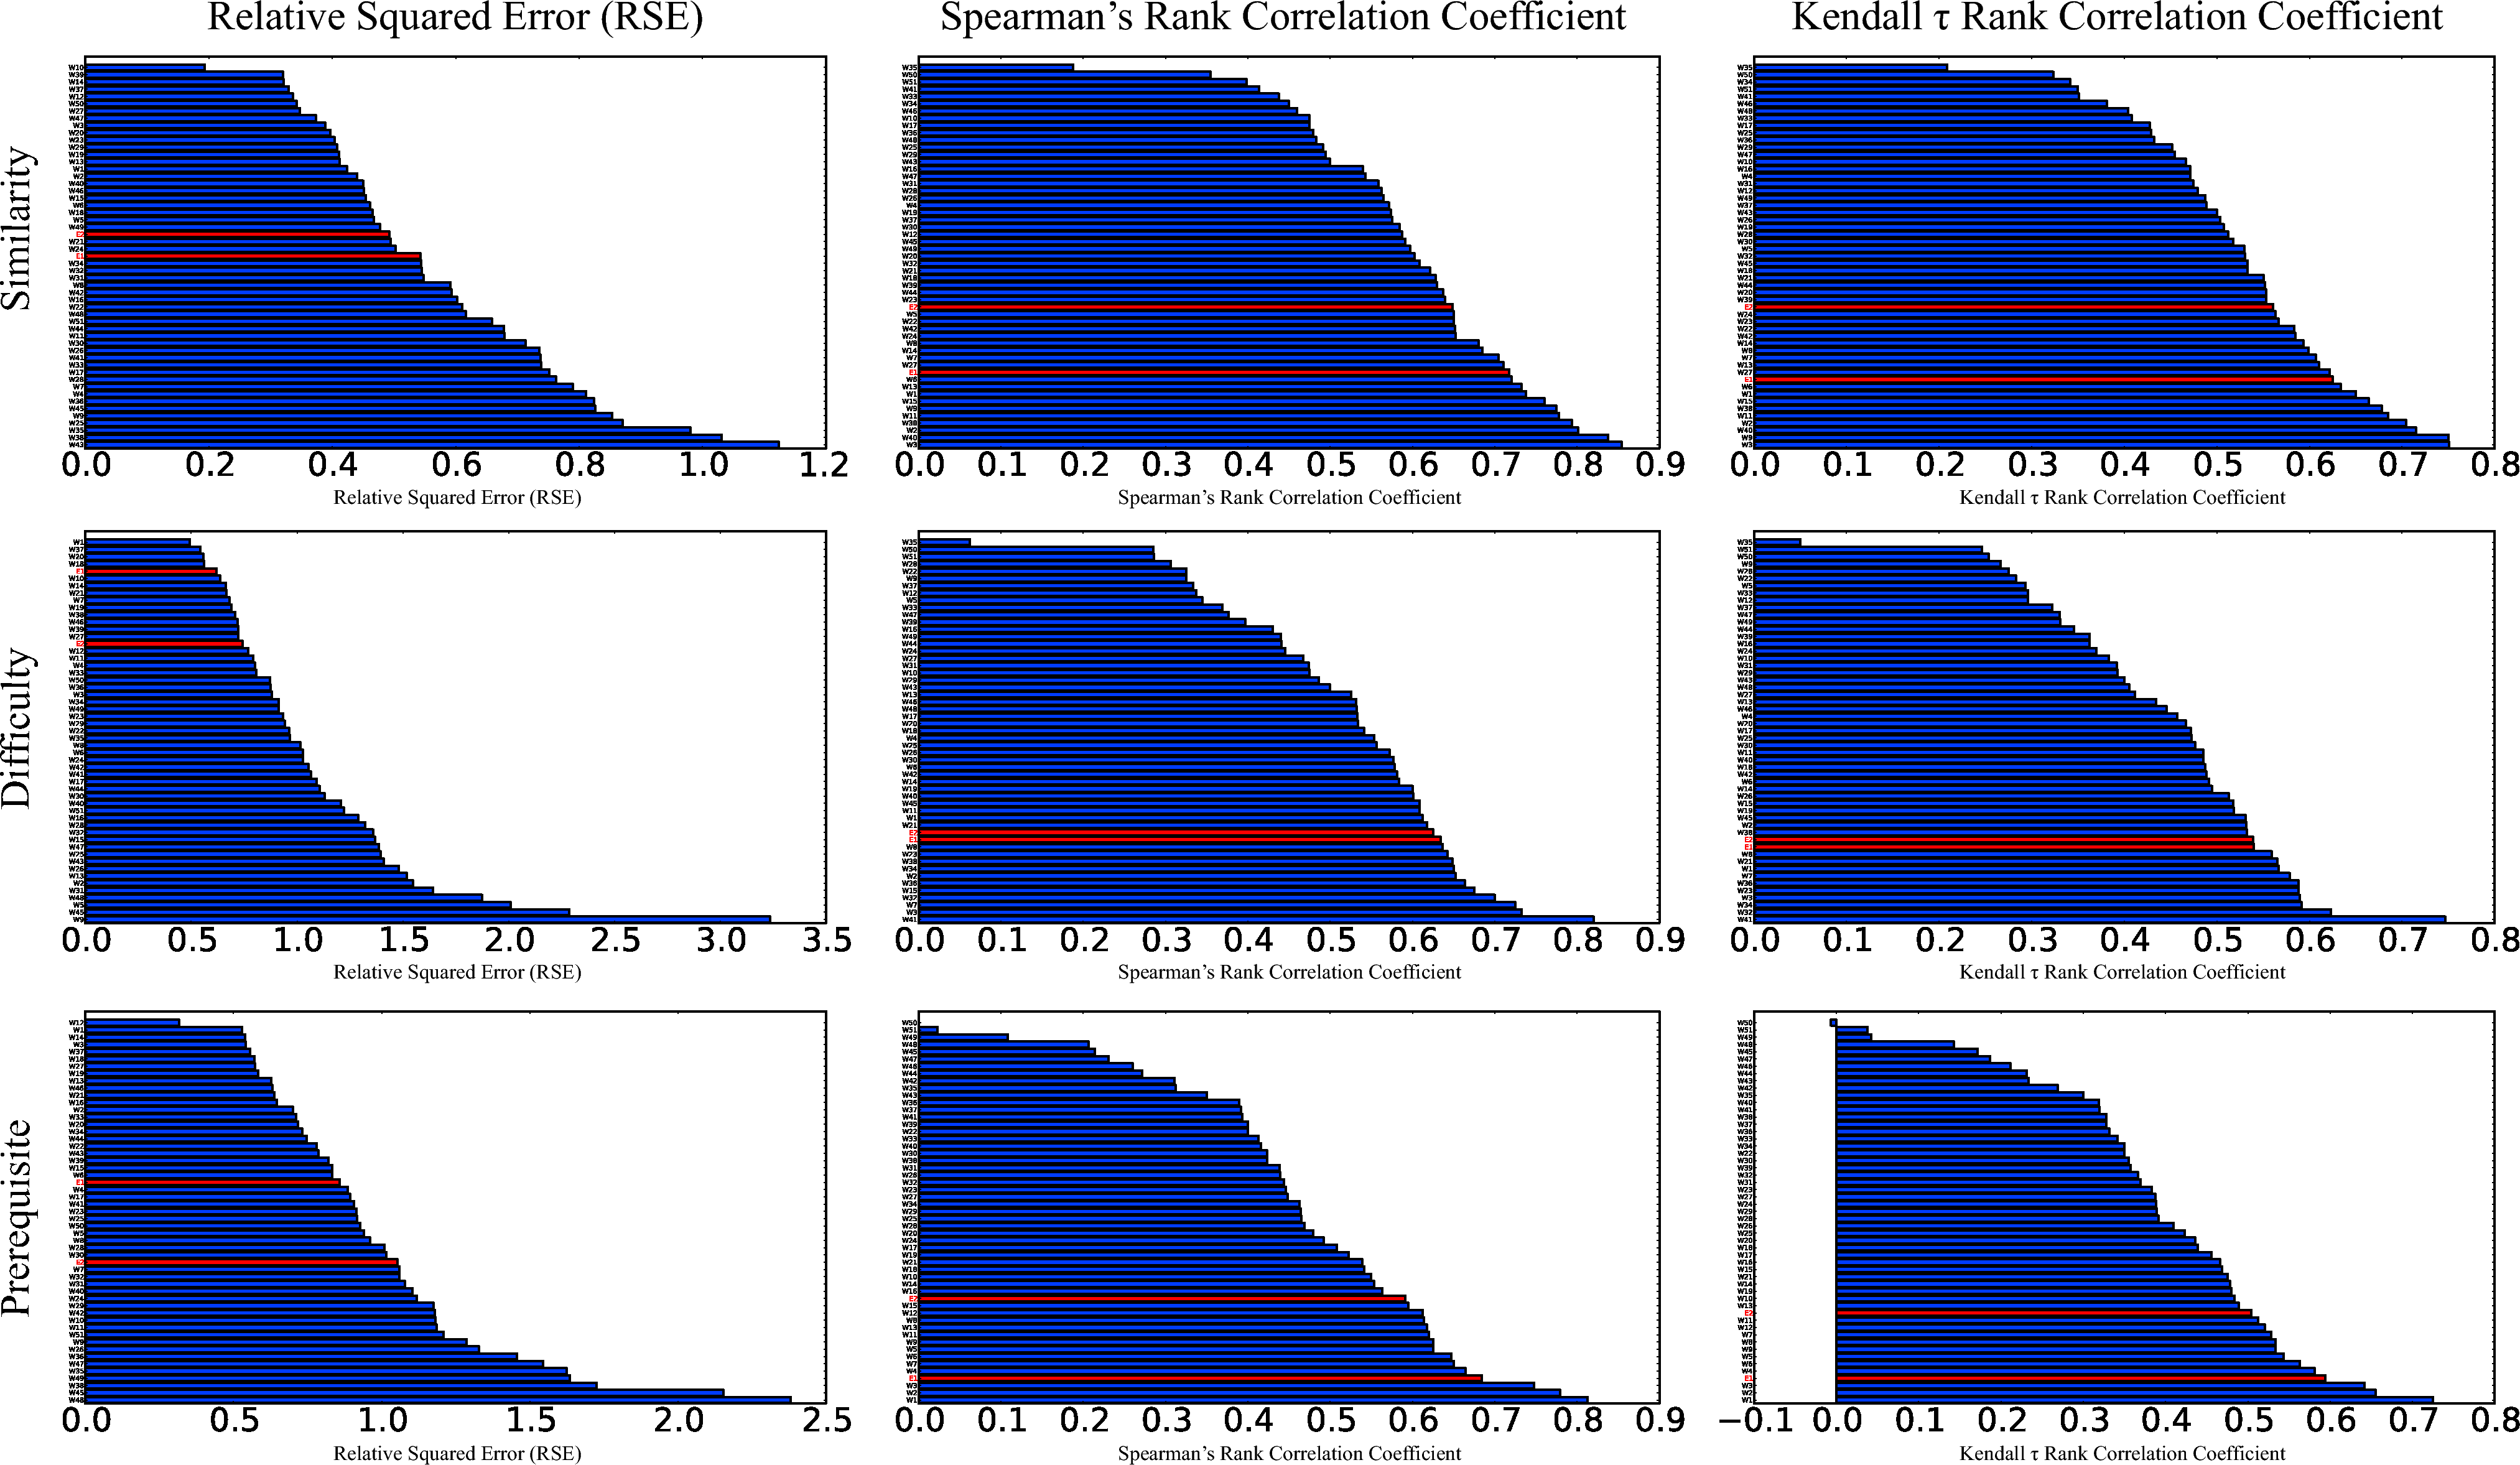
Figure 5: The distribution of worker performances on 3 metrics (on different columns) and 3 relationships (on different rows) in the training set of Junyi Academy. Smaller value is better for the relative squared error, and larger value is better for the rank coefficients. Usual workers are labeled from W1 to W51. Teachers are denoted as E1 and E2 and their performances are highlighted in red color.
2.4 Relationship Prediction
Given the features and relationship labels, we formulate the relationship prediction task as a regression analysis. In Sec. 3, we use the collected labels to experiment on the effects of using different regression algorithms. In addition, we also evaluate the regression model which only uses a subset of features described in Sec. 2.2, so that our models can predict the relationships between exercises in interactive learning environments where some corresponding features (e.g., the ones using knowledge maps) cannot be extracted.
3 Experiments
Our proposed method is evaluated in the knowledge tree of Junyi Academy. To prevent scarce usage logs skewing the statistical distribution of our features, we exclude the exercises which are answered by less than 100 users. The remaining 370 exercises of interest are randomly divided into two sets: the training set containing 240 exercises, and the testing set containing 130 exercises. On average, each exercise of interest in training set is paired with around 4.7 other exercises where around 10% of exercises are randomly selected, and each one in testing set is paired with 6.3 other exercises where the percentage of randomly selected exercises reach around 30% to verify our generalization capability.
To evaluate how good humans and machines perform, one of metrics we adopt is relative squared error (RSE), which is defined as
[(∑i(Pi−Yi)2)/(∑i(Yi−[ˉY])2)],
where Pi and Yi is our prediction and the ground truth for a relationship of exercise pair i, respectively, and [ˉY] is the mean of Yi over all i. Note that RSE is 1 for the trivial solution which assigns all the prediction as [ˉY].
In many applications, the ranks of the scores are more important than their absolute values. An example is to offer several prerequisite candidates of the exercise of interest for refining prerequisite links in the knowledge tree. Therefore, we also transform every score of exercise relationships into its rank, and compare the similarity between predicted ranks and ground truth. To be more specific, when evaluating prerequisite relationships between exercise A and the other exercises, we assign 1st rank to the exercises which are predicted most likely to be prerequisite of A, assign 2nd rank to the exercise with the second highest prerequisite score, and so on. Then, we evaluate the predicted rank by Spearman's ρ and Kendall τ rank correlation coefficients [10]. The range of both coefficients are from -1 to 1, which correspond to the reverse and the same order of ground truth, respectively. In addition, the coefficients is 0 for the trivial solution which outputs random ranks.
3.1 Performance of Workers
Table 1: Performance comparisons between different methods in training set of Junyi Academy. The regressors and features are evaluated using cross validation, and best performances among different regressors are highlighted in bold font. Note that RSE, PCR, nu-SVR, and GBR mean relative squared error, principle component regression, nu support vector regression, and gradient boosting regressor, respectively. In addition, KT, KM, ET, SM, AA, UN, PT, w/, and w/o represent the knowledge tree, the knowledge map, exercise titles, student modeling, answering accuracy, user numbers, numbers of problems taken, with, and without, respectively.
Similarity
Difficulty
Prerequisite
Methods
RSE
Spearman's ρ
Kendall's τ
RSE
Spearman's ρ
Kendall's τ
RSE
Spearman's ρ
Kendall's τ
0.193
0.188
0.208
0.492
0.063
0.050
0.316
0.000
-0.007
∼ 1.124
∼ 0.854
∼ 0.750
∼ 3.235
∼ 0.820
∼ 0.747
∼ 2.381
∼ 0.813
∼ 0.725
Mean
0.574
0.598
0.524
1.096
0.516
0.439
0.986
0.458
0.387
0.493
0.648
0.560
0.619
0.625
0.539
0.858
0.571
0.504
∼ 0.543
∼ 0.718
∼ 0.625
∼ 0.741
∼ 0.634
∼ 0.540
∼ 1.054
∼ 0.684
∼ 0.594
Mean
0.518
0.683
0.593
0.680
0.630
0.539
0.956
0.638
0.549
Linear Regression
0.370
0.658
0.567
0.470
0.593
0.504
0.424
0.624
0.541
PCR (2 components)
0.370
0.656
0.567
0.474
0.595
0.503
0.427
0.608
0.526
nu-SVR
0.349
0.683
0.594
0.483
0.611
0.526
0.402
0.611
0.520
Random Forest
0.320
0.662
0.575
0.493
0.576
0.493
0.376
0.608
0.516
GBR
0.288
0.680
0.590
0.453
0.610
0.521
0.346
0.600
0.514
GBR (w/o Rounding)
0.273
0.690
0.604
0.445
0.656
0.564
0.327
0.649
0.558
w/o KT and KM
0.311
0.681
0.589
0.474
0.626
0.532
0.378
0.607
0.515
w/o KT, KM, and ET
0.433
0.607
0.521
0.472
0.642
0.546
0.472
0.567
0.478
w/ SM, AA, UN, and PT
0.548
0.516
0.438
0.502
0.610
0.516
0.595
0.463
0.377
w/ SM and AA
0.598
0.524
0.446
0.632
0.486
0.400
0.666
0.417
0.346
w/ KT
0.674
0.463
0.418
0.869
0.448
0.382
0.717
0.360
0.318
w/ ET and UN
0.447
0.598
0.512
0.615
0.580
0.514
0.495
0.563
0.483
Table 2: Performance comparisons of different methods in the testing set of Junyi Academy. Note that the meaning of all abbreviations is the same as Table 1.
Similarity
Difficulty
Prerequisite
Methods
RSE
Spearman's ρ
Kendall's τ
RSE
Spearman's ρ
Kendall's τ
RSE
Spearman's ρ
Kendall's τ
0.220
0.798
0.707
0.362
0.773
0.679
0.271
0.727
0.625
∼ 0.342
∼ 0.871
∼ 0.798
∼ 0.665
∼ 0.797
∼ 0.701
∼ 0.714
∼ 0.810
∼ 0.734
Mean
0.269
0.845
0.762
0.484
0.785
0.688
0.421
0.758
0.666
Linear Regression
0.327
0.767
0.664
0.602
0.606
0.500
0.353
0.791
0.683
PCR (2 components)
0.316
0.769
0.667
0.599
0.597
0.487
0.367
0.786
0.675
nu-SVR
0.294
0.778
0.674
0.577
0.591
0.486
0.338
0.798
0.693
Random Forest
0.262
0.781
0.680
0.608
0.576
0.474
0.364
0.764
0.648
GBR
0.264
0.780
0.677
0.577
0.592
0.487
0.329
0.781
0.672
GBR (w/o Rounding)
0.258
0.768
0.653
0.563
0.610
0.506
0.323
0.783
0.666
After excluding malicious and unqualified workers, we hire 3 teachers, 8 online workers, and 43 people who work in the lab. All workers in the lab are at least graduated from senior high school, and most of them have a college degree. Each exercise pair in the training set are labeled 6.6 times on average by total 51 usual workers, and teachers are asked to score all the exercise pairs in the testing set. For the interest of the consistency between opinions from crowd consensus and that from experts, we also ask 2 among 3 teachers to label every pair in the training set. The total costs of collecting above labels are around 1,000 USD.
Manually quantifying the relationships between mathematic exercises is a demanding cognitive task, which requires certain level of skills in abstract reasoning. Using the average of workers' ratings as our ground truth, we first evaluate the performances of recruited workers and whether teachers (i.e., experts) perform better in the tasks. The results in the training set are presented in Figure 5 and Table 1. Note that smaller RSE and larger rank coefficient indicate better performances. From Table 1, it is clear that the performance of workers measured by RSE is significantly lower than the ones measured by rank coefficients compared with trivial solutions. This is because RSE measures the absolute differences between the prediction and ground truth, but the metric might be misleading when systematic subject bias appears (i.e., some workers tend to score every pair higher or lower than most of the people). The results illustrate that such bias is a common phenomenon in the tasks, and makes RSE less reliable to measure the performances of workers.
Quantifying different relationships also influences workers' performances. Generally speaking, usual workers perform less well in more abstract concept such as prerequisite, whereas teachers perform steadily in every relationships in terms of ranking metrics. The results also suggest that the domain knowledge is useful for the task because the teachers' ratings are closer to crowd consensus than the most of usual workers, especially when they score difficulty and prerequisite relationships.
3.2 Prediction Accuracy
For the training set, we evaluate our prediction results by 5-fold cross validation, and Table 1 compares the resulting outputs generated by different regression models and different subsets of features. The table summarizes the results of five regression algorithms including linear regression, principal component regression (PCR) [14], nu support vector regression (nu-SVR) [6], random forest regressor [2], and gradient boosting regressor (GBR) [11]. As we can see, more complex regressors such as random forest or gradient boosting algorithms have lower RSE, and simple methods such as linear regression have similar performances if rank coefficients are adopted as our metrics. To exploit the correlation structure among relationships, we discard third principle component (PC) in PCR and see its influence on the performances. From Table 1, we see that using only 2 PCs is sufficient to reach similar performances with linear regression (the same as PCR with 3 PCs), and the results imply potential time saving in future data collection and analysis.
Compared with teachers' ratings in the training set, our approach can generate competitive performances measured by rank coefficients while having lower RSE. This means that after training by opinions from workers, machines could predict relationships between exercises closer to crowd consensus than most of individuals. Note that to make the comparison fair, we round all of the scores predicted by machines into 1 ∼ 9 integers, unless the method is denoted otherwise as "GBR (w/o Rounding)". By presenting the results before rounding, we show that our method can gain more accurate predictions and generate results with higher resolution.
In Table 1, we also provide control experiments on different types of features using gradient boosting regressor. There might not be knowledge tree (KT) and knowledge map (KM) in other interactive learning environment, so we first present the performance without the types of features. The results show that removing KT and KM can still produces similar performances, but the performance on similarity and prerequisite relationships would decrease by a margin if we further remove features extracted from exercises titles (ET) and discard time-related features next (denoted as w/ SM, AA, UN, and PT in the table). Finally, the model only using exercises titles and user numbers as features (i.e., w/ ET and UN) would perform significantly better than the one which relies on the features extracted from the correctness of students' answers (i.e., w/ SM and AA), or relies on the original structure of the knowledge tree (i.e., w/ KT). The observations also are consistent with our interpretations of feature importance in Sec. 2.3.
In the cross validation, exercise pairs in training set and validation set might share the same exercise of interests. In order to see our generalization ability across different subjects, and our generalization ability on the exercise of interest without any labels (like the case of new-added exercise), we train the regression models on the training set (mostly labeled by usual workers) and evaluate their performance on testing set (labeled by teachers). As shown in Table 2, the performances of regression models are still very promising. However, the exercise pairs in the testing set are only rated by 3 teachers, so labels from each teacher would have larger impacts on ground truth, which causes higher rank coefficients. Thus, whether the regression models have comparable performance with teachers require further studies.
4 Applications
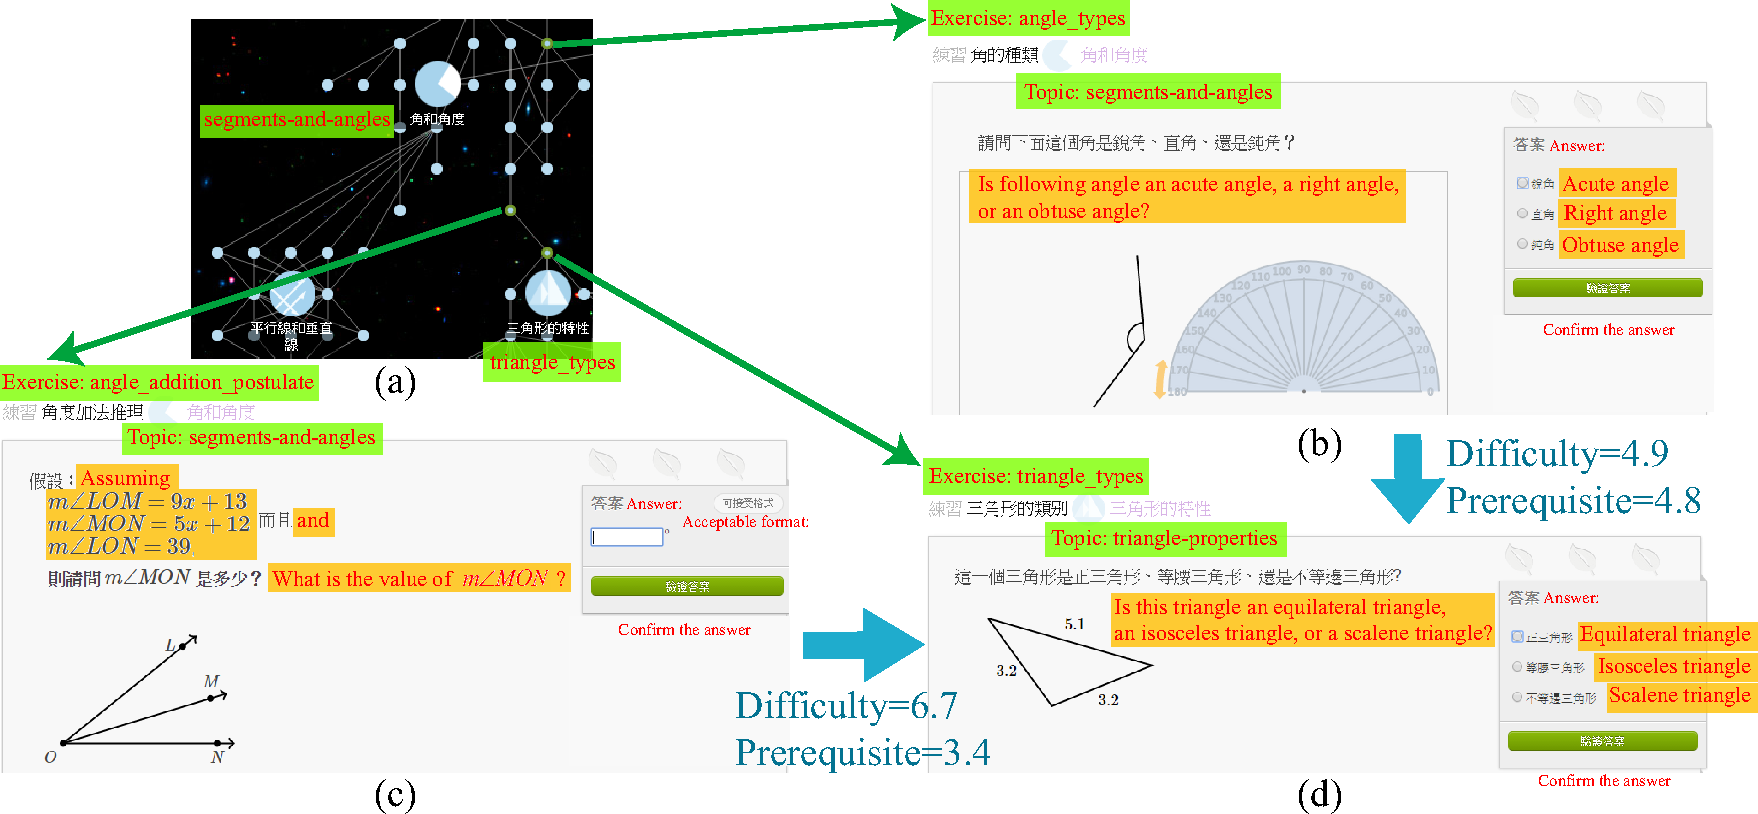
Figure 6: An example of Recommendation for Prerequisite Exercises (a) A screen shot of the local knowledge tree, (b)-(d) screen shots of exercises with title "angle_types", "angle_addition_postulate", and "triangle_types", respectively. Note that blue words indicate the relationships predicted by our model, and red words are the translation of Chinese characters beside.
As discussed in Sec. 1, many important applications such as adaptive testing can be based on relationships between exercises. In the following subsections, several simple applications of the relationships are demonstrated mainly for quantitatively evaluating our approach and the quality of our labels in the training set of Junyi Academy.
4.1 Prerequisite Exercise Recommendation
In the knowledge tree, instructors might build prerequisite link between the hardest exercise in one topic (e.g., (c) in Figure 7) to the easiest exercise in the next topic (e.g., (d) in Figure 7) to follow school curriculums. The heterogeneous ways of choosing prerequisite links violate the requirements of the prerequisite relationship we defined while collecting labels and might cause problems on its applications like adaptive testing [18]. In the case, we can suggest instructors to replace the hardest exercise in the preceding topic by the one with suitable difficulty (e.g., (b) in Figure 7).
4.2 Knowledge Component Discovery
Discovering underlying knowledge component (KC), skills, and concepts of exercises are fundamental tasks in EDM [21,17,23]. In Junyi Academy, the concepts taught by the micro-lecture videos in the website are often accompanied by some exercises in the knowledge tree, so most of the knowledge components can be represented by a cluster of exercises. Based on the similarity relationships we predicted, we can discover the knowledge components by performing graph-based clustering, whose dendrogram are presented in (b), (c) of Figure 7. By zooming in the figure, we can see that exercises related algebra and geometry are separated into two largest groups, and similar exercises are arranged near each other automatically.
Figure 7: Visualization of our similarity and difficulty relationships among 370 exercises in Junyi Academy. (a) The difficulty of each exercise, (b) the title of every exercise, and (c) the dendrogram of average linkage clustering (a type of agglomerative hierarchical clustering). More difficult exercise has longer red bar in (a), and more similar exercises are clustered sooner in (c).
4.3 Choosing Topics of New Exercises
Given the clusters in (c) of Figure 7, instructors can consider to add new exercises into small clusters, because small clusters are topics containing less exercises. Moreover, the variance of exercise difficulty might be low in some topics, so the proficiency of students within the topic cannot be discriminated. Thus, teacher can also consider to add new exercises for those topics. To estimate the difficult level of each exercise a (denoted as da), we solve the following least square optimization problem: argmind∑a ≠ b(db−da−Da,b)2, where Da,b is difficulty relationships between exercise pair (a,b) models predict previously. As a result, the difficulty levels of all exercises are illustrated in (a) of Figure 7.
5 Conclusions
Managing pairwise relationships between exercises in e-learning websites is a challenging task with wide range of applications. In this work, we demonstrate that the relationships can be quantified by subjective labeling, predicted by regression models, and utilized to improve exercising systems. In the experiment, we evaluate the performances of both workers and machines on Junyi Academy, and the results show that the relationships predicted by machines achieve competitive performances compared with experts. While exploring the similarity, difficulty, and prerequisite relationships in the knowledge tree, we observe the correlated structures between the relationships, and between features of exercise pairs and each relationship. The discovery indicates some previously unexplored features such as the title of exercises is very important for automatically determining prerequisite relationships on Junyi Academy, but the effectiveness of the features in general requires further investigation on other intelligent tutoring systems.
References
[1]
J. Bayer, H. Bydzovská, and J. Géryk.
Towards course prerequisites refinement.
IMEA, 2012.
[2]
L. Breiman.
Random forests.
Machine learning, 2001.
[3]
E. Brunskill.
Estimating prerequisite structure from noisy data.
In EDM, 2011.
[4]
E. Brunskill and S. J. Russell.
RAPID: A reachable anytime planner for imprecisely-sensed domains.
In UAI, 2010.
[5]
C. Carmona, E. Millán, J.-L. P. de-la Cruz, M. Trella, and R. Conejo.
Introducing prerequisite relations in a multi-layered bayesian
student model.
In User Modeling, 2005.
[6]
C.-C. Chang and C.-J. Lin.
LIBSVM: A library for support vector machines.
ACM Transactions on Intelligent Systems and Technology, 2011.
[7]
C.-M. Chen, C.-Y. Liu, and M.-H. Chang.
Personalized curriculum sequencing utilizing modified item response
theory for web-based instruction.
Expert Systems with applications, 2006.
[8]
M. Desmarais, P. Meshkinfam, and M. Gagnon.
Learned student models with item to item knowledge structures.
User Model. User-Adapt. Interact., 2006.
[9]
M. C. Desmarais.
Performance comparison of item-to-item skills models with the irt
single latent trait model.
In UMAP, 2011.
[10]
E. C. Fieller, H. O. Hartley, and E. S. Pearson.
Tests for rank correlation coefficients. i.
Biometrika, 1957.
[11]
J. H. Friedman.
Greedy function approximation: a gradient boosting machine.
Annals of Statistics, 2001.
[12]
T.-C. Hsieh and T.-I. Wang.
A mining-based approach on discovering courses pattern for
constructing suitable learning path.
Expert Syst. Appl., 2010.
[13]
G.-J. Hwang.
A conceptual map model for developing intelligent tutoring systems.
Computers & Education, 2003.
[14]
I. T. Jolliffe.
A note on the use of principal components in regression.
Applied Statistics, 1982.
[15]
C. Koutsojannis, G. Beligiannis, I. Hatzilygeroudis, and C. Papavlasopoulos.
Using a hybrid ai approach for exercise difficulty level adaptation.
International Journal of Continuing Engineering Education and
Life Long Learning, 2007.
[16]
B. Lakshminarayanan and Y. W. Teh.
Inferring ground truth from multi-annotator ordinal data: a
probabilistic approach.
CoRR, 2013.
[17]
A. S. Lan, C. Studer, A. E. Waters, and R. G. Baraniuk.
Tag-aware ordinal sparse factor analysis for learning and content
analytics.
In EDM, 2013.
[18]
D. Lynch and C. P. Howlin.
Real world usage of an adaptive testing algorithm to uncover latent
knowledge.
In ICERI, 2014.
[19]
M. L. Nguyen, S. C. Hui, and A. C. M. Fong.
Content-based collaborative filtering for question difficulty
calibration.
In PRICAI, 2012.
[20]
Z. A. Pardos and N. T. Heffernan.
Determining the significance of item order in randomized problem
sets.
In EDM, 2009.
[21]
P. I. Pavlik, H. Cen, L. Wu, and K. R. Koedinger.
Using item-type performance covariance to improve the skill model of
an existing tutor.
In EDM, 2008.
[22]
M. H. Pinson and S. Wolf.
Comparing subjective video quality testing methodologies.
In Visual Communications and Image Processing, 2003.
[23]
R. Scheines, E. Silver, and I. Goldin.
Discovering prerequisite relationships among knowledge components.
In EDM, 2014.
[24]
P. P. Talukdar and W. W. Cohen.
Crowdsourced comprehension: predicting prerequisite structure in
wikipedia.
In Proceedings of the Seventh Workshop on Building Educational
Applications Using NLP, 2012.
[25]
W. J. van der Linden and R. K. Hambleton.
Handbook of modern item response theory.
New York, 1997.
[26]
A. Vuong, T. Nixon, and B. Towle.
A method for finding prerequisites within a curriculum.
In EDM, 2011.
[27]
K. Wauters, P. Desmet, and W. van den Noortgate.
Acquiring item difficulty estimates: a collaborative effort of data
and judgment.
In EDM, 2011.
[28]
H.-F. Yu et al.
Feature engineering and classifier ensemble for kdd cup 2010.
In In JMLR Workshop and Conference Proceedings, 2011.