This work was supported in part by the National Science Council under the grants NSC101-2221-E-001-012-MY3 and NSC101-2221-E-002-190-MY3.
[1]
O. Alonso, D. E. Rose, and B. Stewart, "Crowdsourcing for relevance
evaluation,"
ACM SIGIR Forum, vol. 42, no. 2, pp. 9-15, 2008.
[2]
A. Basso and S. Sicco, "Preventing massive automated access to web
resources,"
Computers and Security, vol. 28, no. 3, pp. 174-188,
2009.
[3]
M. H. Birnbaum,
Psychological Experiments on the Internet. Academic Press, 2000.
[4]
J. M. Bland and D. G. Altman, "Statistical methods for assessing agreement
between two methods of clinical measurement,"
The Lancet, vol. 327,
no. 8476, pp. 307-310, 1986.
[5]
D. C. Brabham, "Crowdsourcing as a model for problem solving: An introduction
and cases,"
Convergence: The International Journal of Research into
New Media Technologies, vol. 14, no. 1, pp. 75-90, 2008.
[6]
R. A. Bradley and M. E. Terry, "Rank analysis of incomplete block designs: I.
The method of paired comparisons,"
Biometrika, vol. 39, no. 3/4,
pp. 324-345, 1952.
[7]
S. Buchholz and J. Latorre, "Crowdsourcing preference tests, and how to detect
cheating," in
Proceedings of Interspeech 2011, August 2011, pp.
3053-3056.
[8]
B. Carnero and A. Drygajlo, "Perceptual speech coding and enhancement using
frame-synchronized fast wavelet packet transform algorithms,"
IEEE
Transactions on Signal Processing, vol. 47, no. 6, pp. 1622-1635, 1999.
[9]
Y.-C. Chang, K.-T. Chen, C.-C. Wu, C.-J. Ho, and C.-L. Lei, "
Online Game QoE Evaluation using Paired Comparisons," in
Proceedings of IEEE CQR
2010, June 2010, pp. 1-6.
[10]
K.-T. Chen, C.-Y. Huang, P. Huang, and C.-L. Lei, "
Quantifying Skype User Satisfaction," in
Proceedings of ACM SIGCOMM 2006, Pisa, Italy, Sep
2006.
[11]
K.-T. Chen, J.-W. Jiang, P. Huang, H.-H. Chu, C.-L. Lei, and W.-C. Chen,
"
Identifying MMORPG Bots: A Traffic Analysis Approach,"
EURASIP
Journal on Advances in Signal Processing, vol. 2009, 2009.
[12]
K.-T. Chen, C. C. Tu, and W.-C. Xiao, "
OneClick: A Framework for Measuring Network Quality of Experience," in
Proceedings of IEEE INFOCOM 2009,
April 2009.
[13]
K.-T. Chen, C.-C. Wu, Y.-C. Chang, and C.-L. Lei, "
A Crowdsourceable QoE Evaluation Framework for Multimedia Content," in
Proceedings of ACM
Multimedia 2009, 2009.
[14]
--, "
Quantifying QoS Requirements of Network Services: A Cheat-Proof Framework," in
Proceedings of the second annual ACM Conference on
Multimedia systems, February 2011, pp. 81-92.
[15]
S. Choisel and F. Wickelmaier, "Evaluation of multichannel reproduced sound:
Scaling auditory attributes underlying listener preference,"
The
Journal of the Acoustical Society of America, vol. 121, no. 1, pp. 388-400,
2007.
[16]
F. M. Ciaramello and S. S. Hemami, "Quality versus intelligibility: Studying
human preferences for American sign language video," in
Proceedings
of SPIE Vol. 7865, Human Vision and Electronic Imaging XVI, January 2011.
[17]
H. A. David,
The Method of Paired Comparisons, 1988.
[18]
L. Ding and R. Goubran, "Speech quality prediction in VoIP using the
extended E-Model," in
Proceedings of the IEEE Global
Telecommunications Conference (GLOBECOM 2003), December 2003, pp.
3974-3978.
[19]
R. Dittrich, R. Hatzinger, and W. Katzenbeisser, "Modelling the effect of
subject-specific covariates in paired comparison studies with an application
to university rankings,"
Journal of the Royal Statistical Society
(Series C): Applied Statistics, vol. 47, no. 4, pp. 511-525, 1998.
[20]
A. Doan, R. Ramakrishnan, and A. Y. Halevy, "Crowdsourcing systems on the
World-Wide Web,"
Communications of the ACM, vol. 54, no. 4, pp.
86-96, April 2011.
[21]
A. Eichhorn, P. Ni, and R. Eg, "Randomised pair comparison: An economic and
robust method for audiovisual quality assessment," in
Proceedings of
International Workshop on Network and Operating Systems Support for Digital
Audio and Video, June 2010, pp. 63-68.
[22]
E. O. Elliott, "Estimates of error rates for codes on burst-noise channels,"
Bell System Technical Journal, vol. 42, no. 5, pp. 1977-1997, 1963.
[23]
ETSI TR 102 643, "Quality of experience (QoE) requirements for real-time
communication services," 2010.
[24]
E. N. Gilbert, "Capacity of a burst-noise channel,"
Bell System
Technical Journal, vol. 39, no. 5, pp. 1253-1265, 1960.
[25]
B. Girod, "The information theoretical significance of spatial and temporal
masking in video signals," in
Proceedings of SPIE Vol. 1077, Human
Vision, Visual Processing, and Digital Displays, 1989, pp. 178-187.
[26]
R. J. Hill, "A note on inconsistency in paired comparison judgments,"
American Sociological Review, vol. 18, no. 5, pp. 564-566, 1953.
[27]
C.-J. Ho, T.-H. Chang, and J. Y.-J. Hsu, "Photoslap: A multi-player online
game for semantic annotation," in
Proceedings of the 22nd Conference
on Artificial Intelligence, July 2007, pp. 1359-1364.
[28]
C.-J. Ho and K.-T. Chen, "
On formal models for social verification," in
Proceedings of Human Computation Workshop 2009 (affiliated to ACM KDD
2009), June 2009, pp. 62-69.
[29]
J. J. Horton and L. B. Chilton, "The labor economics of paid crowdsourcing,"
in
Proceedings of ACM Conference on Electronic Commerce, June 2010,
pp. 209-218.
[30]
T. Hossfeld, M. Seufert, M. Hirth, T. Zinner, P. Tran-Gia, and R. Schatz,
"Quantification of YouTube QoE via crowdsourcing," in
Proceedings
of the 2011 IEEE International Symposium on Multimedia, 2011, pp. 494-499.
[31]
J. Howe, "The rise of crowdsourcing,"
Wired Magazine, vol. 14, no. 6,
pp. 176-183, 2006.
[32]
Z. Huang, A. Arefin, P. Agarwal, K. Nahrstedt, and W. Wu, "Towards the
understanding of human perceptual quality in tele-immersive shared
activity," in
Proceedings of the ACM Multimedia Systems Conference,
February 2012, pp. 29-34.
[33]
Y. Ito and S. Tasaka, "Quantitative assessment of user-level QoS and its
mapping,"
IEEE Transactions on Multimedia, vol. 7, no. 3, pp.
572-584, 2005.
[34]
ITU-R Recommendation P.800, "Methods for subjective determination of
transmission quality," 1996.
[35]
ITU-T Recommendation G.107, "The E-model, a computational model for use in
transmission planning," 2005.
[36]
ITU-T Recommendation J.247, "Objective perceptual multimedia video quality
measurement in the presence of a full reference," 2008.
[37]
ITU-T Recommendation P.862, "Perceptual evaluation of speech quality
(PESQ), an objective method for end-to-end speech quality assessment of
narrow-band telephone networks and speech codecs," 2001.
[38]
ITU-T Recommendation P.910, "Subjective video quality assessment methods for
multimedia applications," 2008.
[39]
R. Jain, "Quality of experience,"
IEEE Multimedia, vol. 11, no. 1, pp.
96-97, 2004.
[40]
S. Jain, Y. Chen, and D. C. Parkes, "Designing incentives for online question
and answers forums," in
Proceedings of ACM Conference on Electronic
Commerce, July 2009, pp. 129-138.
[41]
M. G. Kendall and B. B. Smith, "The problem of m rankings,"
The Annals
of Mathematical Statistics, vol. 10, no. 3, pp. 275-287, 1939.
[42]
--, "On the method of paired comparisons,"
Biometrika, vol. 31,
no. 3/4, pp. 324-345, 1940.
[43]
A. Kittur, E. H. Chi, and B. Suh, "Crowdsourcing user studies with
Mechanical Turk," in
Proceedings of ACM CHI 2008, April 2008, pp.
453-456.
[44]
C. L. Knott and M. S. James, "An alternate approach to developing a total
celebrity endorser rating model using the analytic hierarchy process,"
International Transactions in Operational Research, vol. 11, no. 1,
pp. 87-95, 2004.
[45]
K.-C. Lan and T.-H. Wu, "Evaluating the perceived quality of
infrastructure-less VoIP," in
Prceedings of IEEE Workshop on
Streaming and Media Communications, July 2011.
C. T. Lee, E. M. Rodrigues, G. Kazai, N. Milic-Frayling, and A. Ignjatovic,
"Model for voter scoring and best answer selection in community Q&A
services," in
Proceedings of IEEE/WIC/ACM International Joint
Conferences on Web Intelligence and Intelligent Agent Technologies,
September 2009, pp. 116-123.
[47]
J.-S. Lee, L. Goldmann, and T. Ebrahimi, "A new analysis method for paired
comparison and its application to 3D quality assessment," in
Proceedings of ACM Multimedia 2011, 2011, pp. 1281-1284.
[48]
J.-S. Lee, F. D. Simone, and T. Ebrahimi, "Subjective quality evaluation via
paired comparison: Application to scalable video coding,"
IEEE
Transactions on Multimedia, vol. 13, no. 5, pp. 882-893, 2011.
[49]
Y.-T. Lee, K.-T. Chen, H.-I. Su, and C.-L. Lei, "
Are All Games Equally Cloud-Gaming-Friendly? An Electromyographic Approach," in
Proceedings of IEEE/ACM NetGames 2012, October 2012.
[50]
R. D. Luce,
Individual Choice Behavior: A Theoretical Analysis, 1959.
[51]
T. Manjunath, "Limitations of perceptual evaluation of speech quality on
VoIP systems," in
Proceedings of the IEEE International Symposium on
Broadband Multimedia Systems and Broadcasting, May 2009, pp. 1-6.
[52]
J. N. S. Matthews and K. P. Morris, "An application of Bradley-Terry-type
models to the measurement of pain,"
Journal of the Royal Statistical
Society (Series C): Applied Statistics, vol. 44, no. 2, pp. 243-255, 1995.
[53]
R. R. Pastrana-Vidal, J. C. Gicquel, C. Colomes, and H. Cherifi, "Temporal
masking effect on dropped frames at video scene cuts," in
Proceedings
of SPIE Vol. 5292, Human Vision and Electronic Imaging IX, 2004, pp.
194-201.
[54]
G. L. Peterson and T. C. Brown, "Economic valuation by the method of paired
comparison, with emphasis on evaluation of the transitivity axiom,"
Land Economics, vol. 74, no. 2, pp. 240-261, 1998.
[55]
N. L. Powers and R. M. Pangborn, "Paired comparison and time-intensity
measurements of the sensory properties of beverages and gelatins containing
sucrose or synthetic sweeteners,"
Journal of Food Science, vol. 43,
no. 1, pp. 41-46, 1978.
[56]
G. Qiu, Y. Mei, and J. Duan, "Evaluating HDR photos using Web 2.0
technology," in
Proceedings of SPIE Vol. 7867, Image Quality and
System Performance VIII, 2011.
[57]
D. G. Rand, A. Dreber, T. Ellingsen, D. Fudenberg, and M. A. Nowak, "Positive
interactions promote public cooperation,"
Science, vol. 325, no.
5945, pp. 1272-1275, 2009.
[58]
P. V. Rao and L. L. Kupper, "Ties in paired-comparison experiments: A
generalization of the Bradley-Terry model,"
Journal of the American
Statistical Association, vol. 62, no. 317, pp. 194-204, 1967.
[59]
F. Ribeiro, D. Florencio, and V. Nascimento, "Crowdsourcing subjective image
quality evaluation," in
Proceedings of IEEE International Conference
on Image Processing, September 2011, pp. 3097-3100.
[60]
F. Ribeiro, D. Florencio, C. Zhang, and M. Seltzer, "crowdMOS: An approach
for crowdsourcing mean opinion score studies," in
Proceedings of IEEE
International Conference on Acoustics, Speech and Signal Processing, May
2011, pp. 2416-2419.
[61]
P. E. Rossi, Z. Gilula, and G. M. Allenby, "Overcoming scale usage
heterogeneity: A Bayesian hierarchical approach,"
Journal of the
American Statistical Association, vol. 96, no. 453, pp. 20-31, 2001.
[62]
T. L. Saaty, "A scaling method for priorities in hierarchical structures,"
Journal of Mathematical Psychology, vol. 15, no. 3, pp. 234-281,
1977.
[63]
P. E. Shrout and J. L. Fleiss, "Intraclass correlations: Uses in assessing
rater reliability,"
Psychological Bulletin, vol. 86, no. 2, pp.
420-428, 1979.
[64]
A. Sorokin and D. Forsyth, "Utility data annotation with Amazon Mechanical
Turk," in
Proceedings of IEEE Conference on Computer Vision and
Pattern Recognition Workshops, June 2008, pp. 1-8.
[65]
I. Sprow, Z. Baranczuk, T. Stamm, and P. Zolliker, "Web-based psychometric
evaluation of image quality," in
Proceedings of SPIE Vol. 7242, Image
Quality and System Performance VI, 2009.
[66]
L. Sun and E. C. Ifeachor, "Voice quality prediction models and their
application in VoIP networks,"
IEEE Transactions on Multimedia,
vol. 8, no. 4, pp. 809-820, 2006.
[67]
P. Suppes, D. H. Krantz, R. D. Luce, and A. Tversky,
Foundations of
measurement, Volume II: Geometrical, Threshold, and Probabilistic
Representations, December 2006.
[68]
S. Tasaka, H. Yoshimi, A. Hirashima, and T. Nunome, "The effectiveness of a
QoE-based video output scheme for audio-video IP transmission," in
Proceeding of ACM Multimedia 2008, 2008, pp. 259-268.
[69]
A. Watson and M. A. Sasse, "Measuring perceived quality of speech and video in
multimedia conferencing applications," in
Proceedings of ACM
Multimedia 1998, 1998, pp. 55-60.
[70]
P. Welinder and P. Perona, "Online crowdsourcing: Rating annotators and
obtaining cost-effective labels," in
Proceedings of IEEE Conference on
Computer Vision and Pattern Recognition Workshops, June 2010, pp. 25-32.
[71]
W. Wu, A. Arefin, G. Kurillo, P. Agarwal, K. Nahrstedt, and R. Bajcsy, "A
psychophysical approach for real-time 3D video processing," in
Proceedings of ACM Multimedia 2011, November 2011, pp. 683-686.
[72]
Q. Xu, Q. Huang, T. Jiang, B. Yan, W. Lin, and Y. Yao, "HodgeRank on random
graphs for subjective video quality assessment,"
IEEE Transactions on
Multimedia, vol. 14, no. 3, pp. 844-857, June 2012.
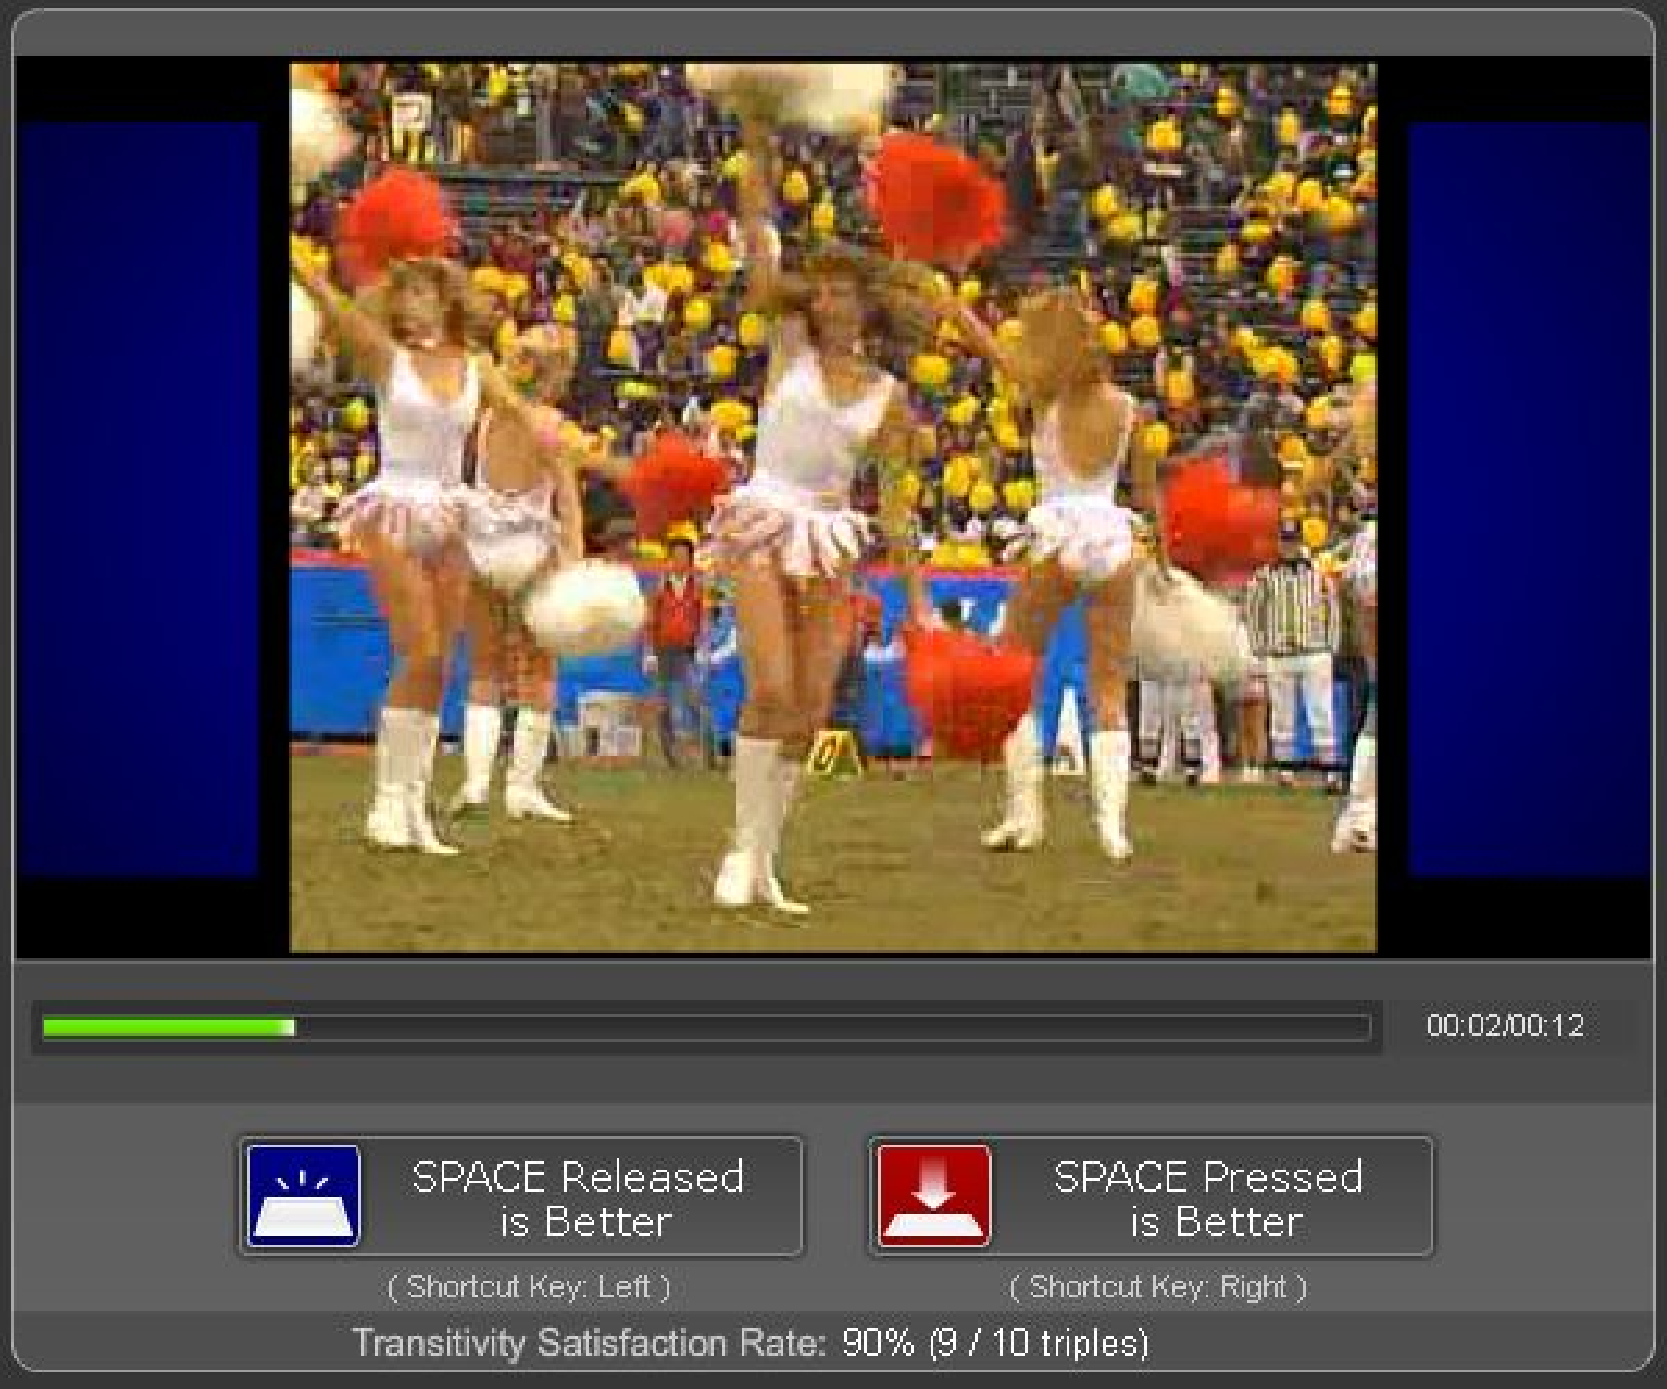
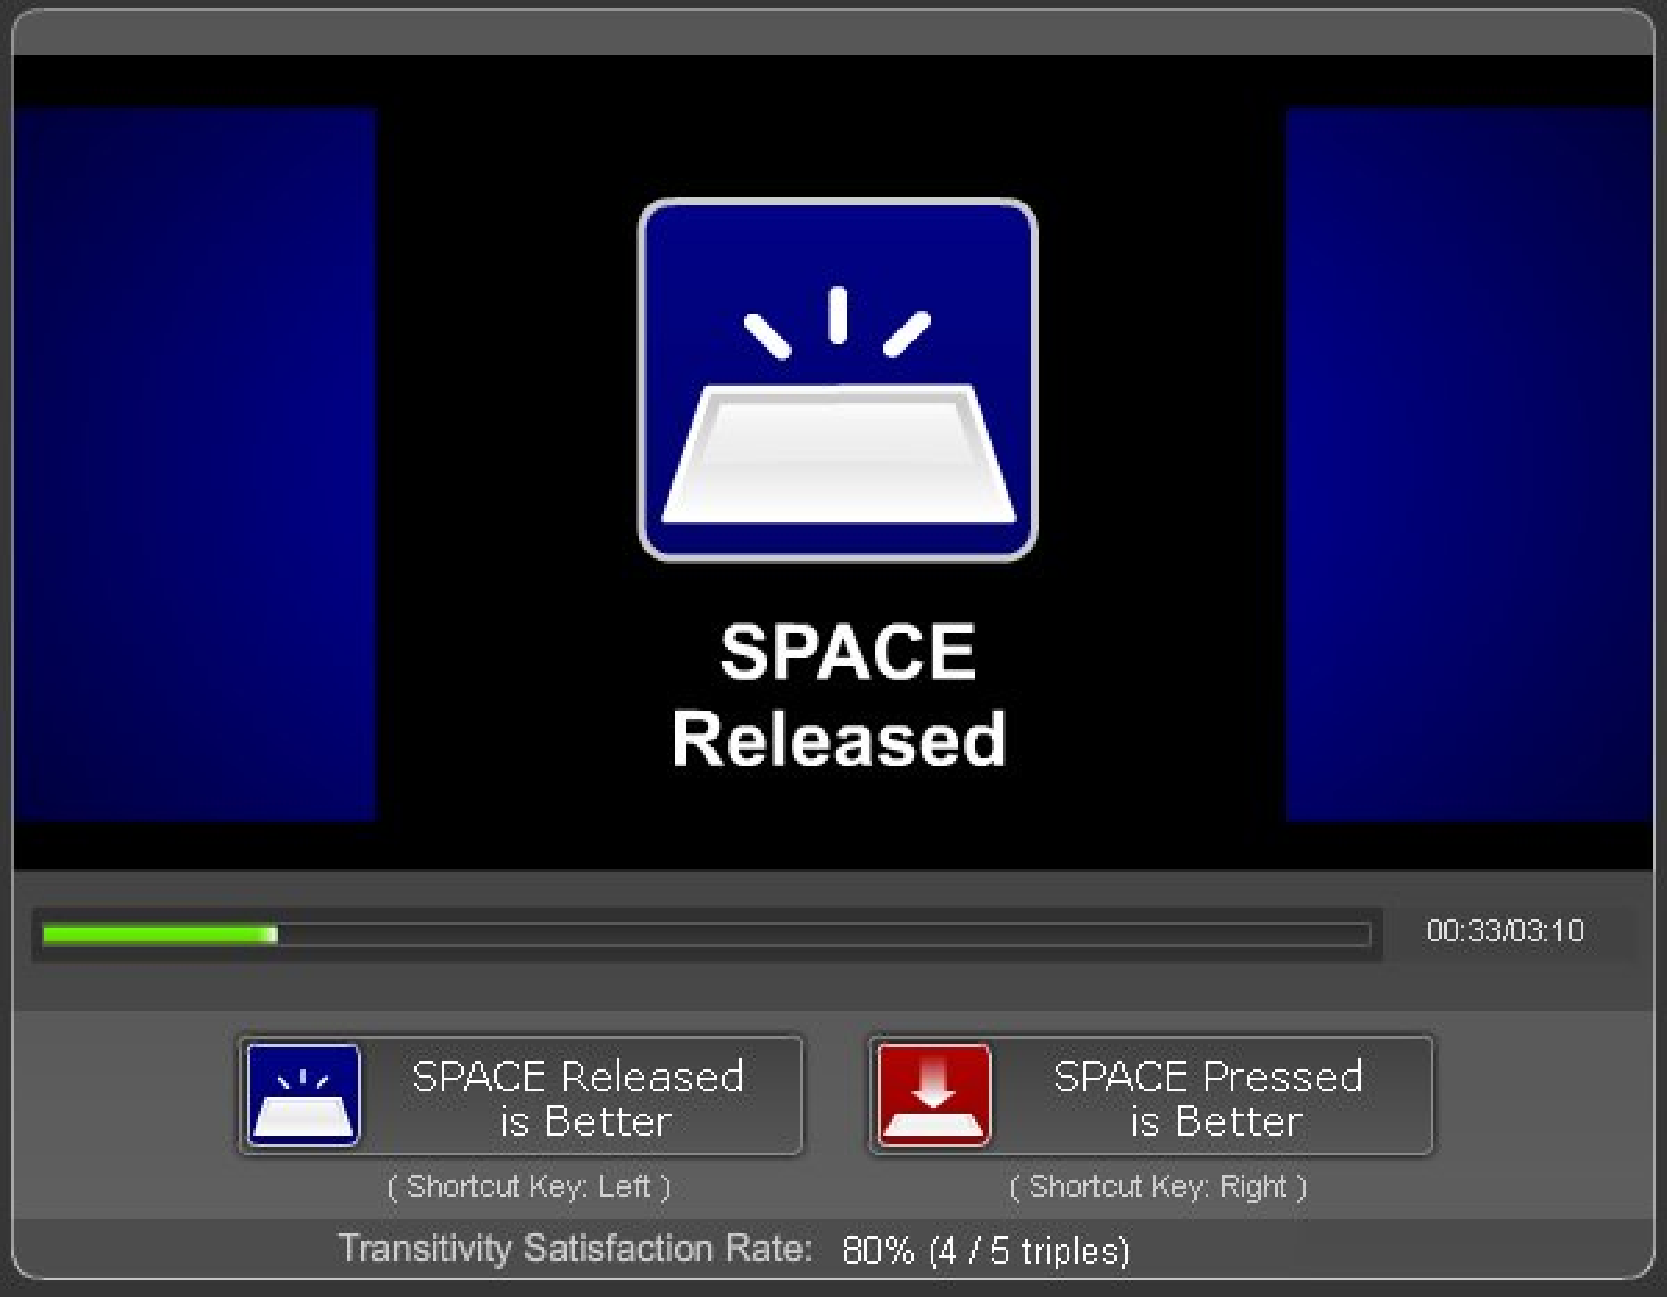 (a) Released state
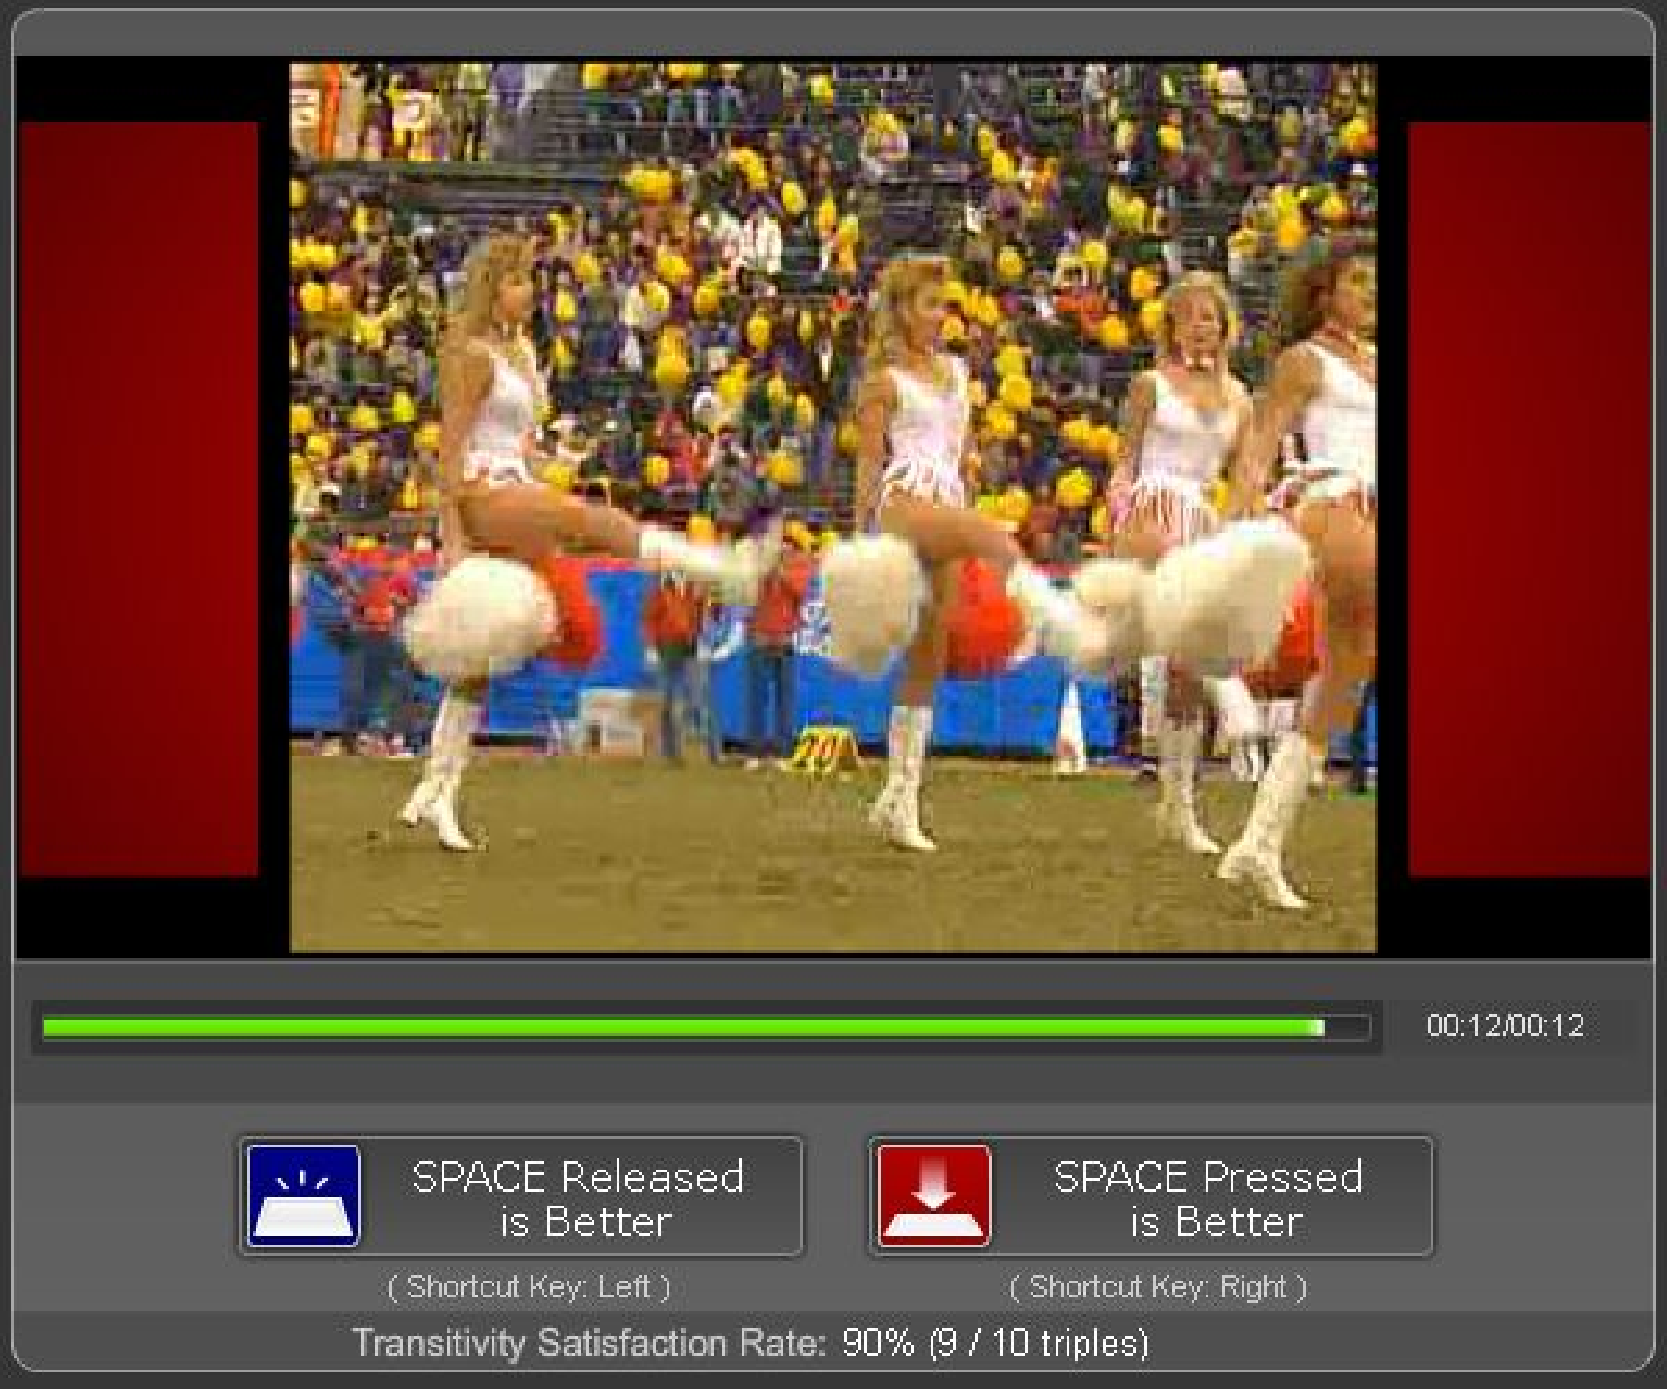
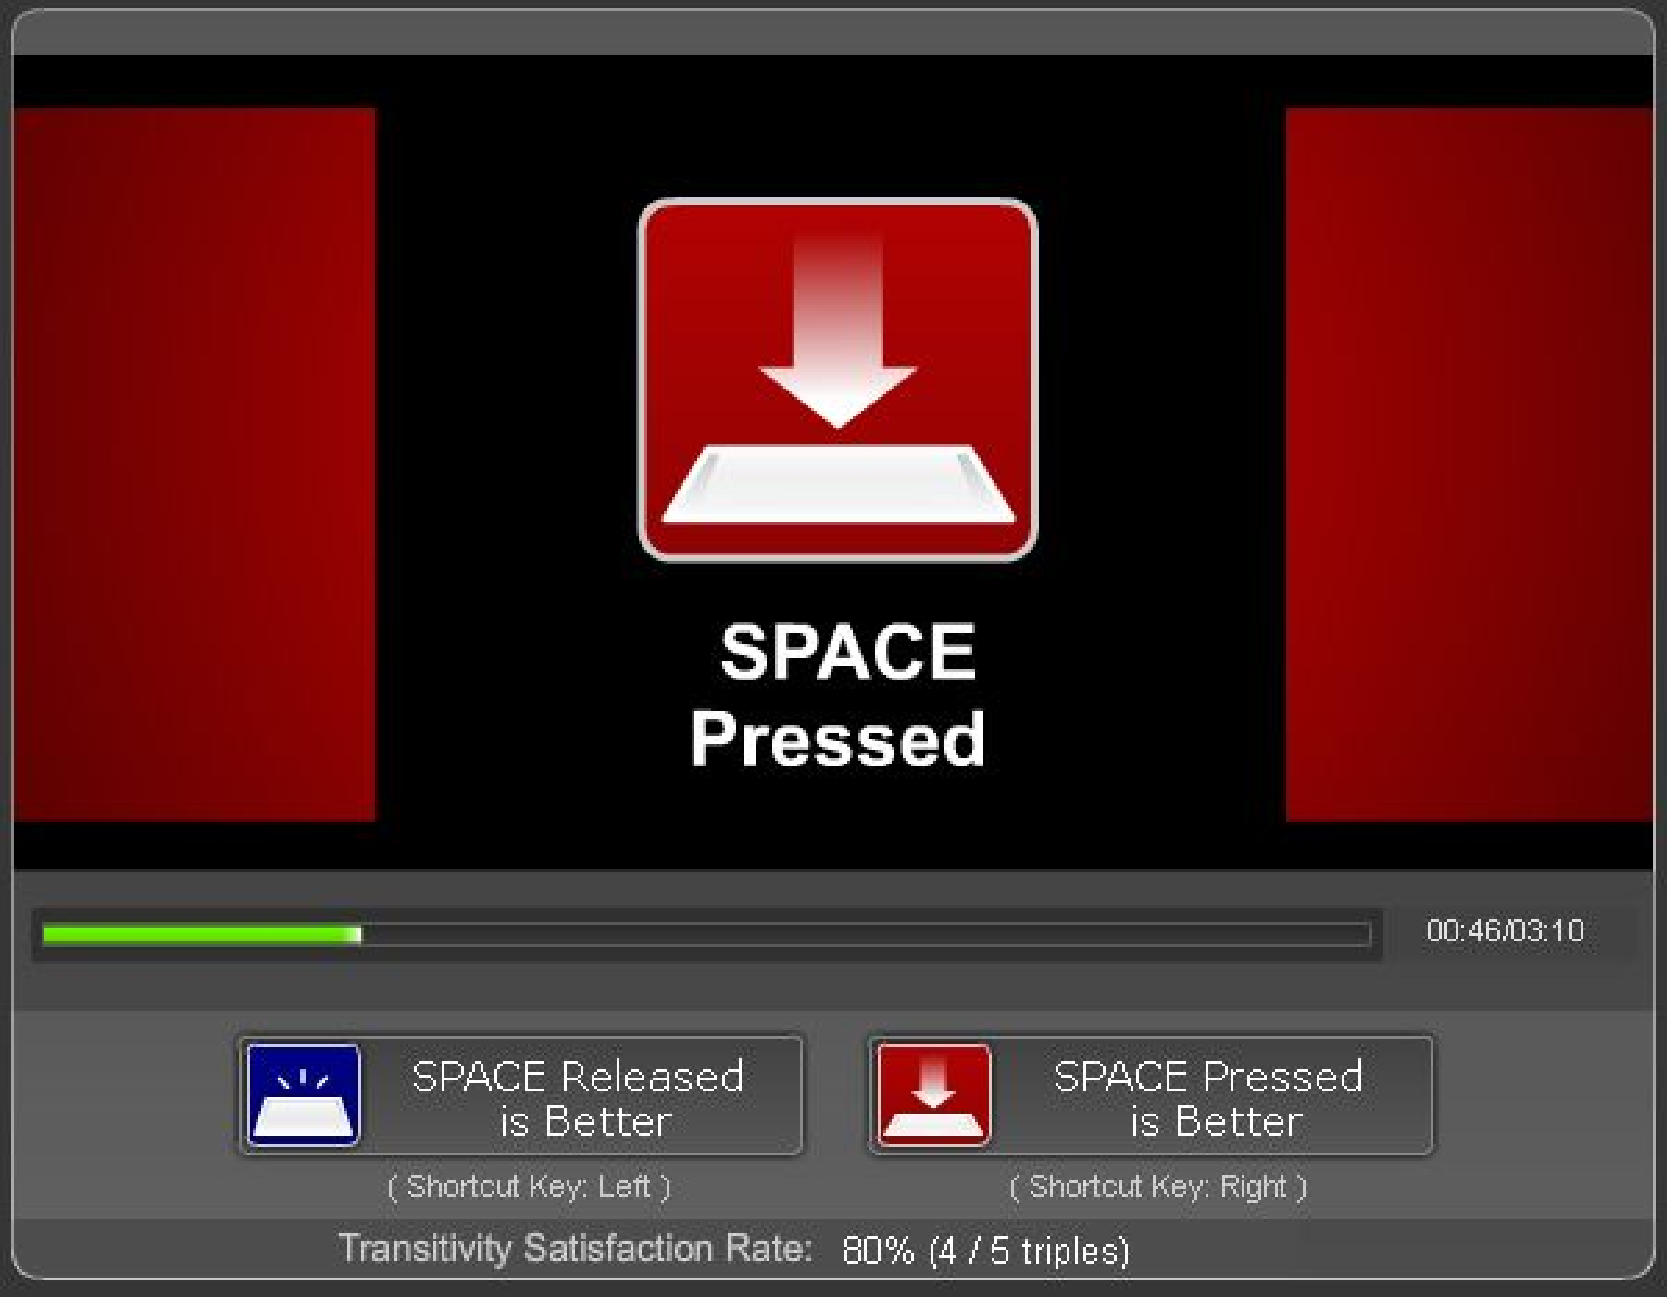 (b) Pressed
state
(b) Pressed
state
 (a) Released state
 (b) Pressed
state
(b) Pressed
state