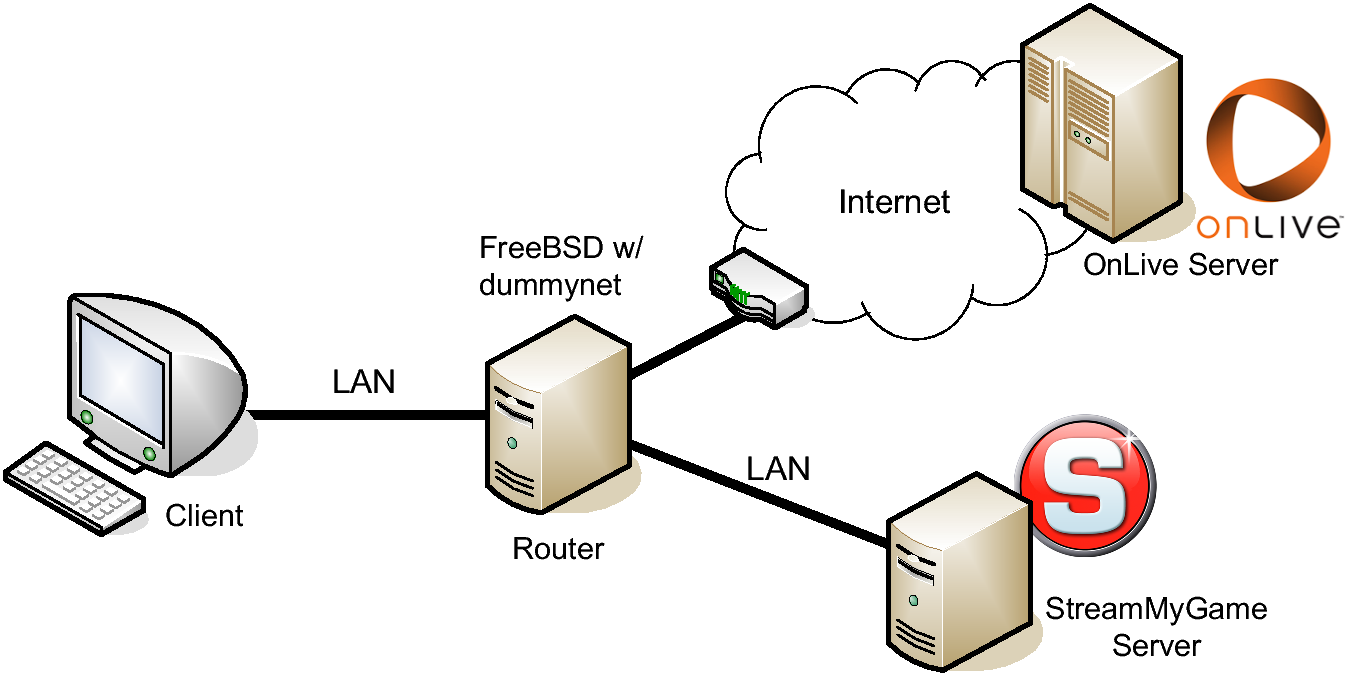
On the Quality of Service of Cloud Gaming Systems

Kuan-Ta Chen, Yu-Chun Chang, Hwai-Jung Hsu, De-Yu Chen, Chun-Ying Huang, Cheng-Hsin Hsu

PDF Version | Contact Us

Abstract

Cloud gaming, i.e., real-time game playing via thin clients, relieves users from being forced to upgrade their computers and resolve the incompatibility issues between games and computers. As a result, cloud gaming is generating a great deal of interests among entrepreneurs, venture capitalists, general publics, and researchers. However, given the large design space, it is not yet known which cloud gaming system delivers the best user-perceived Quality of Service (QoS) and what design elements constitute a good cloud gaming system.
This study is motivated by the question: How good is the QoS of current cloud gaming systems? Answering the question is challenging because most cloud gaming systems are proprietary and closed, and thus their internal mechanisms are not accessible for the research community. In this paper, we propose a suite of measurement techniques to evaluate the QoS of cloud gaming systems and prove the effectiveness of our schemes using a case study comprising two well-known cloud gaming systems: OnLive and StreamMyGame. Our results show that OnLive performs better, because it provides adaptable frame rates, better graphic quality, and shorter server processing delays, while consuming less network bandwidth. Our measurement techniques are general and can be applied to any cloud gaming systems, so that researchers, users, and service providers may systematically quantify the QoS of these systems. To the best of our knowledge, the proposed suite of measurement techniques have never been presented in the literature.
Cloud gaming, live video streaming, measurement, performance evaluation, remote rendering

1  Introduction

Modern computer games are often computationally and graphically intensive, and thus demand for the latest hardware such as multi-core CPUs and high-end graphic cards for fluent game playing [1]. The overhead of setting up a game is also significant because game software is becoming more and more complex. As a result, users are often restricted to one well-equipped computer and cannot play games anytime, anywhere. Furthermore, trying a new game is time consuming, because the game software may be incompatible to users' computers, which forces users to reconfigure their computers. This in turn drives potential users away from computer games. All these issues impose serious burdens on users, and solving the issues is crucial to the game industry for attracting more users.
Cloud gaming is a promising solution to ease the burdens on users. In cloud gaming, computer games run on cloud servers and users interact with games via thin clients, which run on commodity PCs, TVs with set-top boxes, and mobile devices with Internet access. Please note that "traditional" online games also leverage the abundant computing resources in the clouds. As illustrated in Figure 1, traditional online gaming is quite different from the considered cloud gaming. More specifically, in online gaming, all the game logics are executed at game clients, and the game servers are only responsible to maintain consistent game states among multiple game clients. In contrast, the game logics, including the resource-demanding graphics rendering is moved to game servers with the cloud gaming architecture. By offloading the game logics to cloud servers, cloud gaming frees users from the overhead of setting up games, solving hardware/software incompatibility issues, and the need of upgrading their computers. Moreover, cloud gaming is also beneficial to game developers for various reasons, e.g., they no longer need to: 1) support heterogeneous devices and libraries, 2) produce game DVDs, and 3) worry about piracy [2]. Hence, cloud gaming systems may change the way computer games are delivered and played.
cloud_vs_online_games.png
Figure 1: Comparisons between online and cloud gaming.
exp_setup.png
Figure 2: The network topology of our measurement experiments.
In fact, cloud gaming has already generated a great deal of interests among entrepreneurs, venture capitalists, the general publics, and researchers. Several startup companies have offered or plan to offer cloud gaming services, such as OnLive, StreamMyGame, GaiKai, G-Cluster, OTOY, Ubitus, and T5-Labs, though their realizations may be quite different from one another. For example, some systems are only accessible via thin clients on PCs (either native or browser-based applications), while others can be accessed via TVs with set-top boxes. A large number of design alternatives can be adopted when implementing a cloud gaming system, such as: 1) the way the existing game software is modified and run on the server; 2) the way the game screen is encoded (on the server) and decoded (on the client); 3) the way the encoded game screen is streamed to the client; and 4) the way short-term network instability is handled to maintain the game's responsiveness and graphic quality. Because of the large design space of cloud gaming systems, it is not yet known which systems deliver better Quality of Service (QoS) than others and which design elements constitute a good cloud gaming system.
In this paper, we answer the above-mentioned two questions. We achieve this by proposing a suite of novel client-side measurement techniques to quantify the user-perceived QoS of the cloud gaming systems. Designing these client-side techniques, however, is very challenging, because the cloud gaming systems are mostly proprietary and closed. Therefore, their internal mechanisms are not public to the research community. Furthermore, service providers host the cloud servers and the games in their own data centers, and thus we do not have the luxury to augment the servers and games for measurement purposes. Hence, measuring the QoS of these cloud gaming systems in a component-wise manner is extremely difficult, if not impossible.
The performance of cloud gaming systems may be evaluated from a number of view angles. From service providers' perspective, the efficiency of resource allocation schemes is crucial; however, from the end users' perspective, the QoS metrics affecting gaming experience are far more important. Another way to classify the performance metrics is by the time-scale: larger time-scale metrics across multiple game sessions and smaller time-scale metrics are within individual game sessions. In this article, we consider small time-scale metrics from the users' perspective. We chose small time-scale because most cloud gaming systems serve each user using a single Virtual Machine (VM) without load balancing, while VM migration within individual game sessions is unlikely for the sake of high requirements on the responsiveness of games. We focus on the users' perspective, because the cloud gaming services will not sustain without satisfied users. In particular, we concentrate on the following metrics:
To the best of our knowledge, rigorously quantifying these (and other) user-perceived QoS metrics of cloud gaming systems has never been considered in the literature. More specifically, the current article makes the following two contributions: In summary, our proposed measurement techniques can be leveraged by the research community and practitioners to better understand the component-wise QoS of cloud gaming systems.
The remainder of this paper is organized as follows. Section II provides a review on related studies. In Section III, we introduce the cloud gaming systems under evaluation and the measurement setup. In Section IV, the traffic characteristics of the chosen systems are analyzed. In Section V, our measurement techniques of the responsiveness of cloud gaming systems are depicted, and the evaluation results of OnLive and StreamMyGame are presented. In Section VI, we further analyze the impacts of different system parameters on the responsiveness of cloud gaming systems. Section VII measures the graphic quality under various network conditions. The fairness and effectiveness of our measurement techniques are discussed in Section VIII, and our concluding remarks are presented in Section IX.

2  Related Work

This paper touches upon two research domains: designing cloud gaming systems and measuring the QoS of cloud gaming systems. In this section, we review the literature in both domains.

2.1  Remote Gaming Architecture

A number of thin client architectures have been proposed to support real-time remote graphical applications, including remote gaming [3,4,5,6,7,8]. They can be roughly divided into two categories: instruction- and image-based. The instruction-based systems [3,4,7] transmit graphic drawing instructions from servers to clients and leave clients to render the graphics themselves. In contrast, the image-based systems [5,6,8] stream rendered game screens as real-time videos. Typically, instruction-based systems consume less bandwidth, as they only send graphics drawing commands whenever needed. On the other hand, the thin clients of image-based systems are more platform- and implementation-independent and demand for less client resources, because all the rendering tasks are performed at servers. To the best of our knowledge, all the current commercial cloud gaming platforms, such as OnLive, StreamMyGame, Ubitus, and GaiKai, are image-based systems.
This paper proposes a measurement approach for image-based cloud gaming systems. The approach works even if the systems are closed and the servers and games cannot be instrumented, which are true for commercial cloud gaming services such as OnLive. The first open cloud gaming system did not appear until 2013: Huang et al. [8] proposed GamingAnywhere and adopted the measurement techniques proposed in the current article to show that GamingAnywhere outperforms proprietary and closed cloud gaming systems. The current paper presents the detailed measurement techniques, concentrates on the comparisons among commercial cloud gaming systems, and conducts in-depth experimental studies with a wider spectrum of games.

2.2  Measuring the QoS of Real-Time Remote Graphical Applications

Nieh and Laih [9,10] proposed an approach to evaluate the QoS of several thin client systems on various tasks using slow-motion benchmarking. Unfortunately, this technique cannot be applied to cloud gaming systems because games would have to be modified so that they can run in slow motion. Besides, the QoS metrics used, such as the amount of data transferred, do not accurately assess the temporal and spatial quality of cloud gaming systems.
Wong and Seltzer [11] evaluated the performance of Windows NT Terminal Service when serving multi-user accesses. They focused on the server's usage in terms of the processor, memory, and network bandwidth. They also measured the latency introduced by the scarcity of servers' resources. In addition, Packard and Gettys [12] analyzed network traffic between an X client and server under a variety of network conditions. They evaluated the effectiveness of compressors for X protocol streams sent over high-latency links. Their results indicate that when the network delay is longer than 100 ms, an ssh tunnel performs better than the LBX compressed stream in terms of compression efficiency.
Tolia et al. [13] quantified the user-perceived latency when using a number of applications over VNC [14], a popular open-source, cross-platform thin client. They found that when using GIMP via VNC over a network connection with 100 Mbps bandwidth and 100 ms Round-Trip Time (RTT), the input response is longer than 150 ms with a probability of 29%. In contrast, the probability the input response time longer than 150 ms is merely 1% when the network RTT is as short as 1 ms. Lagar-Cavilla et al. [15] also showed that the network latency can negatively impact the interactivity of VNC. Their study revealed that over an 100 Mbps network connection, the frame rate of VNC drops significantly if there is a 33 ms network RTT and causes jerky interactions. More recently, Chang et al.'s [16] methodology to study the performance of games on remote desktop software has been employed to evaluate several popular thin clients, including LogMeIn, TeamViewer, and UltraVNC. Chang et al. established that player performance and Quality-of-Experience (QoE) depend on video quality and frame rates. It is observed that the mainstream thin clients cannot support cloud games given that the achieved frame rate is as low as 9.7 fps [16]. In addition, Lee et al. [17] evaluates whether computer games are equally suitable to the cloud gaming setting and finds that some games are more "compatible" with cloud gaming than others.
In contrast to the previous measurement studies on generic thin client systems [9,10,11,12,13], quantifying the QoS of cloud gaming systems is much more challenging, as these systems have more strict QoS requirements and are often proprietary and closed. Claypool et al. [18] conducted an extensive traffic analysis using the well-known OnLive service. In particular, they compared the network traffic imposed by OnLive against that of traditional online games and live video. They also studied how OnLive adapts to different network conditions and whether game categories affect the network traffic characteristics. This article follows our previous work [19] and completes [18] by proposing a systematic approach to quantify component-wise latency and graphic quality of cloud gaming systems, while our (independently done) network traffic analysis results in observations that are inline with their detailed analysis.

3  Measurement Setup

In this section, we introduce sample cloud gaming systems for measurements, which are OnLive and StreamMyGame (SMG). We then give the details on the measurement setup.

3.1  Sample Cloud Gaming Systems for Measurements

Table 1: Games Selected for Measurements
CategoryShorthandGame TitleRelease DatePublisher
BatmanLEGO Batman: The VideogameSep 23, 2008Warner Bros. Interactive Entertainment
BraidBraidApr 10, 2009Number None, Inc
ConvictionTom Clancy's Splinter Cell: ConvictionApr 13, 2010Ubisoft
TombTomb Raider: UnderworldNov 18, 2008Eidos Interactive
BioShockBioShockAug 21, 20072K Games
FEARF.E.A.R. 2: Project OriginFeb 10, 2009Warner Bros. Interactive Entertainment
NukemDuke Nukem ForeverJun 14, 20112K Games
DOWWarhammer 40,000: Dawn of War IIFeb 19, 2009THQ
RomeGrand Ages: RomeMar 17, 2009Kalypso Media
TropicoTropico 3Oct 20, 2009Kalypso Media
OnLive was introduced at the Game Developer's Conference in 2009, released in June, 2010, and supports 306 games as of July 2012. OnLive is a well-known cloud gaming service with high-profile investors and partners, including Warner Bros, AT&T, Ubisoft, Atari, and HTC. OnLive's clients are available on Microsoft Windows, Mac OS X1, and TV set-top box. The minimum bandwidth requirement for OnLive is 3 Mbps, but an Internet connection of 5 Mbps or faster is recommended. All the games are delivered in HDTV 720p format.
SMG enables each user to set up a game server for remote game playing. That is, users install SMG and their games on their own PCs, and play the games with thin clients over the Internet anywhere, anytime. SMG was launched in October 2007 and supports 128 games from Window-based server to Windows/Linux-based clients as of February 2012. It supports various resolutions between 320x240 to 1920x1080 (1080p) and requires an Internet access between 256 Kbps (320x240) and 30 Mbps (1080p).
Our measurement techniques quantify the QoS of OnLive and SMG by monitoring the actual game play. To obtain the results without bias, we choose heterogeneous and popular games for measurements as follows. GameStats [20] is an online media and service website, which provides the latest game information and allows users to submit their opinions for the games. Most (about 57%) of the GameStats opinions are related to three game categories: action-adventure (ACT), first-person shooter (FPS), and real-time strategy (RTS). More than half of the games available on OnLive and SMG belong to these three categories: 180 out of 306 games for OnLive and 67 out of 128 games for SMG. Moreover, ACT, FPS, and RTS impose different workload on the cloud gaming systems and dictate diverse quality of service requirements for enjoyable game play [1,21]. For example, FPS games normally require high responsiveness, while producing less complex game scenes; comparatively, RTS games produce the most complex game scene while their users can tolerate higher latency [1,21]. The requirements of ACT games in game screen updates, latency, and scene complexity tend to lie between those of FPS and RTS games [1,21]. To cover a wide range of diverse games, we select at least three games from each category for the measurements. The details of the chosen games are given in Table I.

3.2  Network Setup

Figure 2 illustrates the network topology for our experiments, which consists of two servers, a router, and a client. The OnLive server (both the hardware and software) is operated by OnLive Inc. in their own data centers. The SMG server developed by Tenomichi/SSP Ltd. is installed and hosted on one of our PCs. We run both OnLive and SMG clients on the same PC, which is connected to the OnLive server via the Internet and to the SMG server in a Fast Ethernet LAN. All the network traffic goes through a FreeBSD 7.0 router running dummynet to emulate network quality degradations between the client and server, e.g., by incurring additional delay, delay variance, packet loss, and bandwidth limit, whenever needed.
Hereafter, "the server" refers to the SMG server hosted in our LAN for SMG measurements and the OnLive server connected through the Internet for OnLive measurements. All our hosts (the clients and the SMG server) are PCs with Intel Core i7-920 processors at 2.67GHz running Microsoft Windows 7. For fair comparisons, we configure both OnLive and SMG to stream at a resolution of 1280x720 (720p) for all experiments unless otherwise specified.
Since the OnLive server is outside our LAN, the quality of the network path between our client and the OnLive server might affect our measurement results. Fortunately, we observed that the quality of the Internet path was consistently good throughout our experiments. In particular, the network delay of the path was around 130 ms with only few fluctuations. The standard deviations of the RTT were mostly less than 5 ms for 100 back-to-back ICMP ping measurements with 1 Hz sampling frequency. The path capacity allows OnLive to transmit 5 Mbps of gaming content to our client without any noticeable raise of packet loss. The ICMP ping measurements taken at 1 Hz during all the OnLive experiments showed that the overall packet loss rate was less than 10−6. Therefore, the path between the OnLive server and our client is essentially a communication channel with sufficient bandwidth, zero packet loss, and a 130 ms constant latency. In Section V, we will show that our measurement techniques are immune to network delay between the client and the server as long as the delay variance is small.
traffic_all_app2.png
Figure 3: Traffic characteristics of OnLive and StreamMyGame.

4  Traffic Analysis

In this section, we collect and analyze the traffic of playing different games on two cloud gaming systems.

4.1  Trace Collection

To collect network traffic for analysis, an experienced game player was asked to play the considered games using OnLive and SMG clients. We ran tcpdump on the FreeBSD server (see Figure 2) to record all the packets between the client and server. Each game session lasted 10 minutes, and a total of three hours of tcpdump traces from the 2x9 system-game pairs were collected. Since users' actions and scene complexity may affect the traffic characteristics significantly [1], we asked the user to follow the guidelines: 1) move across as many scenes as possible while fighting opponents as required in regular game play and 2) repeat his actions and visit the same scenes as much as possible when playing a game on both cloud gaming systems.

4.2  Traffic Characteristics

Figure 3 plots the average bandwidth, packet rate, and payload size with 95% confidence bands of all considered games and cloud gaming systems. The uplink and downlink figures present the characteristics of the client traffic and the server traffic respectively. To determine whether the bandwidth consumption is game- or system-dependent, we calculate the rank correlation of the bandwidth used by individual games among different cloud gaming systems with Kendall's tau coefficients. For uplink bit rates, the rank correlation of 0.67 shows that the client traffic is game-dependent. For example, the uplink bit rates of Batman is much lower than the other games in both cloud gaming systems. We believe this is due to that Batman is controlled only by keyboard while the other games are controlled by both keyboard and mouse, therefore the uplink bit rates of Batman is lower than the other games.
For the downlink bit rates, the rank correlation of 0.05 indicates that the server's outgoing traffic is not dependent on games. The downlink bandwidth of OnLive varies between 3 Mbps and 5 Mbps, and that of SMG varies between 9 Mbps and 18 Mbps. This shows that OnLive incurs less server traffic than SMG, and the server traffic is system-dependent. Furthermore, the downlink bit rates are almost two orders of magnitude higher than the uplink bit rates, and thus the bandwidth efficiency of cloud gaming systems is primarily determined by server traffic. Overall, OnLive is more bandwidth-efficient than SMG. Furthermore, SMG's downlink payload size is similar across games, whereas OnLive's downlink payload size varies across games. A closer look indicates that most of the packets sent by SMG server are around 1400 bytes, which shows that SMG server tends to aggregate small packets for maximal payload length. This allows SMG to reduce the header overhead at the expense of longer latency. In summary, comparatively, we found that the client traffic is game-dependent, while the server traffic is rather system-dependent.
Last, we notice that although our measurements were conducted independently to Claypool et al. [18], our observations on OnLive are inline with theirs. In particular, we found that: (i) the downlink bit rates are in the range of 3 to 5 Mbps, (ii) the downlink packet sizes are slightly smaller than 1000 bytes, and (iii) OnLive traffic is very asymmetric: the downlink bit rate is about 70x higher than uplink bit rate, the downlink packet rate is about 9x higher than uplink packet rate, and the downlink payload size is 8x than uplink payload size.

5  Quantifying Responsiveness

We propose a set of measurement techniques to quantify the responsiveness in this section. Responsiveness is the most critical user-perceived QoS metric for cloud gaming systems. We define the Response Delay (RD) as the time duration between a user submitting his/her command and the time the corresponding game frame is displayed to the user. RD directly affects the user's performance and gaming experience [1]. Although RD can be explicitly measured when running games on a standalone PC, measuring RD in a cloud gaming system is much more complicated because it comprises multiple components. We divide the RD of a cloud gaming system into the following four components. RD equals the sum of all the delays described above, i.e.:
RD=ND+PD+GD+OD.
(1)
Among all the delays, ND can be measured with tools like ICMP ping, and GD is game-dependent. In this work, we assume that GD does not change while a game is customized for a cloud gaming system; therefore, GD of individual games can be measured from the PC versions of the games. Measuring the PD (at the server) and OD (at the client) is not straightforward because PD and OD occur internally in cloud gaming systems, and may not be accessible from outside. Hence, special attentions are needed to measure the PD and OD components.
In the rest of this section, we will describe how RD of a cloud gaming system is measured in Section  V-A and report the GDs of the considered games in Section  V-B. Lastly, in Section  V-C, the techniques to accurately decompose PD and OD from RD and the results will be presented.
proc3.png
Figure 4: The procedure of measuring response delay by sending a movement event.
rd_decomposition.png
Figure 5: Decomposition of response delay.

5.1  Response Delay Measurement

To measure the RDs of a cloud gaming system, we exploit the fact that most games support a movement event which changes the game scene immediately during game play. The movement event is usually a keystroke moving the avatar in ACT games or a mouse wheel scroll changing the viewpoints in RTS and FPS games. Figure 4 illustrates how we measure the RD of a cloud gaming system. First, a movement event is fired on the client at time t0. We assume that the server receives the event at time t1, processes the event, and sends the encoded frame to the client at time t2. The client receives the frame at time t3, and we observe the game screen updated at time t4. As Figure 5 shows, RD equals (t4−t0), i.e., the time duration between t0 and t4. Within RD, ND equals the sum of (t1−t0) and (t3−t2). Moreover (t2−t1) is composed of PD and GD, and (t4−t3) equals to OD.
Table 2: Response delay of diverse games on different cloud gaming systems
BatmanConvictionTombBioShockFEARNukemDOWRomeTropico
RD399 ms402 ms333 ms332 ms288 ms351 ms358 ms377 ms290 ms
ND131 ms130 ms131 ms131 ms131 ms131 ms130 ms132 ms131 ms
RD502 ms553 ms454 ms405 ms397 ms424 ms402 ms407 ms420 ms
ND < 1 ms
To determine RD, i.e., to measure (t4−t0), we utilize the hooking mechanism2 in Windows to inject our instrumentation code into the OnLive and SMG clients. The detours [22] library is adopted to intercept the following two functions:
  1. IDirect3dDevice9::EndScene(): The OnLive client calls this function when it finishes drawing a frame in the background and is ready to display the frame on the screen.
  2. IDirect3DSurface9::UnlockRect(): The SMG client calls this function when it finishes drawing a frame and is ready to display the frame on the screen.
After hooking the functions, the following steps are taken to measure the response delay:
  1. Simulate a movement event by calling the SendInput() function at time t0.
  2. Each time the game screen is updated, we monitor a specific set of pixels to determine if the game scene is changed.
  3. Wait until the scene changes and note the time as t4.
As t4 is measured, the RD corresponding to the movement event can be calculated by subtracting t0 from t4. The procedure repeats many times for each game on each cloud gaming system to obtain RD samples. Besides, along with RD measurement, ND samples are also measured using ICMP pings. The average RDs and NDs of different games on cloud gaming systems are shown in Table II. In particular, the RDs vary between 290-400 ms for OnLive and 400-550 ms for SMG. The distance between the server and client results in a 130 ms ND for OnLive while the NDs for SMG among all the games are negligible (less than 1 ms), since both SMG server and client are in the same LAN.

5.2  Game Delay Measurement

local_delay.png
Figure 6: Game delays of the PC versions of the considered games.
GD is comprised of several parts. The first part is the processing time required for a game software to process input commands and to render the corresponding frames. The second part is decided by the interval of the main loop of games, as most games process users' commands at regular intervals, say, every 20 ms. Besides, some games may intentionally introduce additional delays to pacify users' control actions. GD occurs in games internally and cannot being directly observed outside.
We measure GDs of individual games using their PC versions. We make two assumptions. First, we assume that the cloud gaming systems provide sufficient computational power for the games. Second, we assume that the design of main loop and intentional delays of each game remain intact when the game is customized for cloud gaming systems. These two assumptions guarantee that the GDs measured on a PC approximate the actual GDs on cloud gaming systems.
For SMG measurements, the assumptions are certainly valid because the configuration of the SMG server and the games installed on it are under our control. For OnLive measurements, these assumptions are reasonable for two reasons. First, the cloud gaming providers usually adopt high-end hosts for game streaming to guarantee the quality of experience. Second, as the mechanism of game delay is irrelevant to real-time streaming, it is unlikely to be changed significantly for cloud gaming systems.
Under the assumptions, the GDs of the considered games are measured by applying the function hooking technique described in Section  V-A. The movement events and the selected game scenes are identical to those in the RD measurements. We repeat the measurements 100 times for each game, and plot the average GDs with 95% confidence bands in Figure 6. The narrow confidence bands indicate that our measurements are reliable.

5.3  Decomposing Processing Delay and Playout Delay

cluster_onlive.png
Figure 7: OnLive's scatter plots of tblock_succeeded (red crosses) and tblock_failed (blue circles) samples. The vertical dashed line denotes the estimation of t3. Note that ND has been subtracted from the measurements.
cluster_smg.png
Figure 8: StreamMyGame's scatter plots of tblock_succeeded (red crosses) and tblock_failed (blue circles) samples. The vertical dashed line denotes the estimation of t3.
Since we know how to measure RD, ND, and GD, we can derive PD and OD by determining either one of them. We propose a novel technique to estimate t3 (shown in Figure 5). After t3 is determined, OD can be calculated, and PD can be consequently derived.
The rationale behind estimating t3 is that it is the time the updated game frame entered into the client from the server. Thus, if the incoming data is (intentionally) blocked on the client before t3, the updated frame is not shown until the blocking is cancelled. On the other hand, if the incoming data is blocked after t3, the updated frame is displayed despite that no further frames can be received and shown on the screen as long as the blocking sustains.
all_delay_v2.png
Figure 9: The estimated game, processing, and playout delays of the considered games on two cloud gaming systems.
Table 3: PDs and ODs of the considered games on the two cloud gaming systems
BatmanConvictionTombBioShockFEARNukemDOWRomeTropico
PD (mean / sd.)118 / 2.4 ms113 / 1.6 ms119 / 2 ms145 / 2.7 ms110 / 1.8 ms142 / 1.7 ms191 / 2.1 ms204 / 5 ms105 / 3.8 ms
OD (mean / sd.)24 / 3.7 ms25 / 4.3 ms33 / 2.4 ms22 / 3 ms31 / 2.1 ms20 / 1.3 ms21 / 2.2 ms27 / 3.9 ms25 / 4 ms
PD (mean / sd.)350 / 2.4 ms383 / 1.6 ms380 / 4.3 ms351 / 1.3 ms362 / 0.8 ms332 / 3.9 ms365 / 0.9 ms364 / 2.2 ms364 / 1.8 ms
OD (mean / sd.)26 / 2.9 ms36 / 1.9 ms23 / 4.2 ms21 / 2.2 ms18 / 1.8 ms34 / 3.9 ms21 / 1.5 ms29 / 3.8 ms27 / 1.8 ms
To facilitate incoming data (i.e., packets) blocking, we hook the Winsock function recvfrom(), which is invoked when the clients attempt to retrieve a UDP datagram from the UDP/IP stack. Instead of one single packet, an encoded video frame is usually composed of hundreds or even thousands of packets. When the function recvfrom() is blocked, the first packet being blocked (from being read by the client) may correspond to the first, middle, or last of the packets associated with a game screen. Thus, to ensure the accuracy of t3 determination, we start to block this function only immediately after a game screen is rendered. The measurement procedure is as follows.
  1. Call the function SendInput() at time t0 to invoke a movement event. With the assumption that OD is shorter than 100 ms, compute tblock as a random time between RD−100 ms and RD+50 ms3.
  2. If the updated frame appears before tblock, record the time as tupdate and terminate the procedure. Otherwise, temporarily block all the subsequent recvfrom() calls for one second4 at tblock.
  3. Wait until the updated frame appears, record the time as tupdate, and terminate the procedure.
The blocking sustains from tblock to tblock+1 sec, and is considered successful if tupdate > tblock+1 sec. In this case, t3 should be some time after tblock, and tblock is added to the record named tblock_succeeded. On the other hand, if tupdate ≤ tblock, the blocking is considered failed and t3 must be some time before tupdate. In this case, tupdate is added to the record named tblock_failed. By repeating the procedure numerous times, tblock_succeeded and tblock_failed contain sample points before and after t3 respectively, and t3 lies approximately at the boundary of the two groups. t3 is then estimated as the point yielding the minimum sum of the two density functions formed by tblock_succeeded and tblock_failed respectively, where each density function is computed as the mixture of the Gaussian density functions centered at each element with a standard deviation of a reasonable magnitude5. By estimating t3, OD can be computed as t4−t3, and PD is derived as t3−t0−ND−GD.
Figures 7 and 8 show the scatter plots of tblock_succeeded and tblock_failed samples. The time points in tblock_succeeded and tblock_failed are denoted with red crosses and blue circles respectively. The NDs have been excluded from all the samples for a fair comparison between OnLive and SMG. We make an observation that the samples gathered from OnLive are normally distributed while those of SMG are aggregated around certain values. A closer look indicates that SMG tends to maintain its frame rate at 25 fps (frames per second), and therefore the inter-frame time of SMG is fixed at 40 ms. Since tblock and tupdate can only be obtained whenever a frame is presented on the screen, they tend to cluster around points with 40-ms intervals. Moreover, because t3 (and consequently PD and OD) are inferred based on a set of iterations, the robustness of our estimation of t3 can be checked by cross-validation. Instead of using the samples from all the iterations, 50 iterations are randomly selected from all the iterations to estimate t3. 10 rounds of the estimation are made, and the results from different rounds are compared to show the robustness of our measurement techniques. The mean values and standard deviations of PD and OD of the two cloud gaming systems are summarized in Table III. The standard deviations of our estimation in PD and OD are all smaller than 5 ms, which indicates that our estimations are reliable without suffering from significant measurement noises.

5.4  Results of Responsiveness Measurements

Figure 9 shows the averages of PD, OD, and GD of the considered games on OnLive and SMG6. This figure shows that OnLive's PDs are about half of those of SMG. This can be partly attributed to the multi-tiled7 and the hardware-accelerated video encoder used by OnLive [23]. The average ODs of both cloud gaming systems are around 18-36 ms with limited differences among games. Such short ODs indicate that both systems perform equally well in frame decoding and display.
In summary, OnLive's overall streaming delay (i.e., PD at the server and OD at the client) is 130-230 ms. On the other hand, real-time encoding of 720p game screen seems to be a large burden for SMG on an Intel i7-920 server because the streaming delay measured on SMG can be as long as 360-420 ms. It is reported that FPS players expect latency less than 100 ms for acceptable players' performance; sports and role playing game players demand for less than 500 ms; while RTS and simulation game players dictate less than 1000 ms [21]. Both cloud gaming systems may fail to satisfy FPS players; however, with insignificant network delays, OnLive may satisfy the needs of most users of the other game categories while SMG might be only marginal or even unacceptable for certain games.
scene_delay.png
Figure 10: Response delays (without ND) of different scenes of BioShock and Rome.
scene_h264.png
Figure 11: The correlation between the entropy and the processing and playout delay.

6  Impact of System Design and Parameters on Responsiveness

In this section, we study how the scene complexity, update region size, screen resolution, and computational power of servers affect the responsiveness of cloud gaming systems. For fair comparisons between OnLive and SMG, we deduct network delays (ND) from all the figures reported.

6.1  Impact of Scene Complexity

Figure 9 shows that the PDs of DOW and Rome, both are omnipresent RTS games, are higher than those of the other games on OnLive8. This can be attributed to the highly complex game scenes of DOW and Rome, which take longer to be encoded and transmitted [1].
bioshock_complex.png 
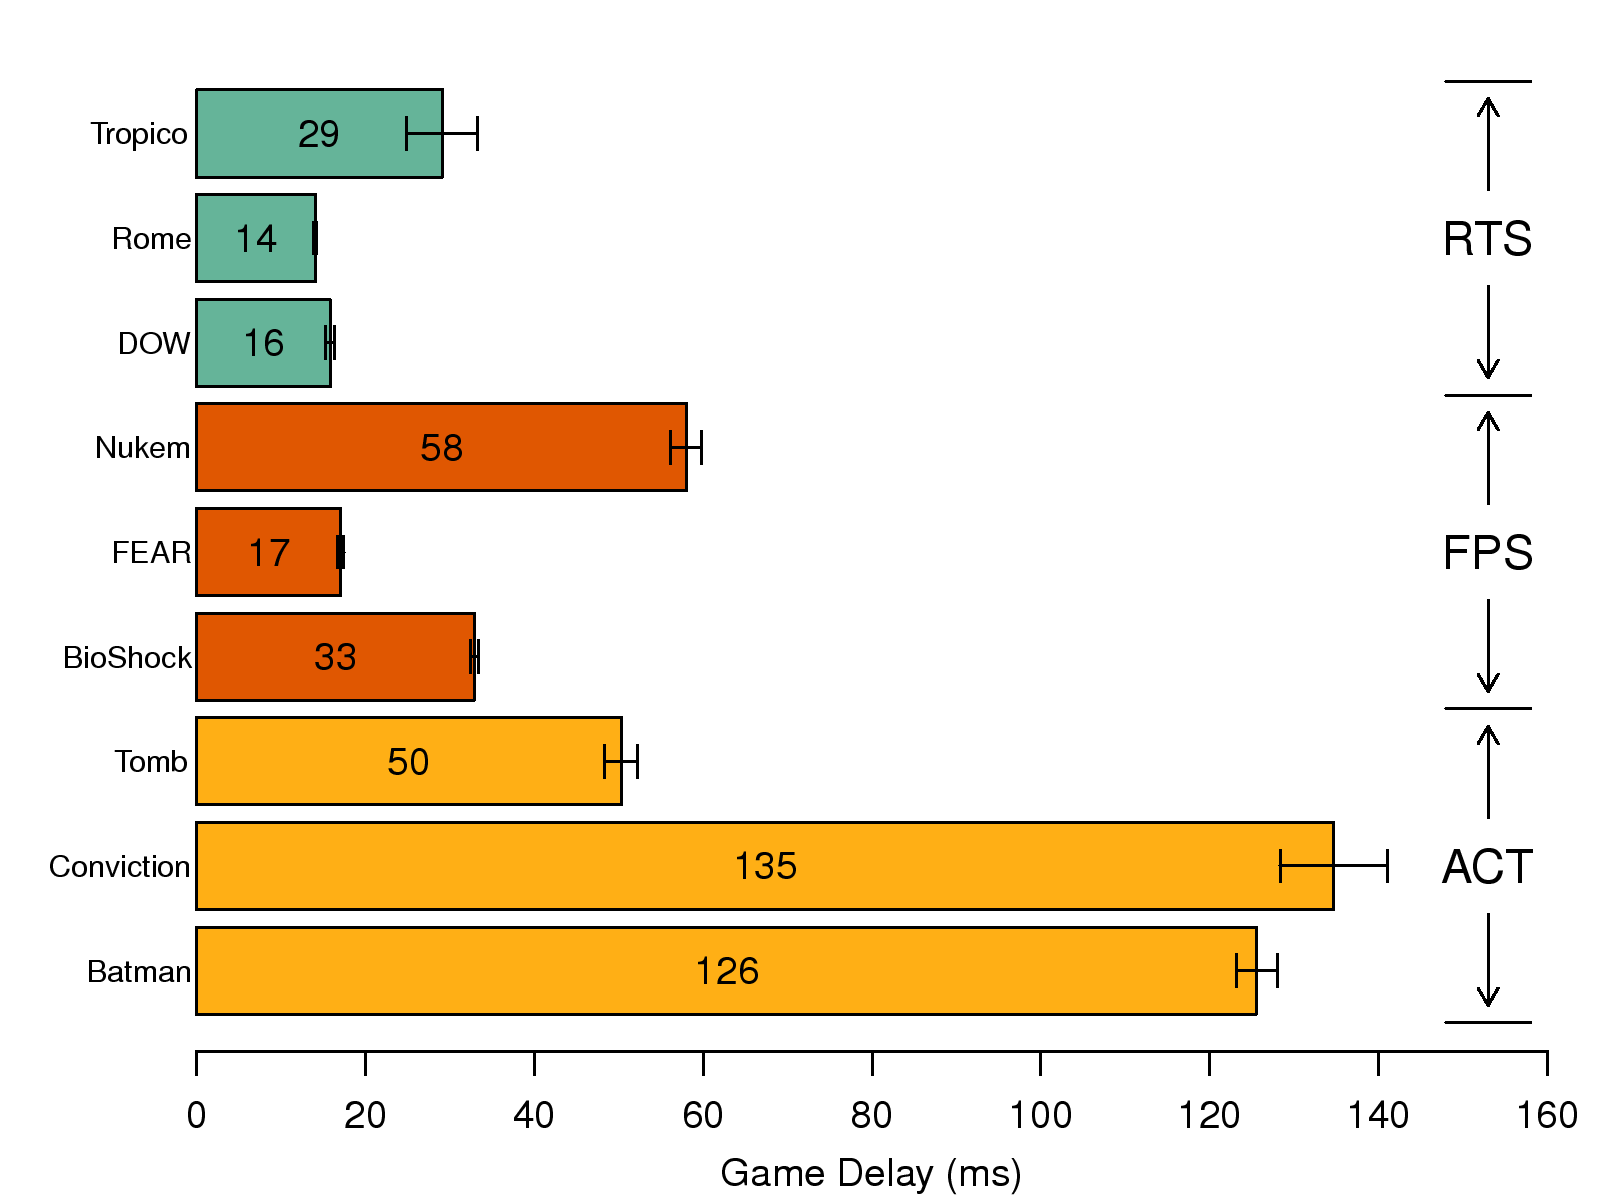
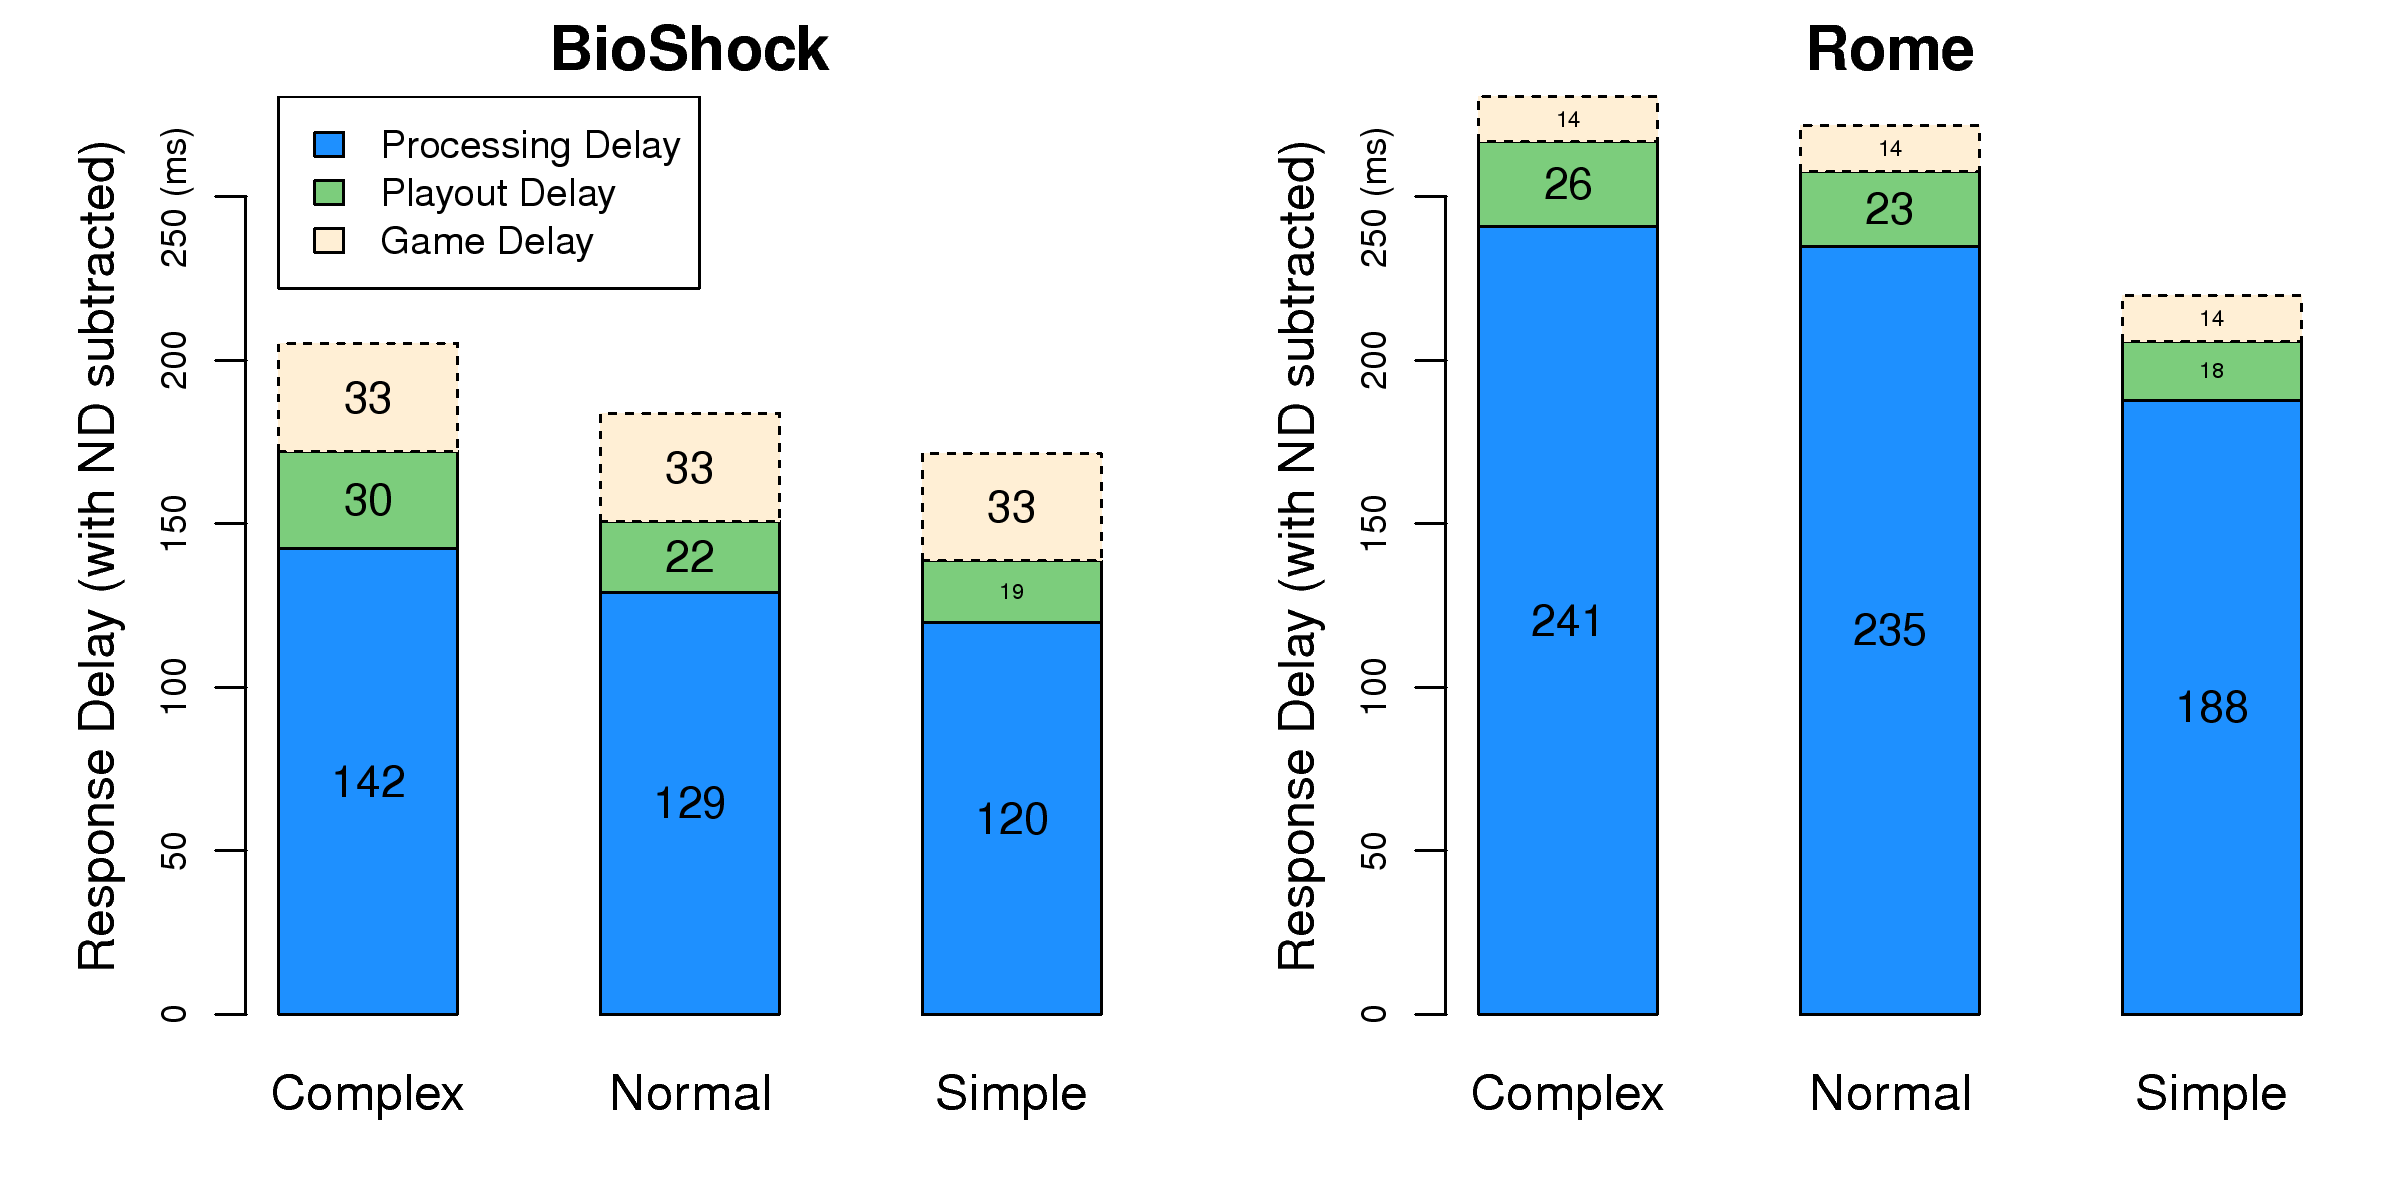
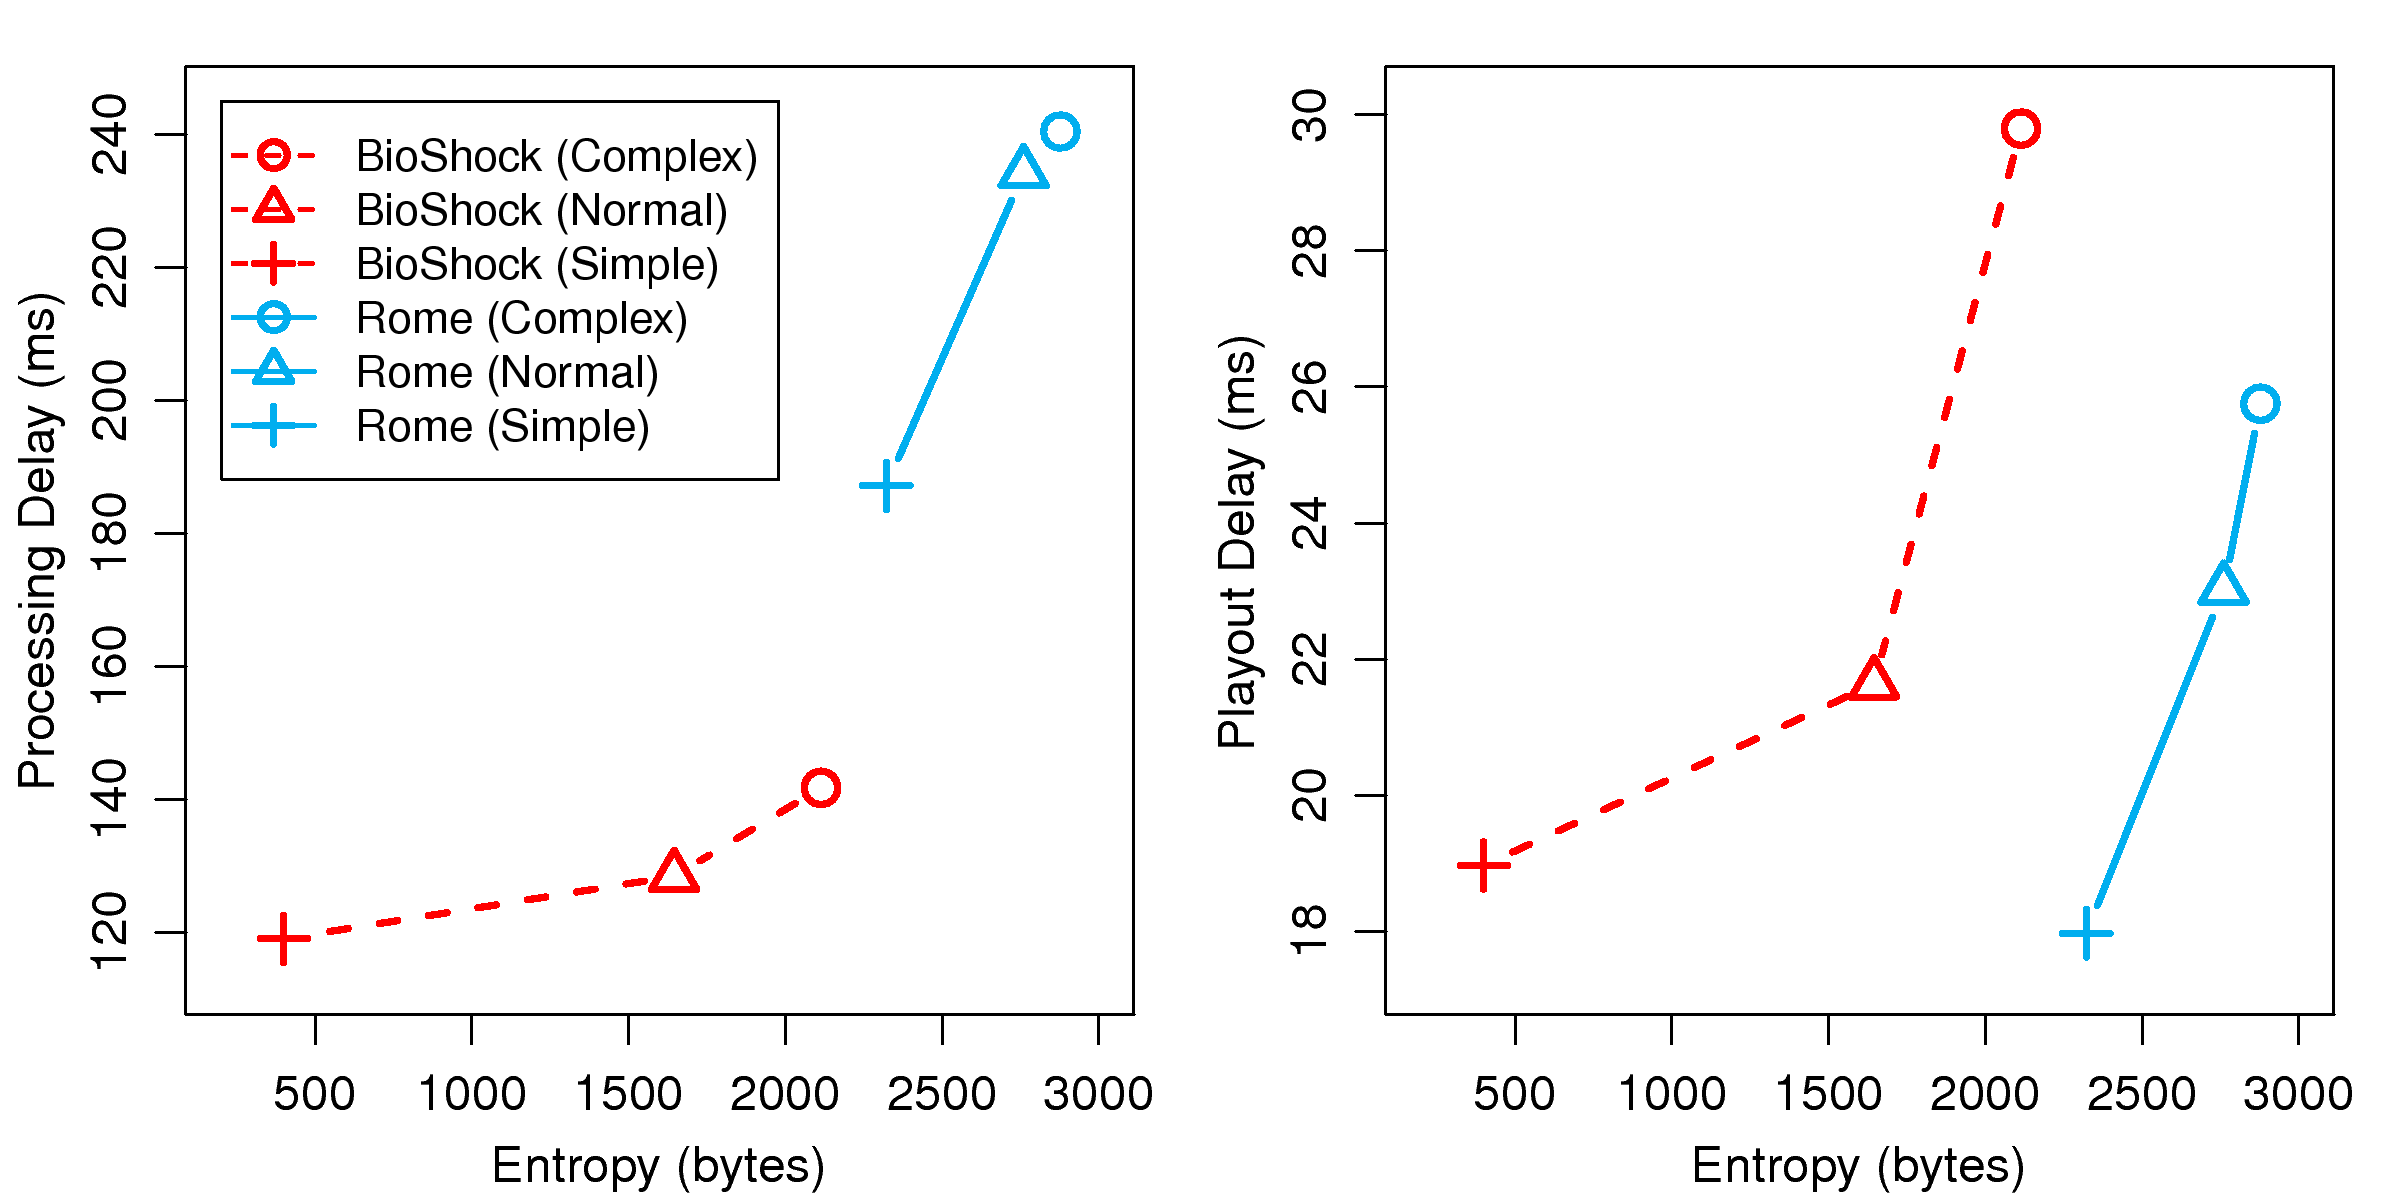
(a) BioShock, complex, entropy 2,114 bytes
bioshock_normal.png (b) BioShock, normal, entropy 1,645 bytes
bioshock_simple.png (c) BioShock, simple, entropy 401 bytes
rome_complex.png 
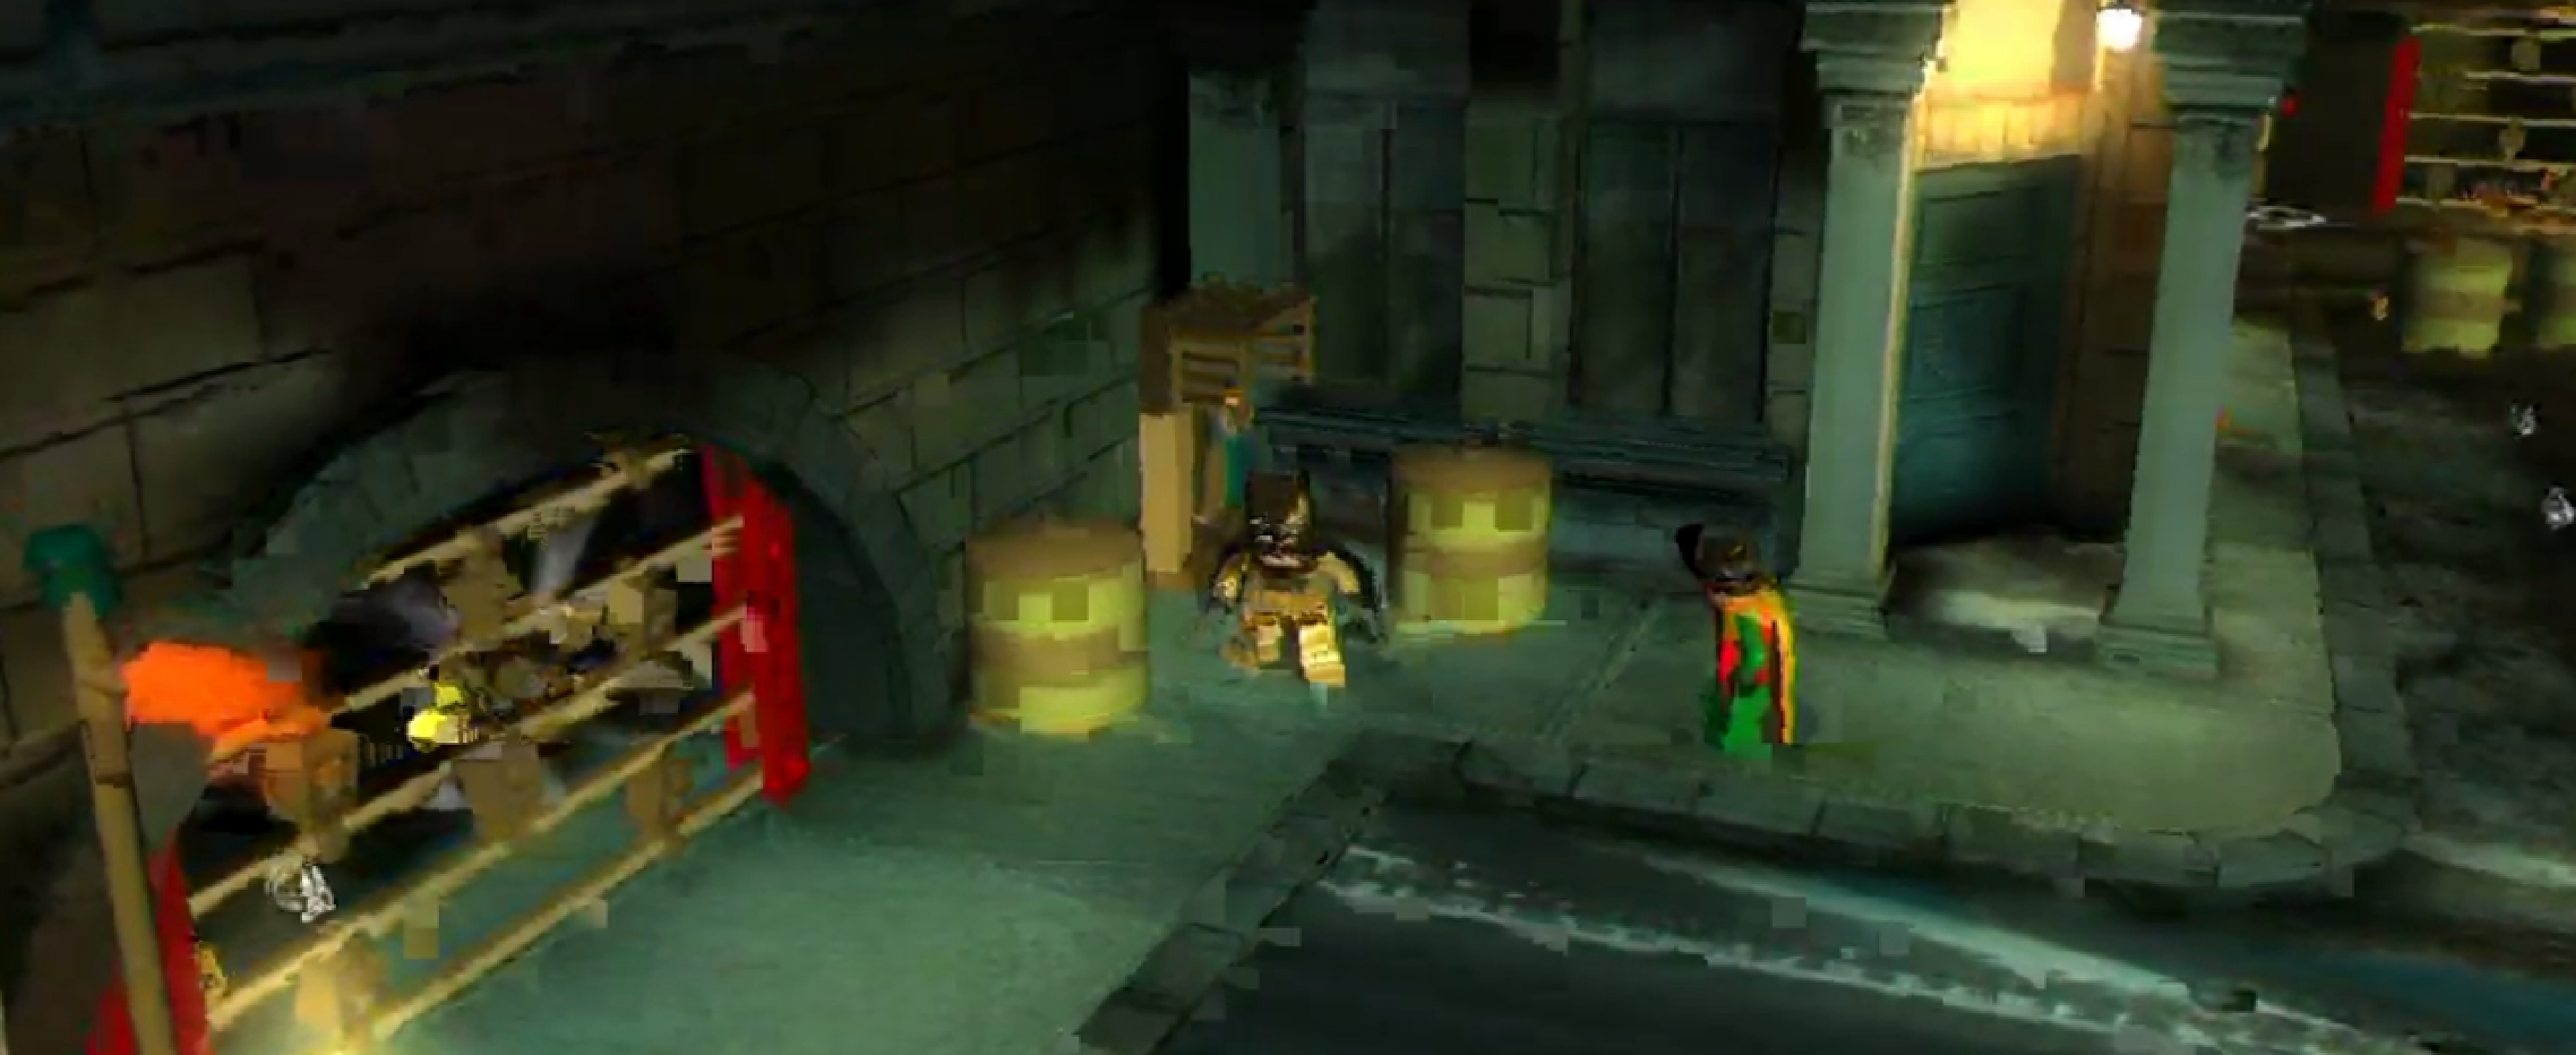
(d) Rome, complex, entropy 2,877 bytes
rome_normal.png 
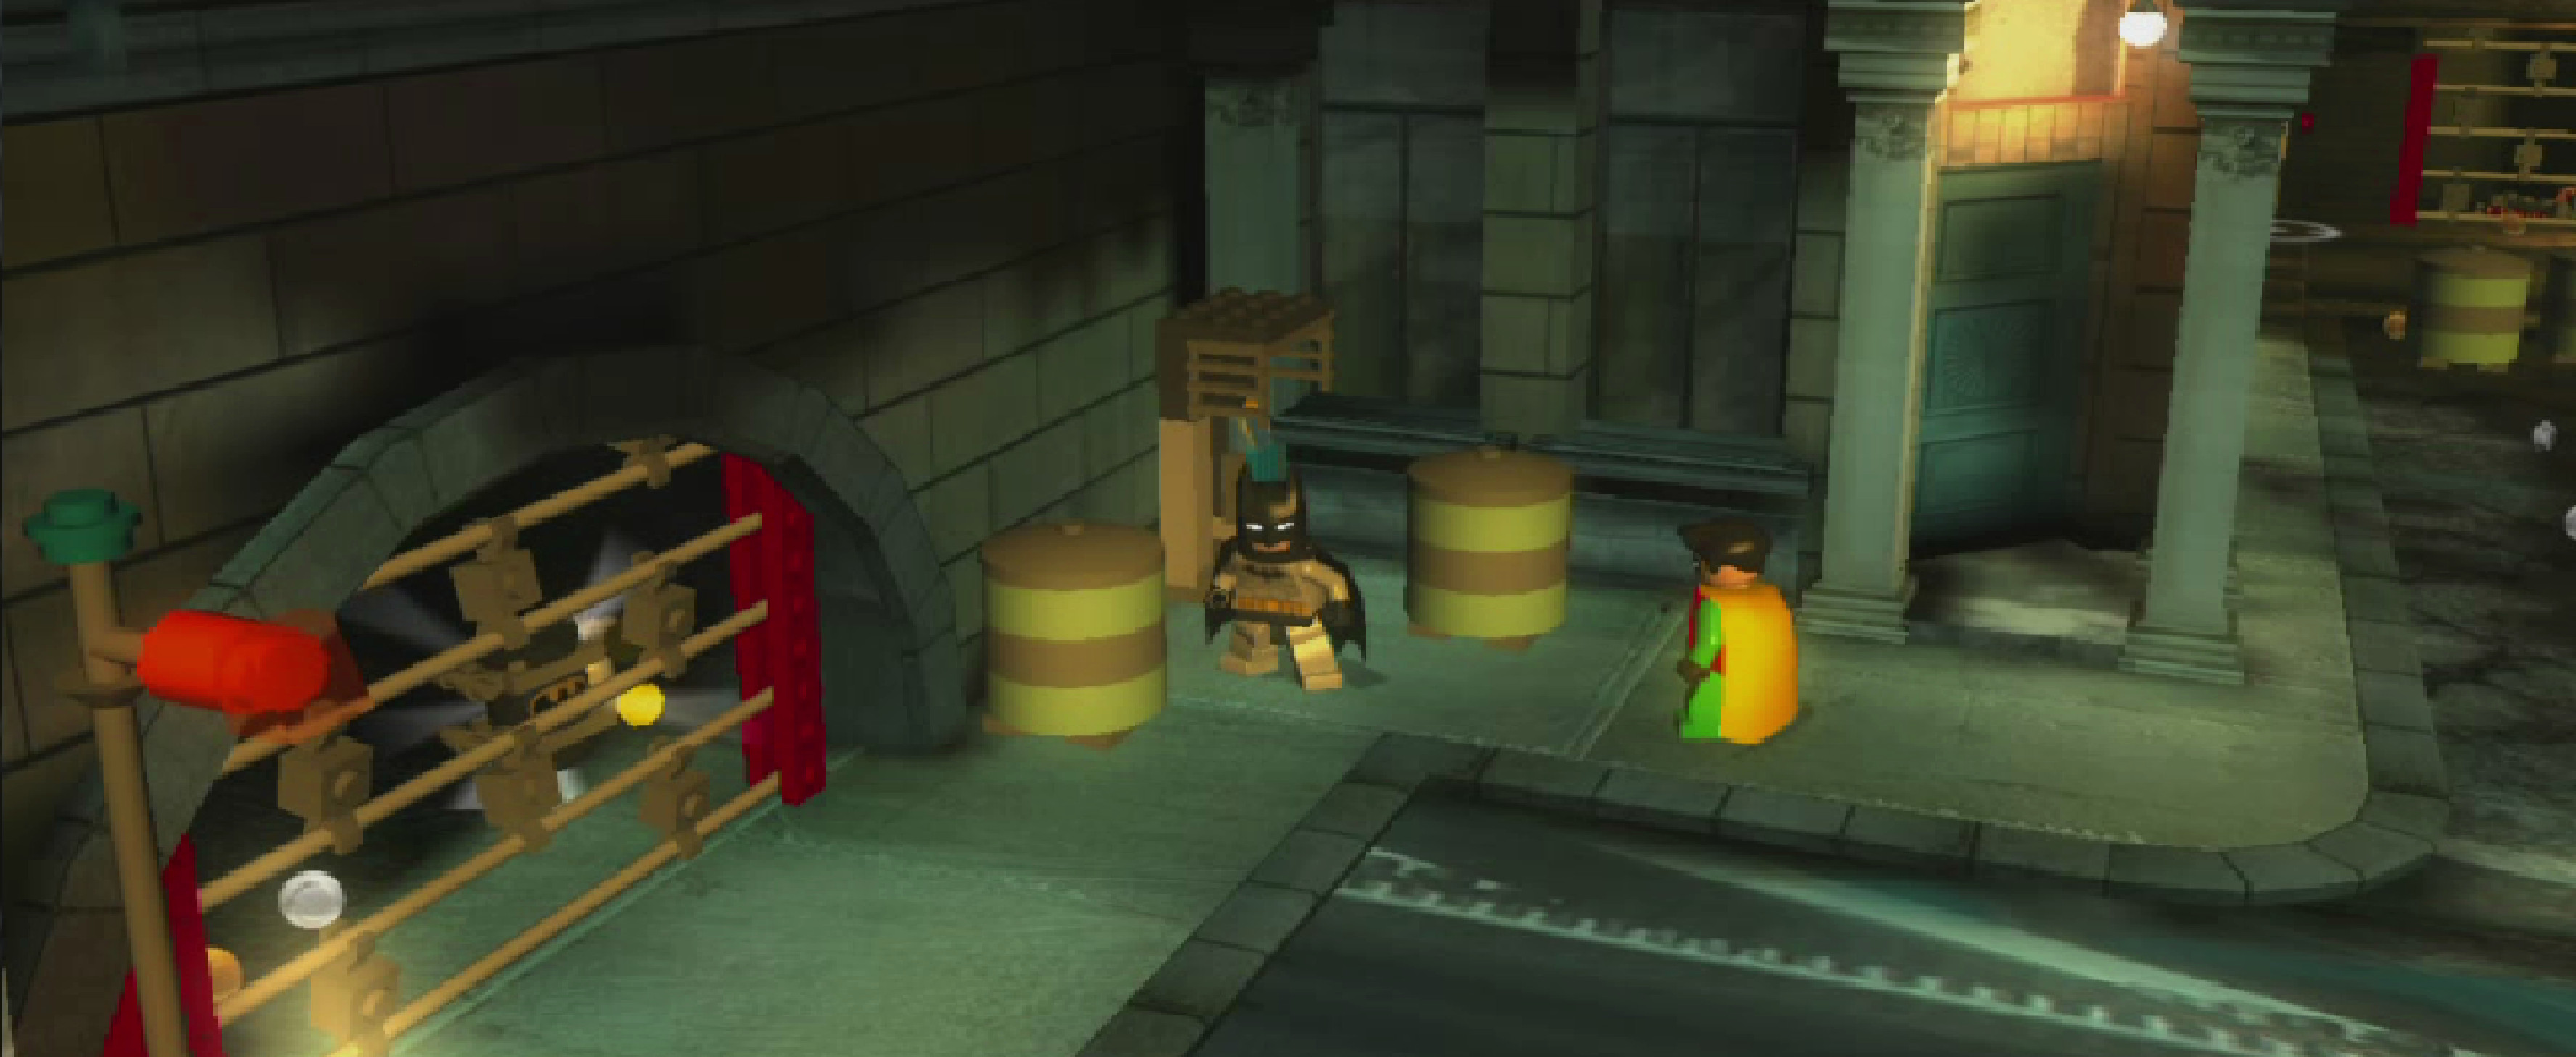
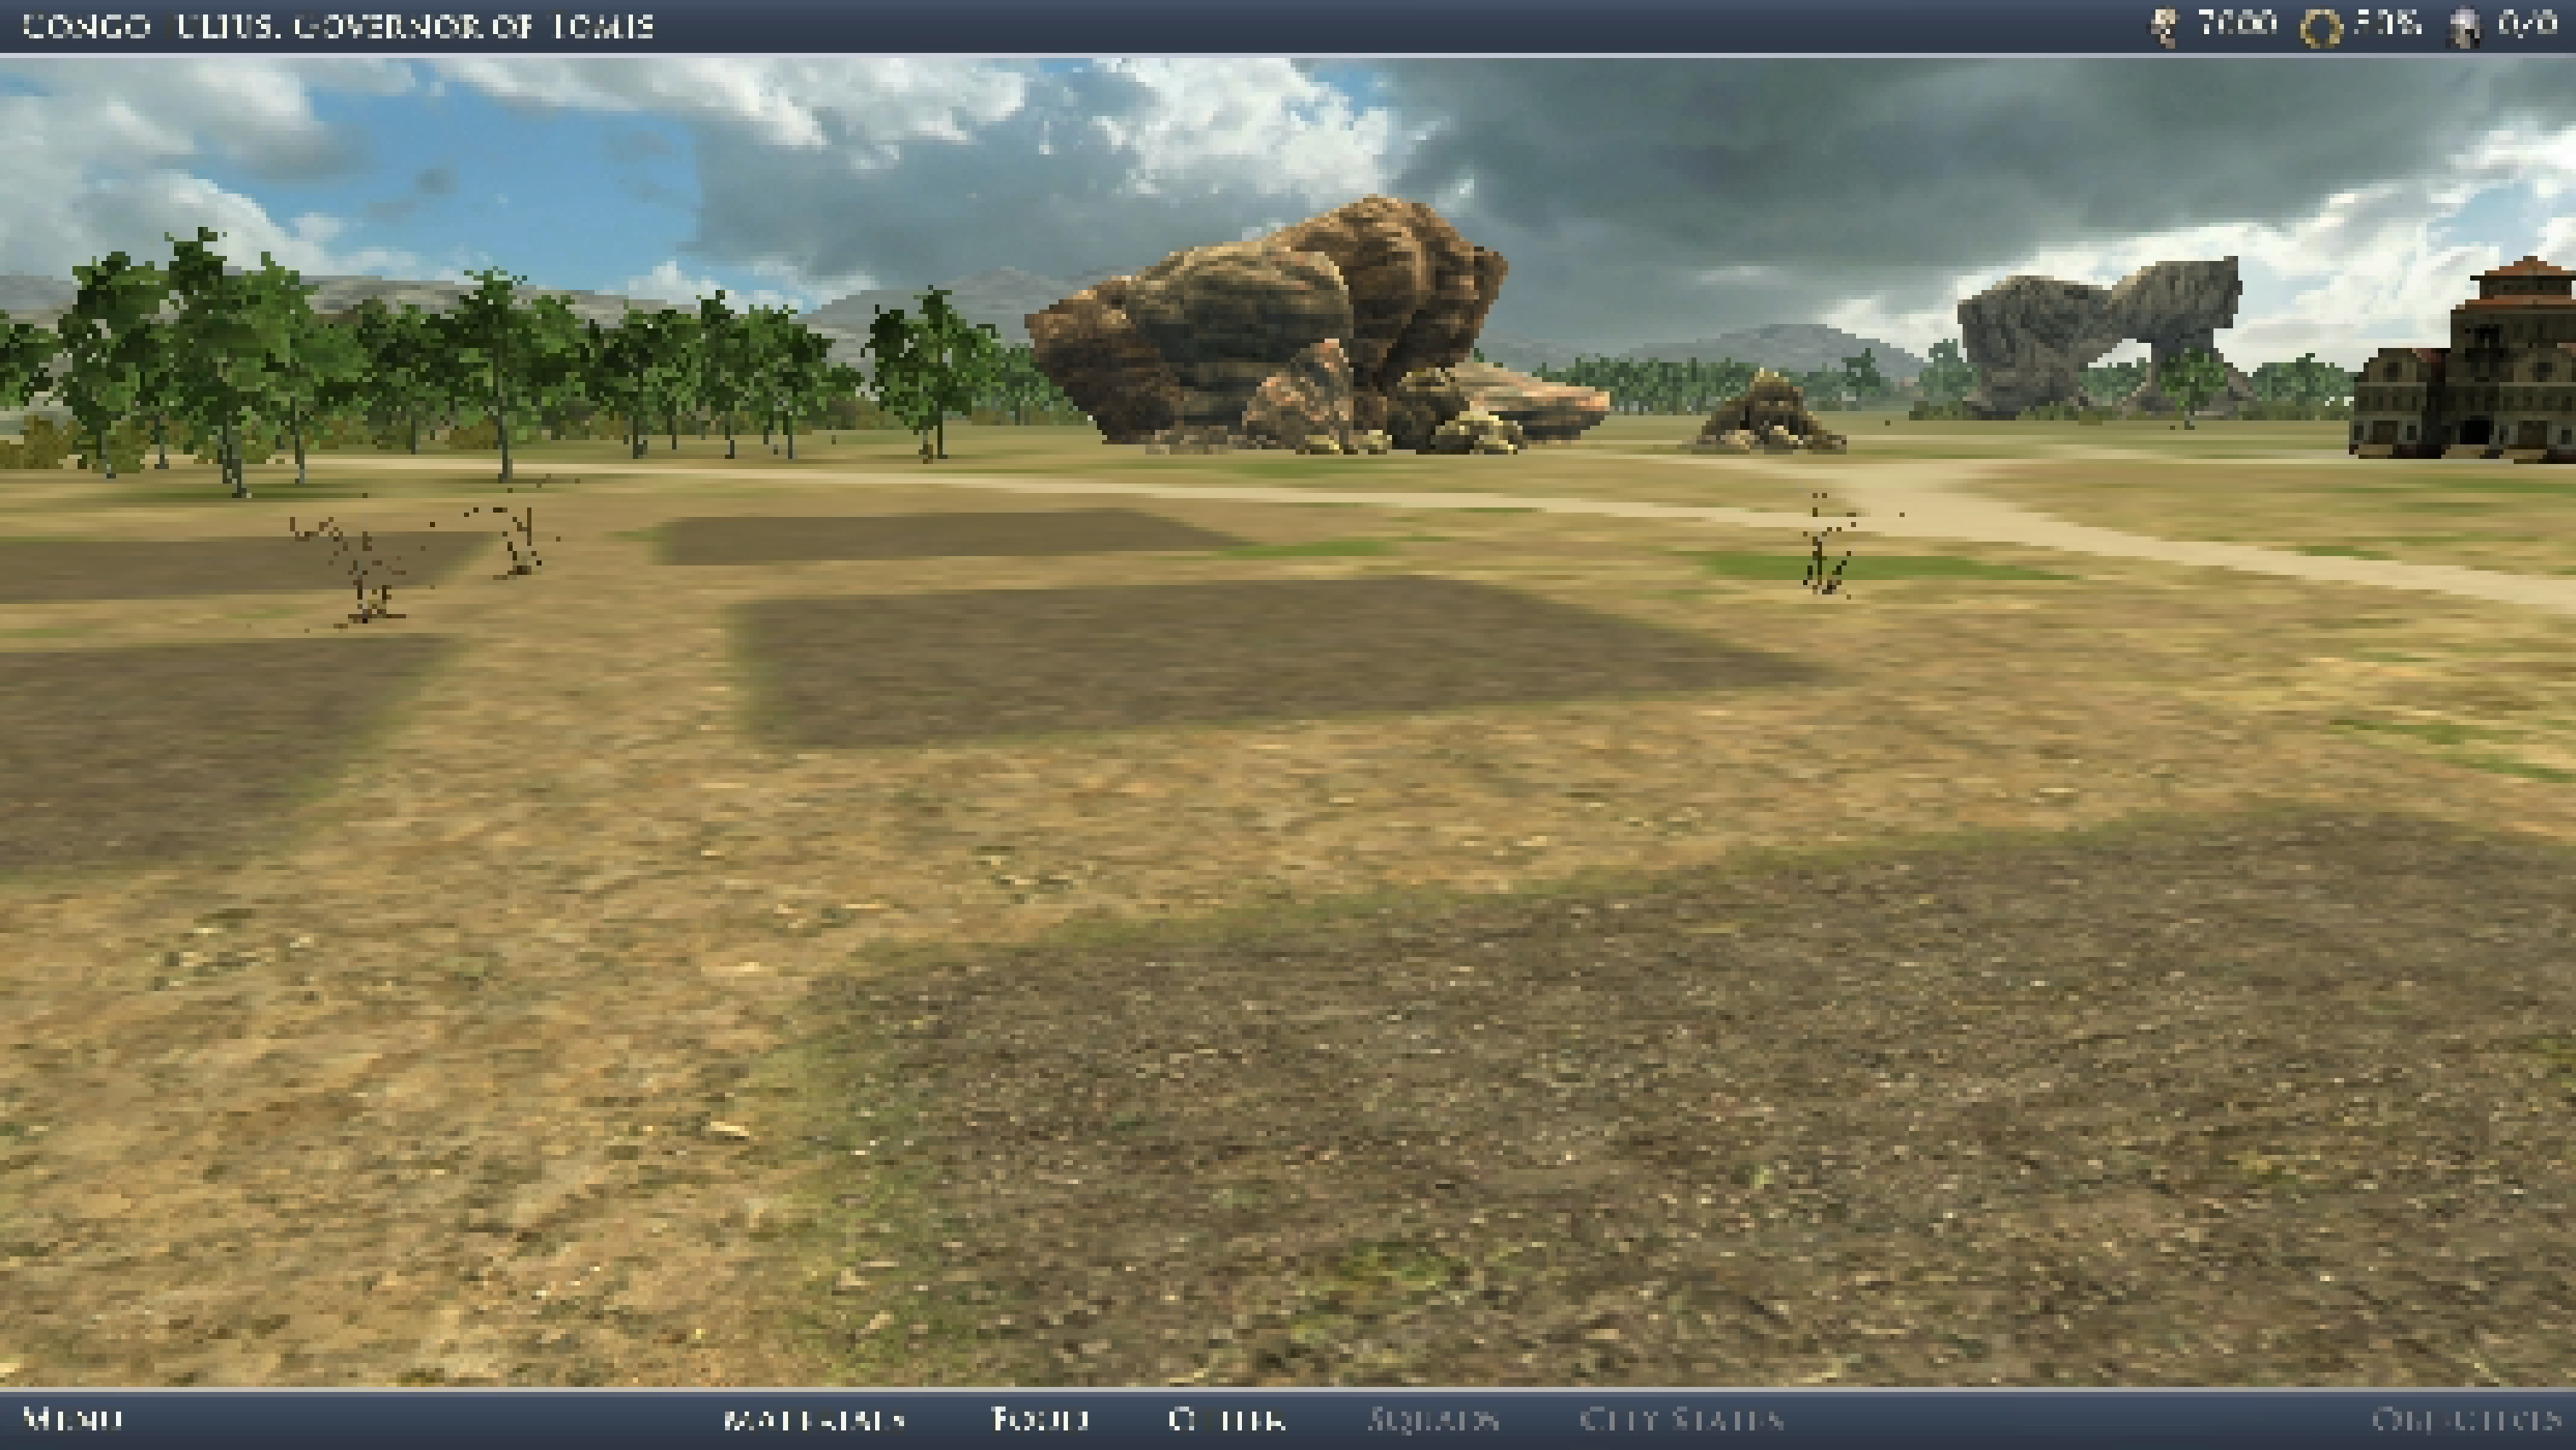
(e) Rome, normal, entropy 2,760 bytes
rome_simple.png 
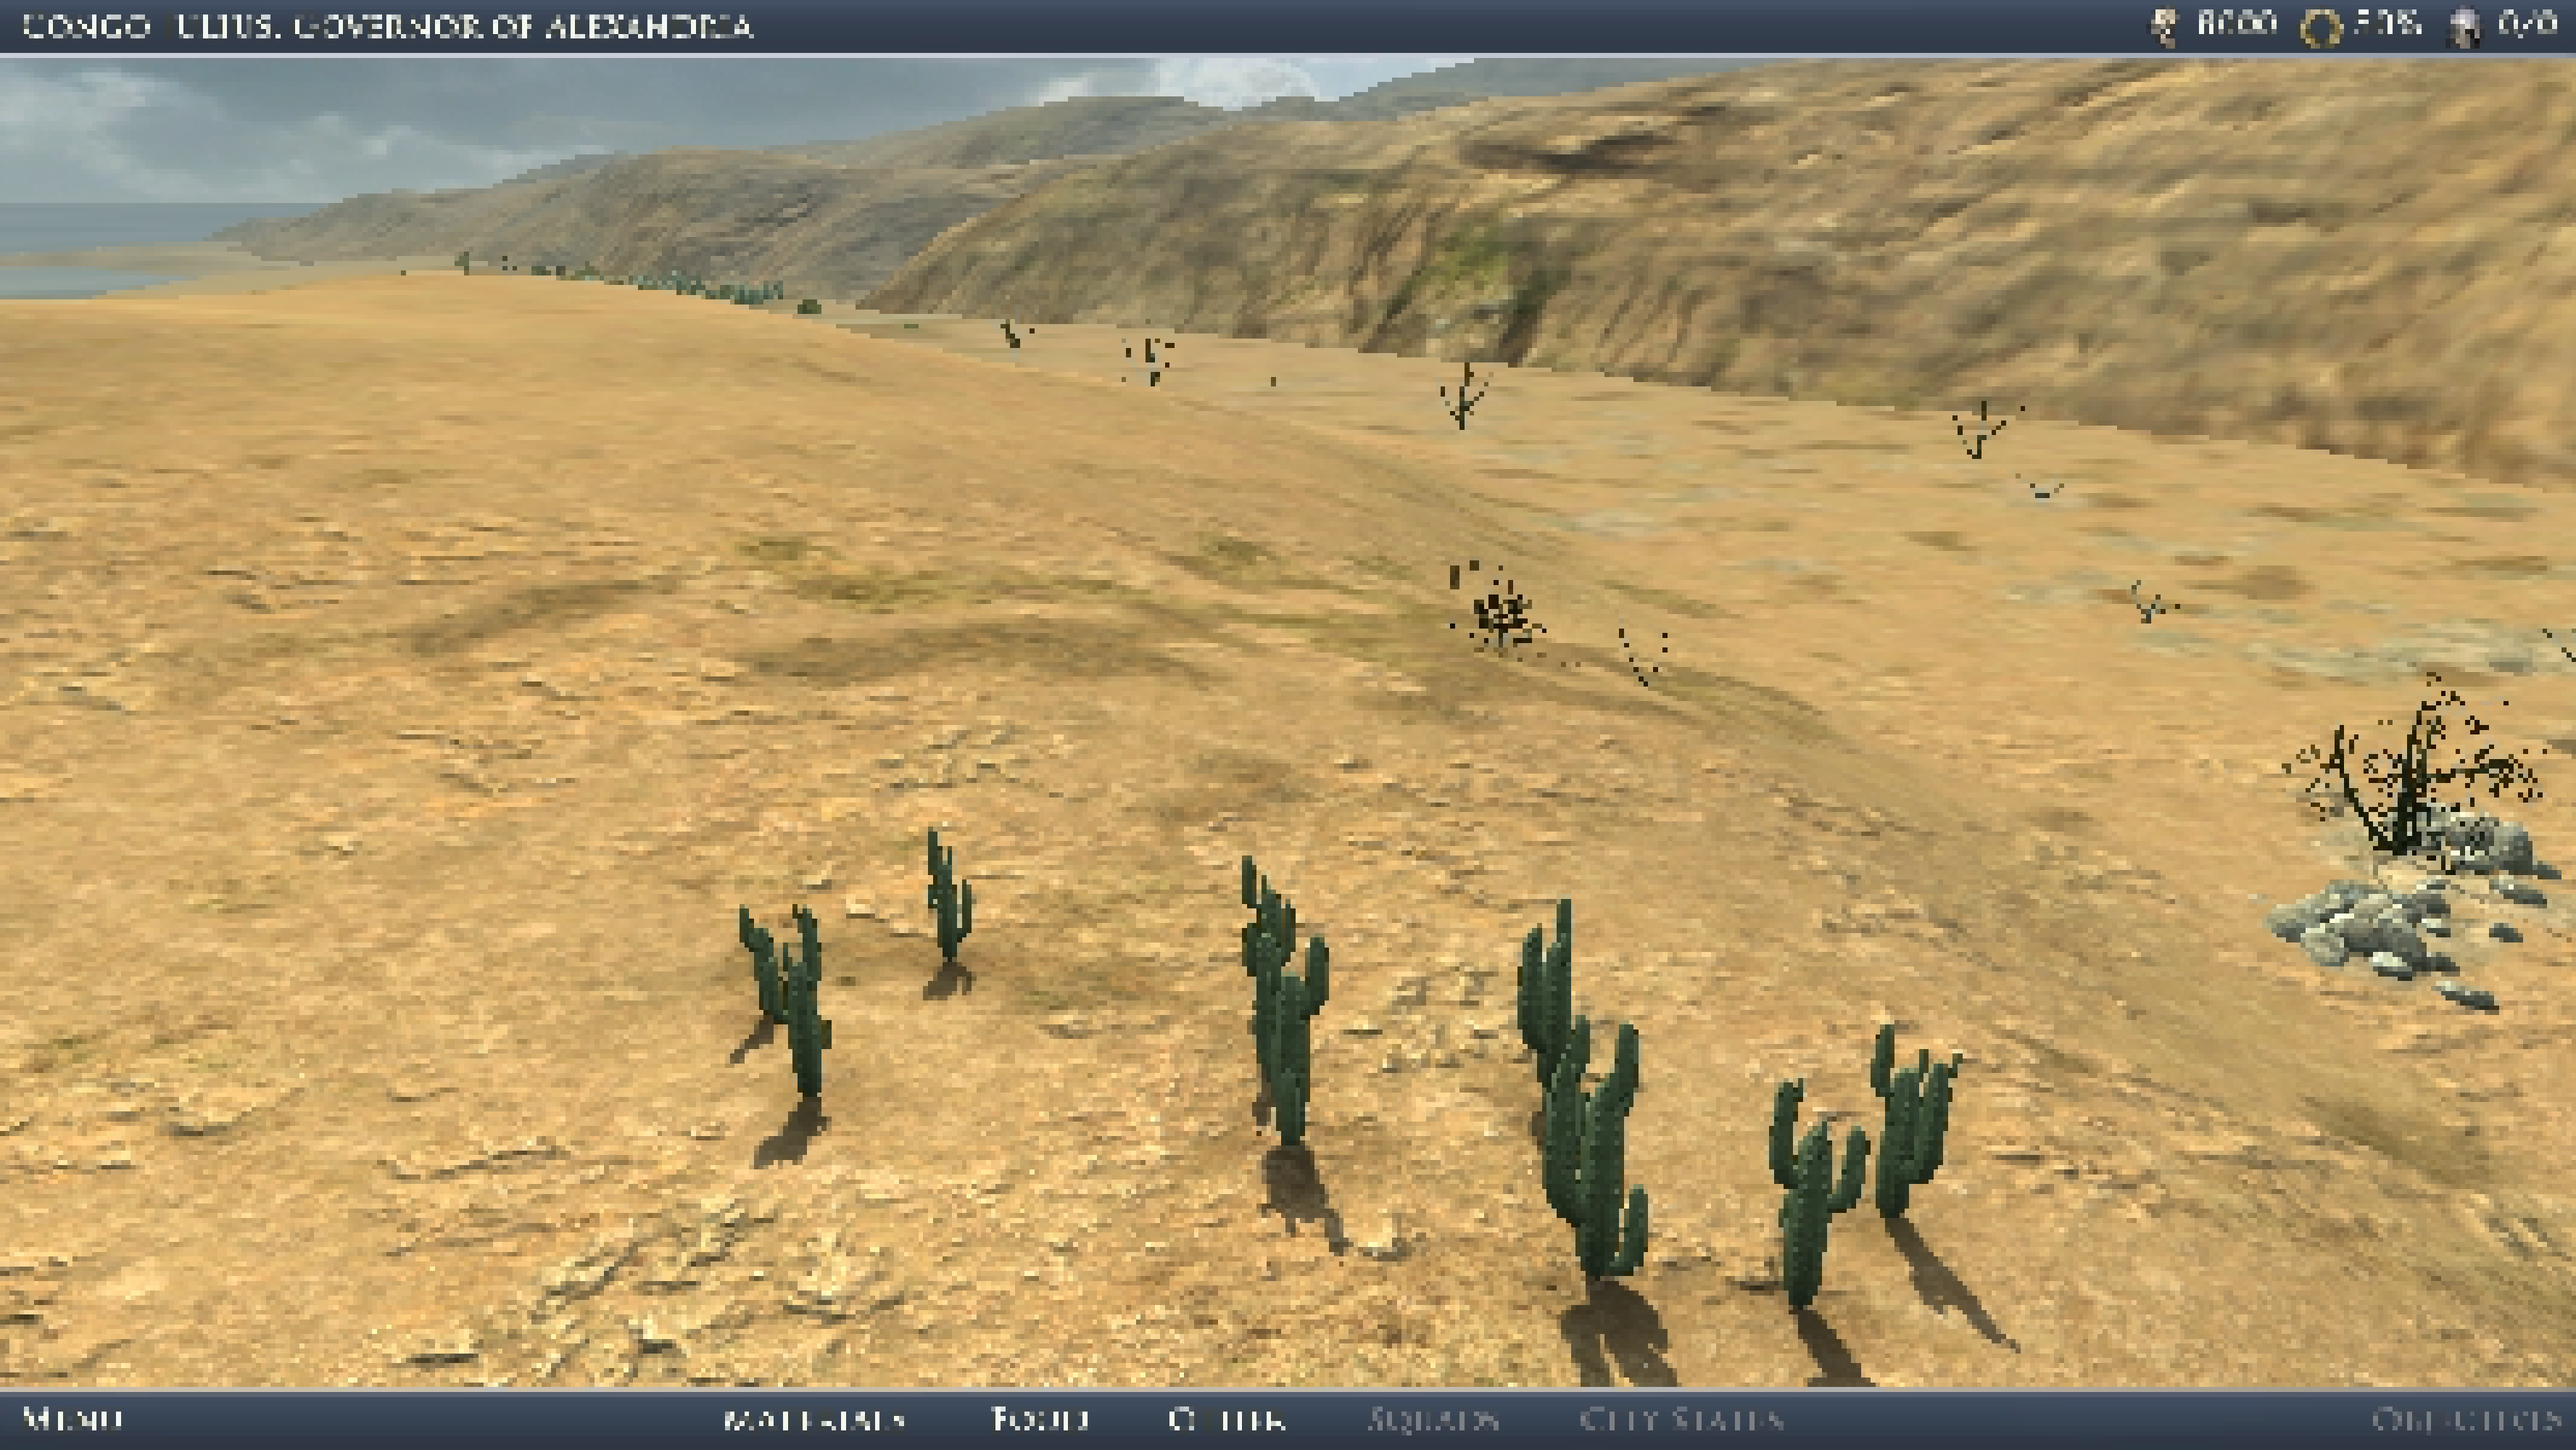
(f) Rome, simple, entropy 2,322 bytes
Figure 12: The screenshots of the considered game scenes with different scene complexity (entropy).
To quantify the scene complexity, we define entropy as the average frame size after compressing a raw video with a set of fixed, typical coding parameters. In particular, we use Fraps9 to capture game scenes and encode them into H.264 video files. We then divide the file size by the number of frames to derive the entropy. To cover a wide range of scene complexity, we consider two games, Rome and BioShock, and choose three scenes with different complexity levels: complex, normal, and simple. We record a one-minute video for each scene, and report the resulting entropy in Figure 10. This figure gives the screenshots and entropy of each scene, which reveals that the entropy drops from high to low complexity levels, while entropy of BioShock is much lower than that of DOW.
We plot the RDs of all the considered scenes in Figure 11. This figure shows that complex scenes indeed result in higher PDs and ODs, in both games. We then present the correlation between the entropy and PD/OD in Figure 12. This figure reveals a game-independent positive correlation between entropy and PD/OD. In summary, the scene complexity affects the processing, encoding, and decoding time in OnLive. Last, we note that our empirically observed relation between game category and scene complexity is consistent with Claypool [1], e.g., RTS games generally have higher scene complexity.

6.2  Impact of Update Region Sizes

scale_chart.png
Figure 13: Screenshots of area changes triggered by keystrokes in DOW and Rome.
We next study how the sizes of update regions affect the responsiveness. We consider two games, DOW and Rome, on both OnLive and SMG. We perform three game actions to generate different sizes of update regions.
  1. Scene change: A mouse movement rotates the view point. The responsiveness of a scene change is defined as the time duration between the mouse movement and the screen rotation.
  2. Area change: A keystroke to show and hide specific GUI components. Figure 13 illustrates the screenshots of area changes in DOW and Rome, where about 7% of the screen is affected by the area changes in both games. The responsiveness of an area change is defined as the time duration between pressing the key and changing the pixels in the updated area.
  3. Cursor movement: Move the mouse cursor across the screen. The responsiveness of a curve movement is defined as the time between the mouse movement action and the actual cursor movement on screen.
We plot the RDs of DOW and Rome with different sizes of update regions in Figure 14. We first discuss the results from OnLive. The PDs of cursor movements are short, and those of scene changes are 6 times longer. The PDs of area changes are between those of scene changes and cursor movements. On the other hand, the PDs of Rome are higher than those of DOW assuming a common size of update regions. This can be attributed to the transparent background of the area in Rome, which is quite challenging for video codecs. Similar observations can be made on the results from SMG, although PDs from SMG are higher while the variance of PDs across different update region sizes is small. In summary, the video coder used by OnLive is more advanced in the sense that it successfully leverages the inter-frame redundancy for shorter PDs.

6.3  Impact of Screen Resolutions

Since OnLive only supports 720p resolution, we only study how screen resolutions affect the responsiveness of SMG. We select two games: FEAR and Tomb, and choose three resolutions: 1280x720, 1024x768, and 640x480. We configure the games and SMG to use the same resolution to avoid any unnecessary up/down-sampling. We plot the RDs of all games and resolutions in Figure 15. This figure shows that smaller resolutions lead to shorter PDs, which is inline with the intuition. However, the difference of PDs is negligible, e.g., only 5% between 640x480 and 1280x720 in FEAR. Moreover, we see no consistent correlation between resolutions and ODs. These two observations indicate that some common processing overhead of SMG dominates the responsiveness, so that the impact of resolutions on RDs is minimal.

6.4  Impact of Computation Power

We study the impact of the server computation power on the responsiveness of SMG. We do not consider OnLive because we have no access to OnLive servers. We set up four SMG servers with different CPUs: 1) Intel Core i7-920 2.6GHz, 2) Intel Core i5-760 2.8GHz, 3) Intel Core 2 Quad Q6600 2.4GHz, and 4) AMD Athlon 64 4200+ 2.2GHz. We configure the four servers to have the same memory size, disk model, and graphics card (NVIDIA GeForce GTX 275 with 896 MB video RAM). We use FEAR in this study.
We rank the computational power of the CPUs using PassMark10, a popular benchmark index provided by the PerformanceTest software. The benchmark scores indicate that Intel Core i7-920 is the most powerful CPU, Intel Core i5-760 is the second, Intel Core 2 Quad Q6600 is the third, and AMD Athlon 64 4200+ is the least. We plot the PDs corresponding to different CPUs, and the correlation between the PDs and the CPU benchmark scores in Figure 16. This figure shows that: 1) PD linearly decreases on the less powerful servers and 2) there is a linear correlation between PD and benchmark score.
scale_delay.png
Figure 14: The response delays (without NDs) of different update region sizes of DOW and Rome on OnLive and SMG.
res_delay.png
Figure 15: The response delays (without NDs) of different screen resolutions from FEAR and Tomb in SMG.
cpu_delay.png
Figure 16: Left: the processing delays of scenes with different computational power. Right: the correlation between the processing delay and the benchmark score.
graphic_flow_chart_v3.png
Figure 17: Successive screenshots with timestamps where the avatar jumps or walks to the certain position in Batman and Braid.

7  Quantifying Streaming Quality

In this section, we quantify the game streaming quality of OnLive and SMG via measuring the frame rate and graphic quality under various network conditions.

7.1  Methodology

We configure dummynet on the router (see Figure 2) to control the following three network conditions. Since the OnLive server is approximately 130 ms away from our client, the evaluation for OnLive with 0 ms network delays is not available. Other than that, the distance of the OnLive server does not pose problems because the network quality between the OnLive server and our client is fairly good, and the bandwidth between them is more than sufficient. Moreover, for fair comparisons, the screen resolution of games is set to 1280x720 (720p) in both OnLive and SMG. We choose two ACT games, Batman and Braid, which allow us to repeat certain game scenes exactly while performing certain avatar actions. We control the avatars in both games to repeatedly and unstoppedly jump (in Batman) and run (in Braid) in a preselected scene for five minutes. This allows us to duplicate identical avatar appearances and game scenes in different runs under various network conditions for fair comparisons.
fr_all.png
Figure 18: The frame rates of game screens under different network conditions.
all_barplot_ssim.png
Figure 19: The graphic quality degradation with different network conditions in Batman and Braid on OnLive and SMG.
onlive_normal.png 
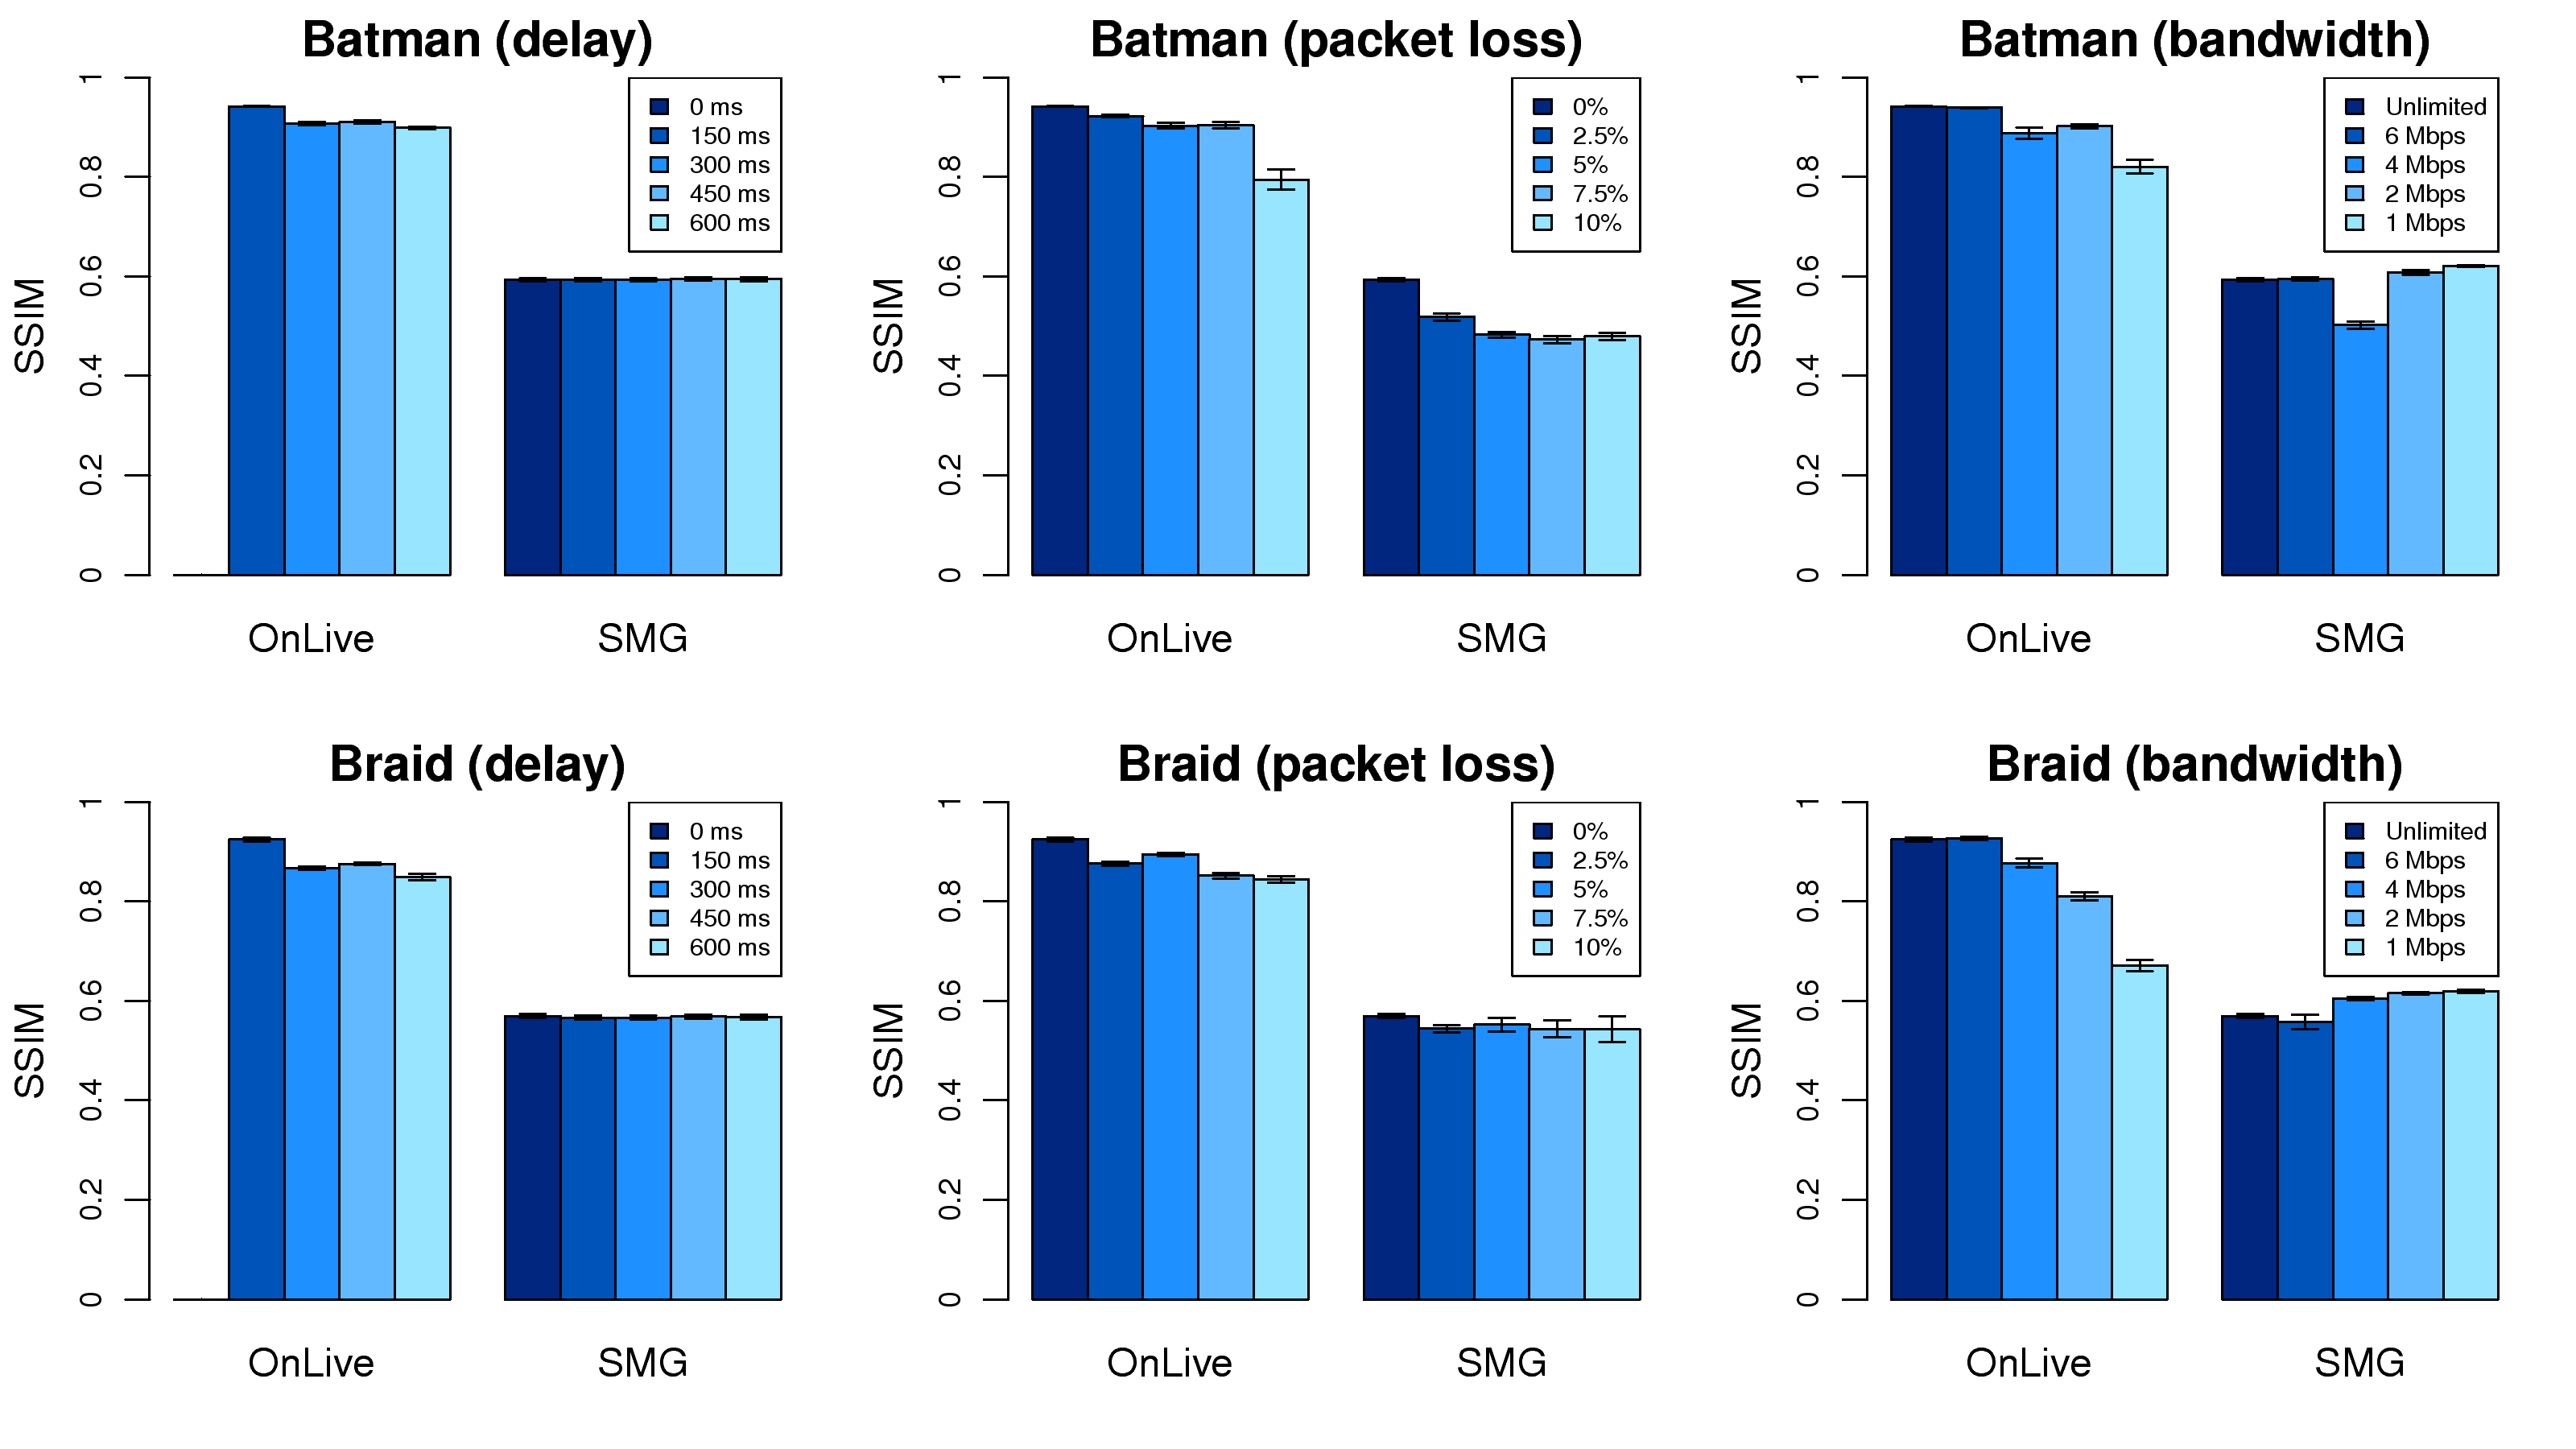
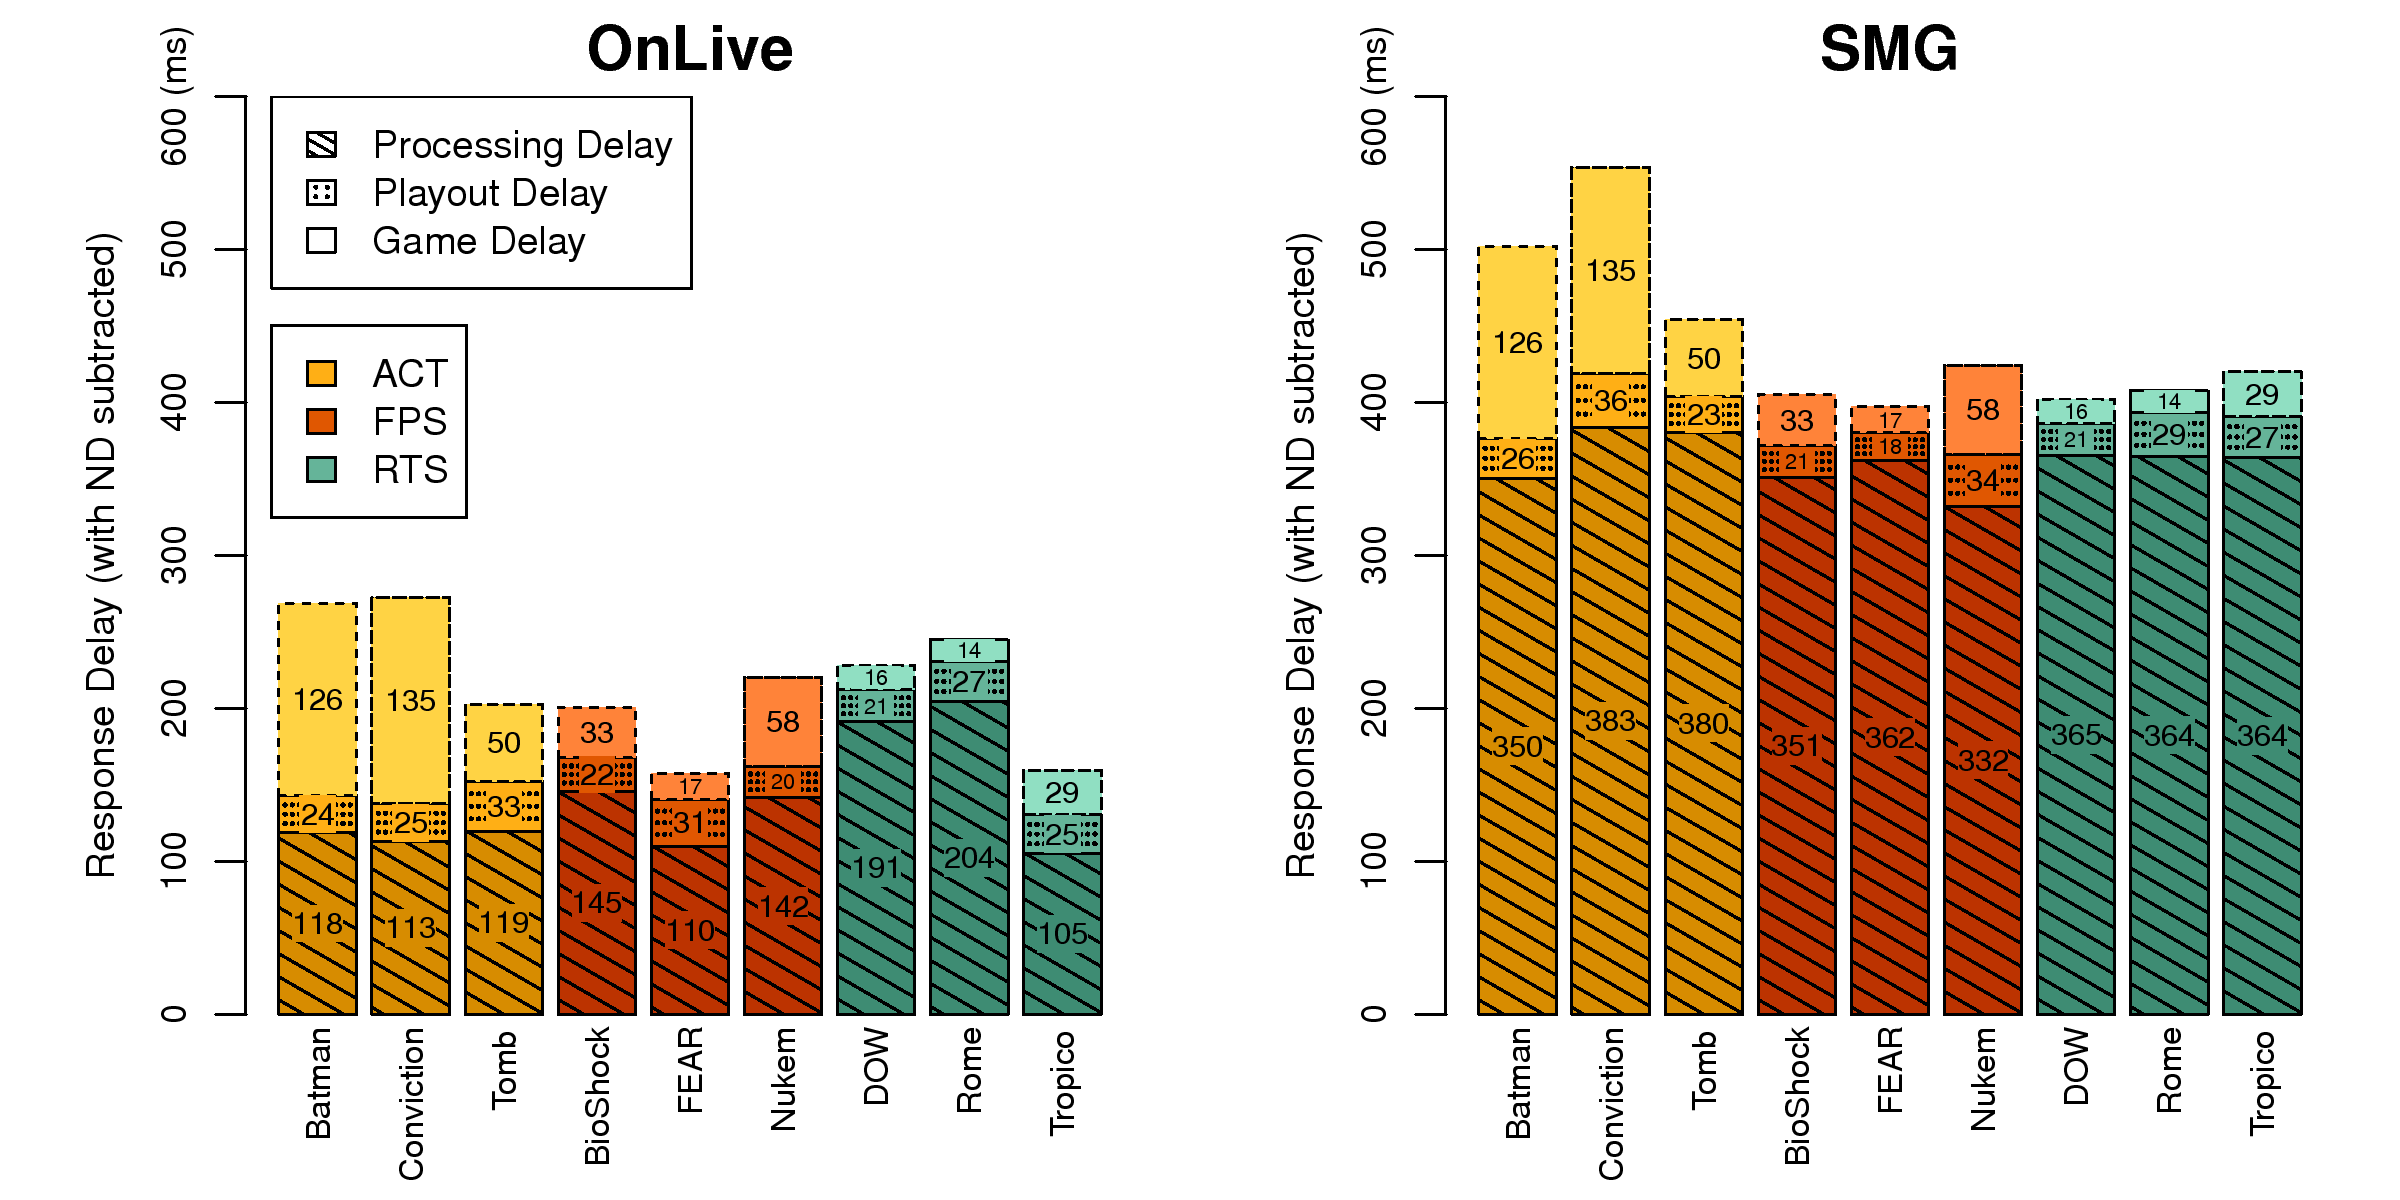
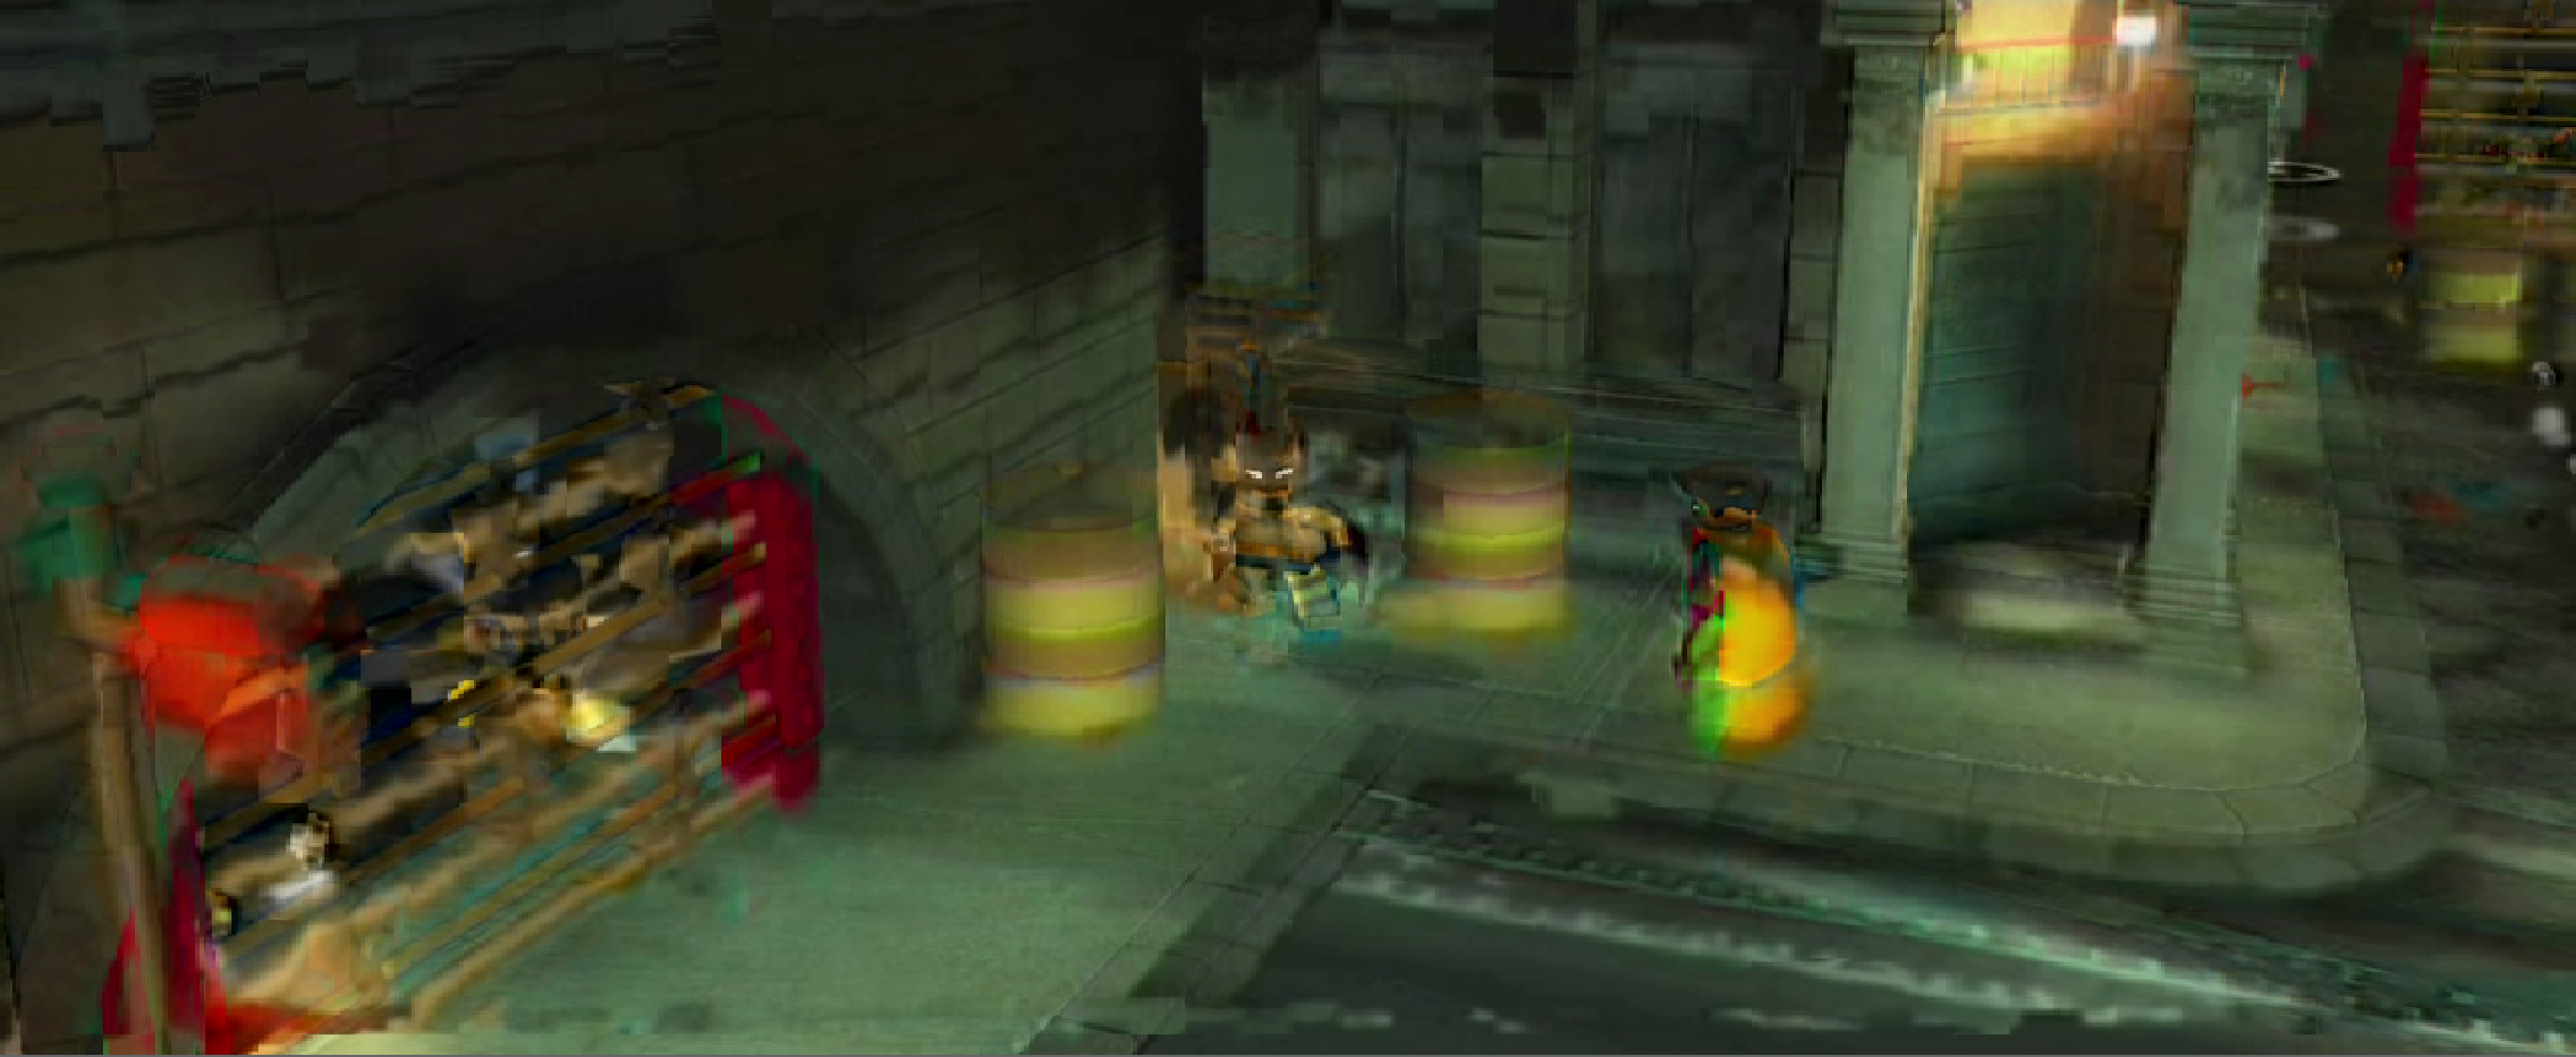
(a) OnLive, no degradation, SSIM 0.94
onlive_bw2000.png 
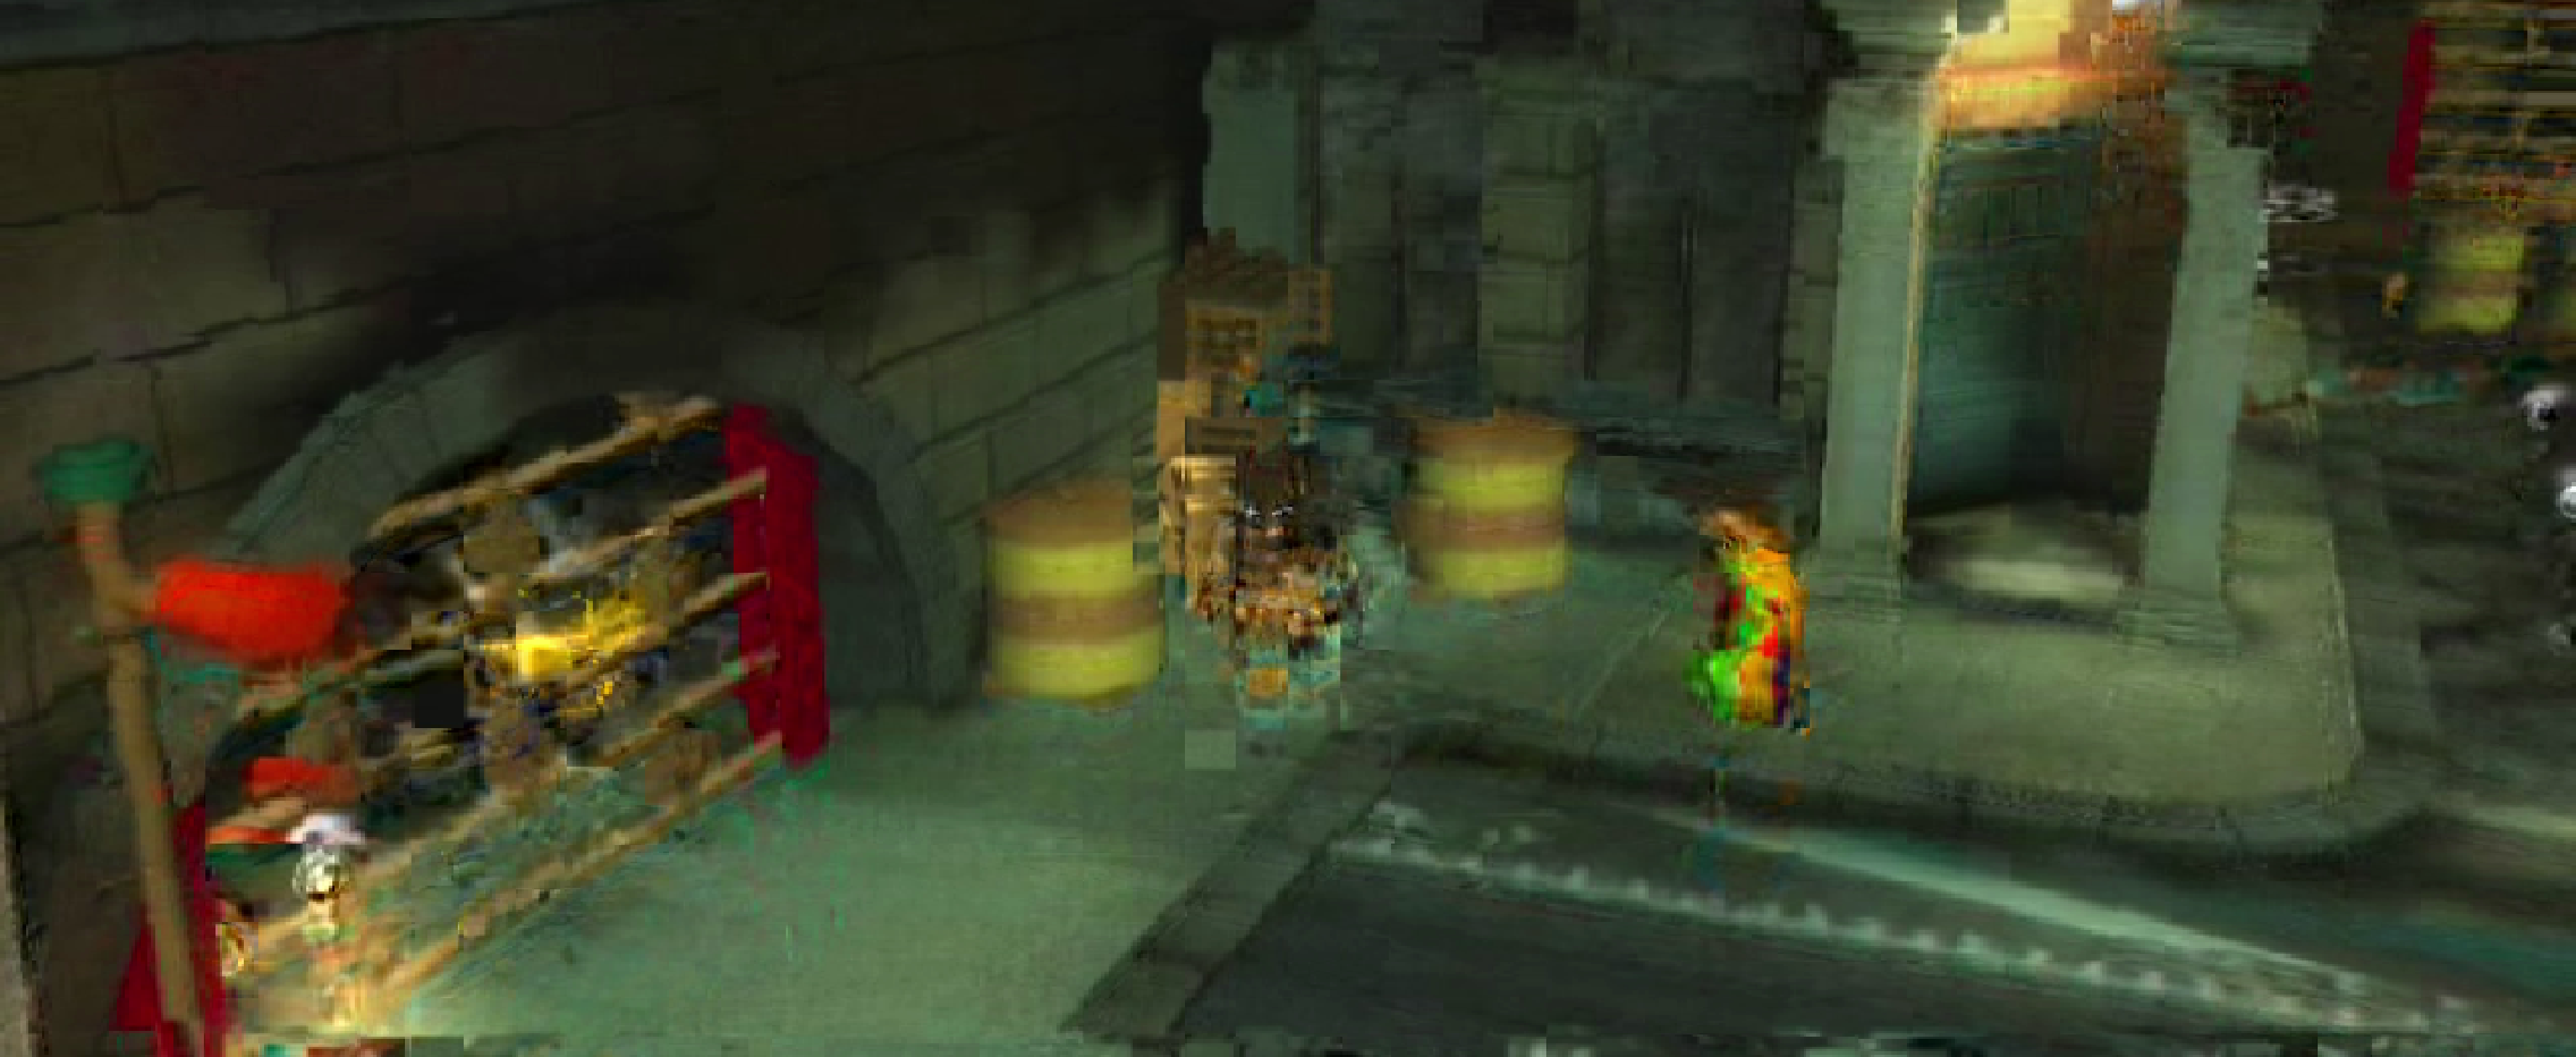
(b) OnLive, bandwidth 4 Mbps, SSIM 0.89
onlive_loss010.png (c) OnLive, packet loss rate 10%, SSIM 0.79
smg_normal.png (d) SMG, no degradation, SSIM 0.59
smg_bw2000.png (e) SMG, bandwidth 4 Mbps, SSIM 0.50
smg_loss010.png (f) SMG, packet loss rate 10%, SSIM 0.48
Figure 20: The screenshots of the game scenes from cloud gaming systems under various network conditions.
The frame rate affects the playability and gaming performance [24], and we quantify the frame rates of the cloud gaming systems under different network conditions as follows. We obtain the frame rates of OnLive and SMG clients by hooking IDirect3dDevice9::EndScene() and IDirect3DSurface9::UnlockRect(), respectively. We then compute the average frame rates under diverse network conditions.
The graphic quality also affects the user experience, and we adopt SSIM [25] as the quality metric by comparing the decoded game screens of OnLive and SMG against those captured on the PC versions of the games. Moreover, we must ensure that the game screens under comparisons are semantically identical, i.e., with identical viewpoints, camera orientations, and avatar positions. To achieve this, we control the avatar to mechanically move in the games. In Batman, the avatar repeatedly jumps at the same location; in Braid, the avatar runs back and forth between two locations. We use Fraps to capture the game screens every 16 ms. We first record the game screens on a standalone PC and then do the same using OnLive and SMG clients under diverse network conditions. We also carefully timestamp the frames in the captured game screens for alignments. Last, we compute the average SSIMs between OnLive/SMG game screens and standalone PC game scenes.

7.2  Measurement Results

We plot the measurement results in Figures 18 and 19. We first observe that SMG achieves a unified frame rate: 25 fps under various network delay, while OnLive achieves lower frame rates when the network delay is longer. This observation reveals that OnLive implements an adaptive algorithm to adjust the frame rate based on the current network delay. Moreover, the network delay does not affect the graphic quality of SMG at all, and the network delay only marginally affects the graphic quality of OnLive. Nonetheless, the graphic quality of OnLive still outperforms that of SMG. We conclude that the two cloud gaming systems cope with network delays very well.
In contrast, the packet loss and bandwidth limitations impose negative impact on the frame rates in both OnLive and SMG. We observe that the frame rate drops linearly as the packet loss rate increases in both OnLive and SMG. This reveals that neither OnLive nor SMG implements strong concealment mechanisms against packet loss. We also observe that OnLive is more bandwidth efficient: OnLive achieves acceptable frame rates with bandwidth larger than 2 Mbps, while its frame rate with unlimited bandwidth is the same as that of 6 Mbps. In contrast, SMG suffers from zero fps under bandwidth less than 6 Mbps and 2 Mbps in Braid and Batman respectively.
Next, the packet loss and limited bandwidth lead to negative impacts on the graphic quality for both cloud gaming systems. We observe that the graphic quality of the games on both cloud gaming systems drops under high packet loss and limited bandwidth. Figure 20 illustrates the sample frames, which show that frames with packet loss and limited bandwidth are blurred and/or with visual artifacts. Moreover, SSIM indicates that OnLive provides better graphic quality under all the network conditions. Last, we observe that the graphic quality achieved by SMG under very low bandwidth raises a bit. However, such graphic quality increase does not reflect better user experience, as SMG's frame rate drops to almost zero when the network bandwidth is low.

8  Discussions

8.1  Vantage Point Problem

One may wonder whether the location of the OnLive client affects the measurements of server processing delay (PD) and client playout delay (OD). As long as the network between the OnLive server and client has stable network delay, sufficient bandwidth, and low packet loss rate, our measurement techniques yield accurate results regardless of the location of the client. The reason is that the network delay is measured continuously during the instrumentation process. Thus, unless the network delay is extremely variable, the most recent ping results can always be adopted for estimation of the RTT between the server and the client. The observed response delays can then be compensated (from Eq. (1)) without affecting the inference accuracy of the PD and OD.

8.2  Fair Comparisons

While the results illustrated in Section  V-D show that SMG's PD is approximately 3.5 times greater than that of OnLive (about 350 ms vs. 100 ms), one may suspect that SMG's QoS could be comparable to that of OnLive if a high-end machine is used for the SMG server. Here, we must remark that a "perfectly" fair comparison between OnLive and SMG is impossible because OnLive servers are proprietary and may be specially customized and tailored for cloud gaming whereas SMG is designed to run on commodity servers and PCs. According to the results in Section  VI-D, the PDs generated by SMG is linear in correspondence to the computation power of the CPUs on the server, and the SMG server equipped with the highest-end CPU (PassMark score 5520) yields merely 20% improvements in PD compared with the server with the lowest-end CPU (PassMark score 1146). Therefore, SMG's longer PD (comparing to OnLive) must be due to the nature of its architecture and/or implementation.

8.3  Methodology Generalizability

We have applied our measurement techniques on two sample cloud gaming systems with three popular categories of games. This demonstrates the generalizability of our measurement techniques to some extent. Our approach can be generally applied to other cloud gaming systems because it requires no access to any internals of the server and game software, nor any original uncompressed game screens from the cloud gaming systems. Moreover, the measurement techniques also assume no particular features of the games. We perform the measurements on Microsoft Windows in this work, but the instrumentation code can be implemented in other operating systems, such as Android and Mac OS. This is because binary-level function intercepting mechanisms are widely supported by modern operating systems.

9  Conclusion

In this paper, we have proposed a suite of measurement techniques for user-perceived QoS of proprietary and closed cloud gaming systems under diverse network conditions. We have applied the measurement techniques to two sample cloud gaming systems, OnLive and StreamMyGame, and conducted extensive experiments. Table IV summarizes the measurement results, which indicate that OnLive: 1) consumes less bandwidth, 2) achieves better responsiveness, and 3) is better optimized in terms of video coding. Our experiments demonstrate the effectiveness of the proposed measurement techniques.
Table 4: A brief comparison of OnLive and StreamMyGame
PlatformOnLiveStreamMyGame
Downlink Bit Rate 3-5 Mbps 9-18 Mbps
Downlink Payload Size 715-950 bytes 1370-1390 bytes
Processing Delay 105-205 ms 350-365 ms
Frame Rate 22-54 fps 0.2-25 fps
Graphic Quality SSIM=0.94 SSIM=0.59
Implications. The configurations of servers and the arrival patterns of users are heterogeneous and dynamic, which impose significant impacts on the QoS of cloud gaming systems. Such information, however, is highly confidential to commercial cloud gaming systems and client-side measurement techniques are crucial to quantify their QoS. Our proposed measurement techniques in this paper fill this critical gap and has a number of important implications to future cloud gaming research. First, the suite of measurement techniques serves a common tool for factually assessing the QoS of proprietary and closed cloud gaming systems, such as OnLive and GaiKai. For example, it allows users to ensure whether these systems perform as well as their operators claimed. The capability to dissect the delay components in a cloud gaming system is especially helpful for researchers to identify the weak components and isolate the key issues worth to address. More importantly, the measurement results will provide important reference for calibration and comparison when the research community and the industry are building in-house cloud gaming systems [8]. Moreover, the proposed techniques are able to provide needed figures, such as the maximum delay allowed and the provided graphic quality given any network condition, for research on the cloud gaming infrastructure provisioning, such as how to place servers across a number of data centers to provide satisfactory cloud gaming service in world-wide scale [26]. Last but not the least, the current article concentrates on small time-scale performance metrics from users' perspective. Quantifying large time-scale performance metrics from service providers' perspective is also useful, and developing measurement techniques for these metrics is part of our future plan.

Acknowledgement

This work was supported in part by the National Science Council of Taiwan under the grants NSC100-2628-E-001-002-MY3, NSC102-2219-E-019-001, and NSC102-2221-E-007-062-MY3.

References

[1] M. Claypool, "Motion and scene complexity for streaming video games," in Proceedings of the 4th International Conference on Foundations of Digital Games.    ACM, 2009, pp. 34-41.
[2] P. Ross, "Cloud computing's killer app: Gaming," Spectrum, IEEE, vol. 46, no. 3, p. 14, 2009.
[3] I. Nave, H. David, A. Shani, Y. Tzruya, A. Laikari, P. Eisert, and P. Fechteler, "Games@Large graphics streaming architecture," in IEEE International Symposium on Consumer Electronics 2008.    IEEE, 2008.
[4] A. Jurgelionis, P. Fechteler, P. Eisert, F. Bellotti, H. David, J. P. Laulajainen, R. Carmichael, V. Poulopoulos, A. Laikari, P. Perälä, A. De Gloria, and C. Bouras, "Platform for distributed 3d gaming," Int. J. Comput. Games Technol., vol. 2009, pp. 1:1-1:15, January 2009.
[5] D. De Winter, P. Simoens, L. Deboosere, F. De Turck, J. Moreau, B. Dhoedt, and P. Demeester, "A hybrid thin-client protocol for multimedia streaming and interactive gaming applications," in Proceedings of ACM NOSSDAV 2006.    ACM, 2006, pp. 15:1-15:6.
[6] O.-I. Holthe, O. Mogstad, and L. A. Rønningen, "Geelix livegames: remote playing of video games," in Proceedings of IEEE CCNC 2009.    IEEE Press, 2009, pp. 758-759.
[7] P. Eisert and P. Fechteler, "Low delay streaming of computer graphics," in Proceedings of IEEE ICIP 2008, 2008, pp. 2704-2707.
[8] C.-Y. Huang, C.-H. Hsu, Y.-C. Chang, and K.-T. Chen, "GamingAnywhere: An Open Cloud Gaming System," in Proc. of ACM MMSys 2013, February 2013.
[9] A. M. Lai and J. Nieh, "On the performance of wide-area thin-client computing," ACM Trans. Comput. Syst., vol. 24, pp. 175-209, May 2006.
[10] J. Nieh, S. J. Yang, and N. Novik, "Measuring thin-client performance using slow-motion benchmarking," ACM Trans. Comput. Syst., vol. 21, pp. 87-115, February 2003.
[11] A. Y.-l. Wong and M. Seltzer, "Evaluating windows NT terminal server performance," in Proceedings of USENIX Windows NT Symposium.    USENIX Association, 1999, pp. 15-15.
[12] K. Packard and K. Packard, "X window system network performance," in USENIX Annual Technical Conference, 2003.
[13] N. Tolia, D. Andersen, and M. Satyanarayanan, "Quantifying interactive user experience on thin clients," Computer, vol. 39, no. 3, pp. 46-52, 2006.
[14] T. Richardson, Q. Stafford-Fraser, K. Wood, and A. Hopper, "Virtual network computing," IEEE Internet Computing, vol. 2, no. 1, pp. 33-38, 2002.
[15] H. A. Lagar-Cavilla, N. Tolia, E. de Lara, M. Satyanarayanan, and D. O'Hallaron, "Interactive resource-intensive applications made easy," in Proceedings of the ACM/IFIP/USENIX 2007 International Conference on Middleware, 2007, pp. 143-163.
[16] Y.-C. Chang, P.-H. Tseng, K.-T. Chen, and C.-L. Lei, "Understanding The Performance of Thin-Client Gaming," in Proceedings of IEEE CQR 2011, May 2011.
[17] Y.-T. Lee, K.-T. Chen, H.-I. Su, and C.-L. Lei, "Are All Games Equally Cloud-Gaming-Friendly? An Electromyographic Approach," in Proceedings of IEEE/ACM NetGames 2012, Oct 2012.
[18] M. Claypool, D. Finkel, A. Grant, and M. Solano, "Thin to win? network performance analysis of the OnLive thin client game system," in ACM Workshop on Network and Systems Support for Games (NetGames), 2012, pp. 1-6.
[19] K.-T. Chen, Y.-C. Chang, P.-H. Tseng, C.-Y. Huang, and C.-L. Lei, "Measuring The Latency of Cloud Gaming Systems," in Proceedings of ACM Multimedia 2011, Nov 2011.
[20] GameStats. [Online]. Available: http://www.gamestats.com/index/gpm/pc.html
[21] M. Claypool and K. Claypool, "Latency and player actions in online games," Commun. ACM, vol. 49, pp. 40-45, November 2006.
[22] G. Hunt and D. Brubacher, "Detours: binary interception of win32 functions," in Proceedings of the 3rd conference on USENIX Windows NT Symposium - Volume 3, ser. WINSYM'99.    Berkeley, CA, USA: USENIX Association, 1999, pp. 14-14. [Online]. Available: http://dl.acm.org/citation.cfm?id=1268427.1268441
[23] S. G. Perlman and R. V. D. Laan, "System and method for compressing streaming interactive video," US Patent No. 2009/0119736A1, May 2009.
[24] K. Claypool and M. Claypool, "On frame rate and player performance in first person shooter games," Multimedia Systems, vol. 13, pp. 3-17, 2007.
[25] Z. Wang, A. Bovik, H. Sheikh, and E. Simoncelli, "Image quality assessment: from error visibility to structural similarity," IEEE Transactions on Image Processing, vol. 13, no. 4, pp. 600-612, April 2004.
[26] S. Choy, B. Wong, G. Simon, and C. Rosenberg, "The brewing storm in cloud gaming: A measurement study on cloud to end-user latency," in ACM Workshop on Network and Systems Support for Games (NetGames), 2012, pp. 1-6.

Footnotes:

1. Since February 2011, OnLive supports Apple iPad, but it only allows users to watch other users' game play as spectators.
2. The Windows hooking mechanism is invoked by calling the SetWindowsHookEx function. It is frequently used to inject code into other processes.
3. The 50-ms interval is chosen arbitrarily in order to leave a "safe zone" that ensures an updated frame will be blocked with a non-zero probability.
4. The one-second interval is chosen arbitrarily in order to determine whether or not the updated frame is blocked. Other values can also apply without affecting the measurement results.
5. In our experiment, a standard deviation of 20 ms is adopted, while other values of the same order of magnitude yield nearly identical estimation of t3.
6. Since network delay (ND) is independent to the cloud gaming systems, we exclude it from the following discussion.
7. The multi-tile technique is similar to the intra-refresh coding used in some H.264 codec implementations, such as x264 (http://www.videolan.org/developers/x264.html).
8. The PDs of SMG are equally long across all considered games. Hence we only analyze results from OnLive here.
9. http://www.fraps.com/
10. http://www.cpubenchmark.net/high_end_cpus.html


Sheng-Wei Chen (also known as Kuan-Ta Chen)
http://www.iis.sinica.edu.tw/~swc 
Last Update September 28, 2019