Tuning Skype's Redundancy Control Algorithm for User Satisfaction
Te-Yuan Huang, Kuan-Ta Chen, and Polly Huang
Department of Electrical Engineering, National Taiwan University
Institute of Information Science, Academia Sinica
Determining how to transport delay-sensitive voice data has long been a
problem in multimedia networking. The difficulty arises because voice and
best-effort data are different by nature. It would not be fair to give
priority to voice traffic and starve its best-effort counterpart; however,
the voice data delivered might not be perceptible if each voice call is
limited to the rate of an average TCP flow. To address the problem, we
approach it from a user-centric perspective by tuning the voice data rate
based on user satisfaction.
Our contribution in this work is threefold. First, we investigate how Skype, the largest
and fastest growing VoIP service on the Internet,
adapts its voice data rate (i.e., the redundancy ratio)
to network conditions. Second, by exploiting implementations of public
domain codecs, we discover that Skype's
mechanism is not really geared to user satisfaction. Third, based on a set of systematic experiments that quantify user satisfaction under different levels of packet loss and burstiness, we derive a concise
model that allows user-centric redundancy control.
The model can be easily incorporated into general
VoIP services (not only Skype) to ensure consistent
user satisfaction.
MOS, PESQ, Piggyback, QoE (Quality of Experience), QoS (Quality of Service),
VoIP
1 Introduction
Effective end-to-end transport of delay-sensitive voice data has long been a
problem in multimedia networking. Voice traffic, by nature, is high in data
rate and it is sensitive to network impairments. With the increase in
multimedia traffic on the Internet, a growing dilemma is that it would not
be fair to give priority to voice traffic and starve its best-effort
counterpart; however, the voice data delivered might not be perceptible if
each voice call is limited to the rate of an average TCP flow. To address
this problem, we approach it from a user-centric viewpoint by adapting the
sending rate of voice calls based on user satisfaction. Such a user-friendly
rate adaptation mechanism would also be congestion-friendly, although it is
not strictly TCP-friendly [7].
Adapting the voice sending rate is a subtle issue because users prefer calls
with a higher bit rate [5]. However, sending voice data
with an unnecessarily high bit rate could be a waste of network resources or
result in congestion, and that in turn could compromise the user's
experience. In July 2008, eBay announced that Skype had 338.2 million
registered users and earned US$136 million in revenue, representing
51% year-over-year
growth1. Skype, as
one of the largest and fastest growing VoIP services on the Internet, seems
to note the subtlety and does not indulge its voice data with unlimited
network bandwidth. Recently, Skype launched a very ambitious monthly plan
worldwide, which is expected to attract even more users and voice
transmissions from the traditional telephone services to the Internet. The
surge in demand raises an important question: How should Skype or
competing VoIP services adapt their voice sending rates to meet customers'
QoS expectations. To address this question, we investigate three issues:
(1) how Skype adapts its voice rate, (2) whether Skype's rate adaptation
mechanism is geared to user satisfaction, and (3) how Skype and any other
VoIP services should adapt their voice data rates to ensure consistent user
satisfaction.
Bonfiglio et al. [4] observed that Skype's voice data rate
is governed by three factors: the bit rate, the framing time, and
redundancy. Among them, the bit rate and framing time are determined by the
codec. Skype uses G.729 as the audio codec for SkypeOut (PC-to-PSTN) calls;
while for PC-to-PC calls, iSAC, an audio codec developed by Global IP
Solutions [9],
is used in most of the calls. In particular, G.729 provides a constant bit
rate (CBR) for voice data. Thus, the rate variation in SkypeOut calls is
the result of adapting redundancy to network conditions. Furthermore, we
found that the bit rate and framing time adaptation in calls using iSAC, the
popular variable bit rate (VBR) codec, is very likely implemented by the
codec developer [9], instead of Skype. Therefore, the only
parameter tuned by Skype is the redundancy factor.
Focusing on the rate adaptation issue at the redundancy control level, we
present our methodology for automatically identifying the redundancy ratio,
i.e., the percentage of packets piggyback a previous packet, in
general Skype calls, and derive the relationship between the redundancy
ratio and the network loss rate. The major findings are (1) Skype increases
the redundancy ratio as the network loss rate increases; however, (2)
Skype's control algorithm does not take the individual codec and packet loss
patterns (burstiness) into consideration. These findings indicate that,
although Skype's rate adaptation mechanism somehow addresses the subtle
relationship between sending rate and user satisfaction, there are yet
discrepancies towards consistent user satisfaction.
To address the problem, we adopt implementations of public domain codecs and
quantify user satisfaction, i.e., the mean opinion scores (MOS), for calls
under different levels of packet loss and burstiness. Our results suggest
that the adaptation policy should be codec-specific. To sustain the voice
quality at MOS value 3.3, more redundancy should be added to G.711 voice
calls than to those in G.729 calls. More redundancy should also be added
when the network loss is bursty. Therefore, given the desired MOS level, we
develop a model to tune the redundancy ratio based on the measured loss rate
and loss burstiness. This model can be easily implemented and used generally
by any VoIP service to provide consistent user satisfaction.
The remainder of this paper is organized as follows.
Section II contains a review of related works on Skype. In
Section III, we describe our experiment setup and methodology for
quantifying redundancy . In Section IV, we discuss
Skype's redundancy control algorithm. In Section V, we
describe the simulation setup and discuss the optimal policy for controlling
the amount of redundancy. Section VI details the simulation
results. Then, in Section VII we provide some conclusion
remarks.
2 Related Work
As the popularity of Skype has increased, a great deal of research has been
devoted to understanding the phenomenon. Some works have focused on the
design of Skype and the protocol used. For example, Baset et
al. [1] analyzed the operation of the peer-to-peer
infrastructure of Skype, while [2] performed detailed reverse
engineering of the protocol and packet format of Skype. Other works have
focused on identifying Skype traffic. For example, [19,[10]
focused on identifying relayed Skype traffic, [4] tried to
identify direct Skype sessions, and [21] proposed to detect Skype
flows based on the signaling traffic between a node and its supernodes. In
addition, [10] studied the behavior of Skype users, such as
their usage patterns, and the characteristics of Skype's supernodes, e.g.,
their bandwidth consumption.
The present study is closely related to two previous works.
In [5], the authors quantified the effect of network factors
on the level of user satisfaction in Skype VoIP calls. They analyzed the
relationship between network factors and the length of VoIP sessions, and
found that the bit rate, bit rate variation, and round trip time have the
most impact on user satisfaction. The same authors later proposed
OneClick[6], a lightweight framework for
measuring network applications' quality of experience from users'
perspective, in the hope to verify the passive measurement results by user
experiments. Bonfiglio et al. [3] analyzed how Skype adapts
its traffic to different network conditions. They found that when available
bandwidth is decreased, the bit rate and payload size of Skype traffic are
also decreased. On the other hand, when packet loss is detected, Skype
mitigates its impact by sending voice packets with redundancy. More
specifically, Skype adopts a piggyback technique, which appends previously
sent voice blocks to to-be-sent packets. The authors conducted a series of
experiments to evaluate Skype's redundancy control algorithm, and
demonstrated that the payload of some packets is doubled when artificial
packet losses are introduced. Moreover, as the loss rate increases, the
percentage of packets with a double payload size also increases. The
authors proposed a source traffic model of Skype. Based on the model,
Skype's traffic is decided by three parameters: 1) the bit rate used by the
codec; 2) \triangle T, the framing time of human speeches; and 3) the
redundancy factor, which is the percentage of previous voice frames
piggybacked by the current frame.
Inspired by Bonfiglio et al.'s work, we tried to determine whether Skype
adjusts the three parameters properly so that an optimal level of user
satisfaction can be achieved. To this end, we conducted some experiments
with the iSAC codec, an audio codec used by Skype, and found that the first
two parameters, i.e., the encoding bit rate and the speech framing time, are
controlled by the codec, and only the redundancy factor is controlled by the
Skype program. For this reason, we believe that Skype's redundancy control
mechanism might be the key to its good voice quality. Thus, in this work,
we address the following questions: 1) Is Skype's redundancy control
optimal?; 2) if it is not optimal, how should a VoIP application like
Skype adjust the redundancy ratio to achieve a balance between bandwidth
consumption and user satisfaction. We consider these two issues in the
following sections.
3 Estimating Skype's Redundancy Ratio
In this section, we describe our methodology for quantifying the
amount of redundancy Skype adds into its voice traffic.
3.1 Experiment Setup
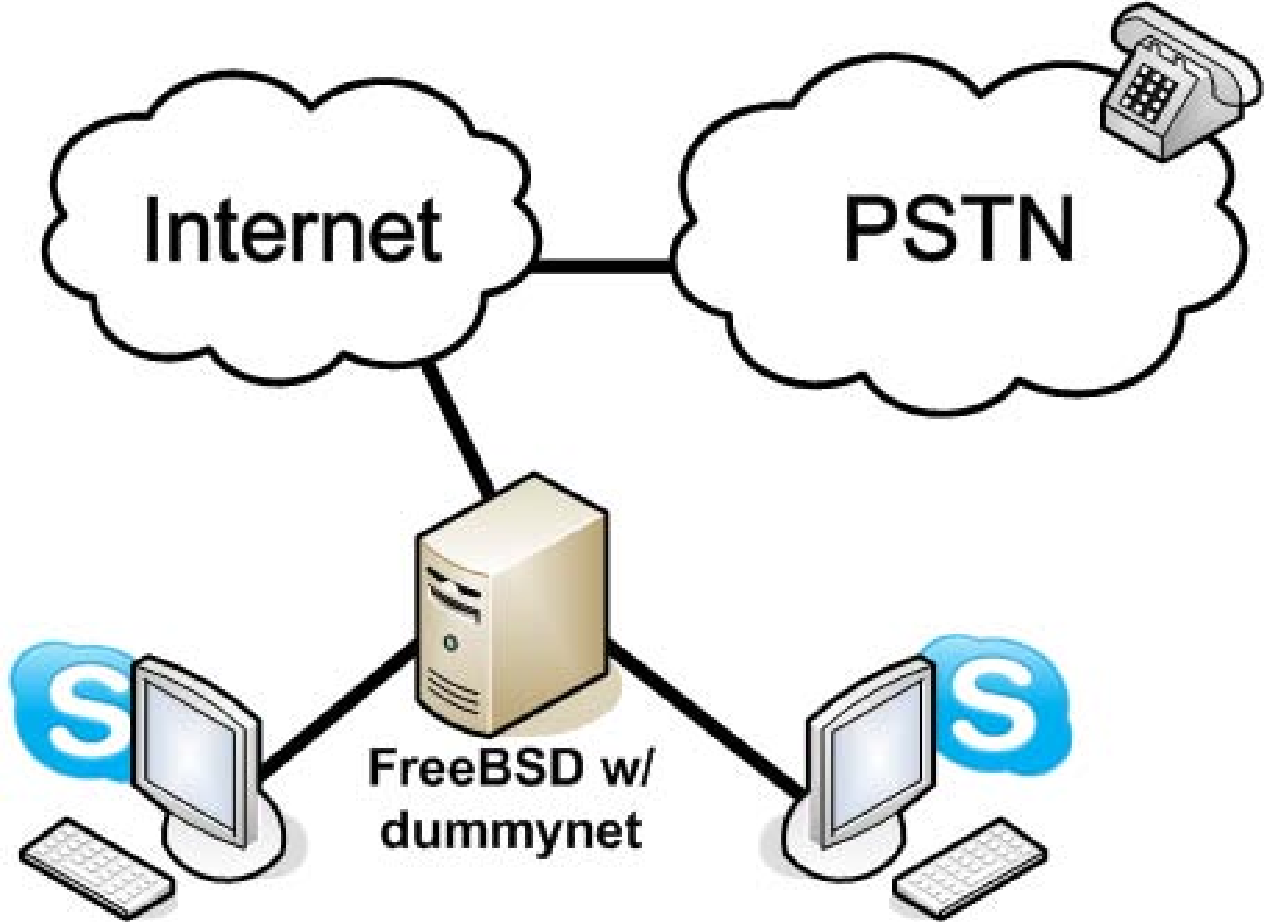
Figure 1: The network setup for collecting Skype
traffic.
(a) G.729
(b) iSAC
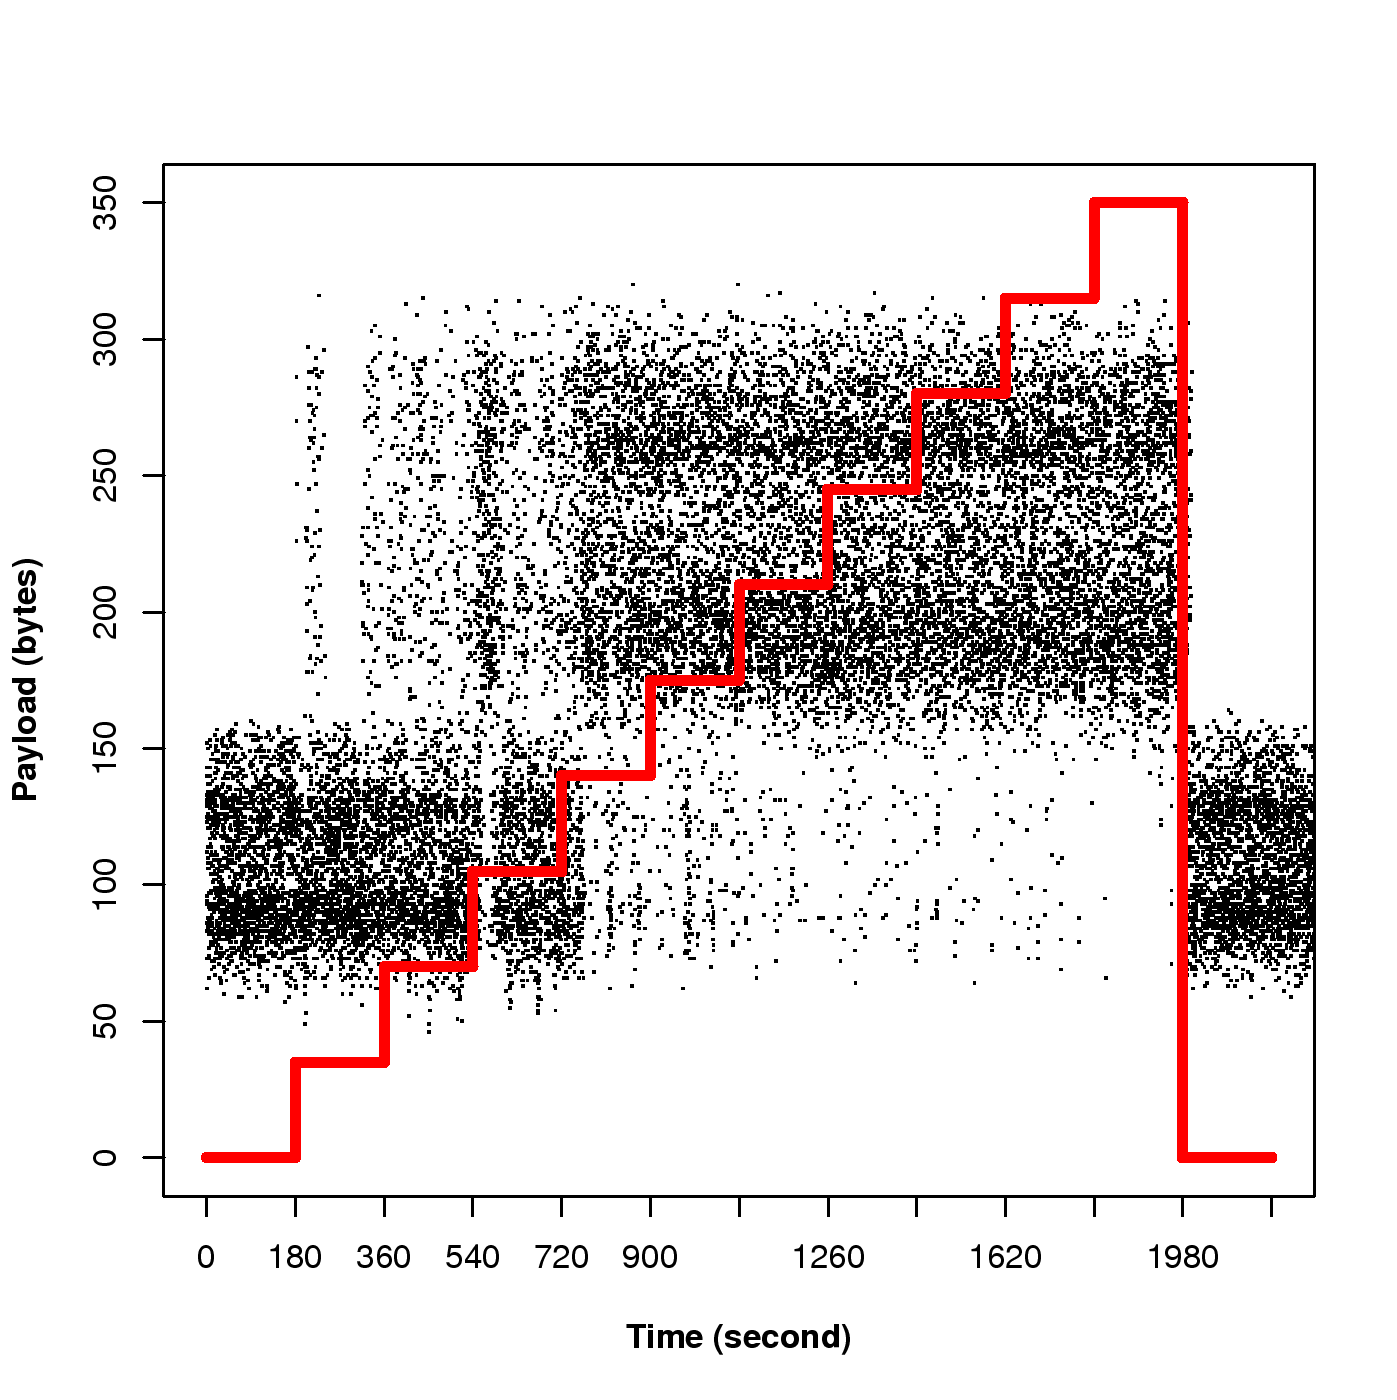
Figure 2: The impact of the network loss rate on the payload size of
Skype packets.
To collect Skype traces, we make Skype calls in a
controlled network environment, as shown in
Fig. 1. A FreeBSD box, which acts as a layer-2
bridge, is used to control the traffic passing through by
dummynet[17]. Skype is installed
on two Windows XP machines, which are connected to the
Internet through the FreeBSD box. To simulate human
conversation, audio files downloaded from the Open Speech
Repository [20] are played during the Skype VoIP
calls.
Skype can transmit its voice packets by either UDP or TCP.
Since TCP guarantees in-order and reliable transmission, there
is no need for Skype to add redundancy to TCP flows.
Therefore, only UDP flows are the subjects of the present study. To
increase the probability that Skype transmits voice traffic using
UDP, each Windows XP machine is assigned a public IP
address [1]. Since version 3.2, Skype adopts an in-house
developed audio codec, SVOPC [16]; thus,
we use different versions of Skype for experiments on different codecs.
We use Skype version 3.1 for experiments on iSAC and SkypeOut, and use version 3.8 for experiments on SVOPC. For both versions
of Skype, the codec G.729 is used for SkypeOut sessions.
We collect Skype traces on the FreeBSD box with the program
tcpdump[15]. In addition, to avoid the interference caused by initial
setup traffic, we only record the traffic after the call has been
established for 60 seconds. In each experiment, we increase
the network loss rate from 0% to 10% in 1%
increments every 180 seconds. For the iSAC traces,
we filter out the control and signaling packets by inspecting
the "Start of Message" (SoM) field, which contains the
message ID and the function of the packet [2].
3.2 Observations
(a) G.729
(b) iSAC
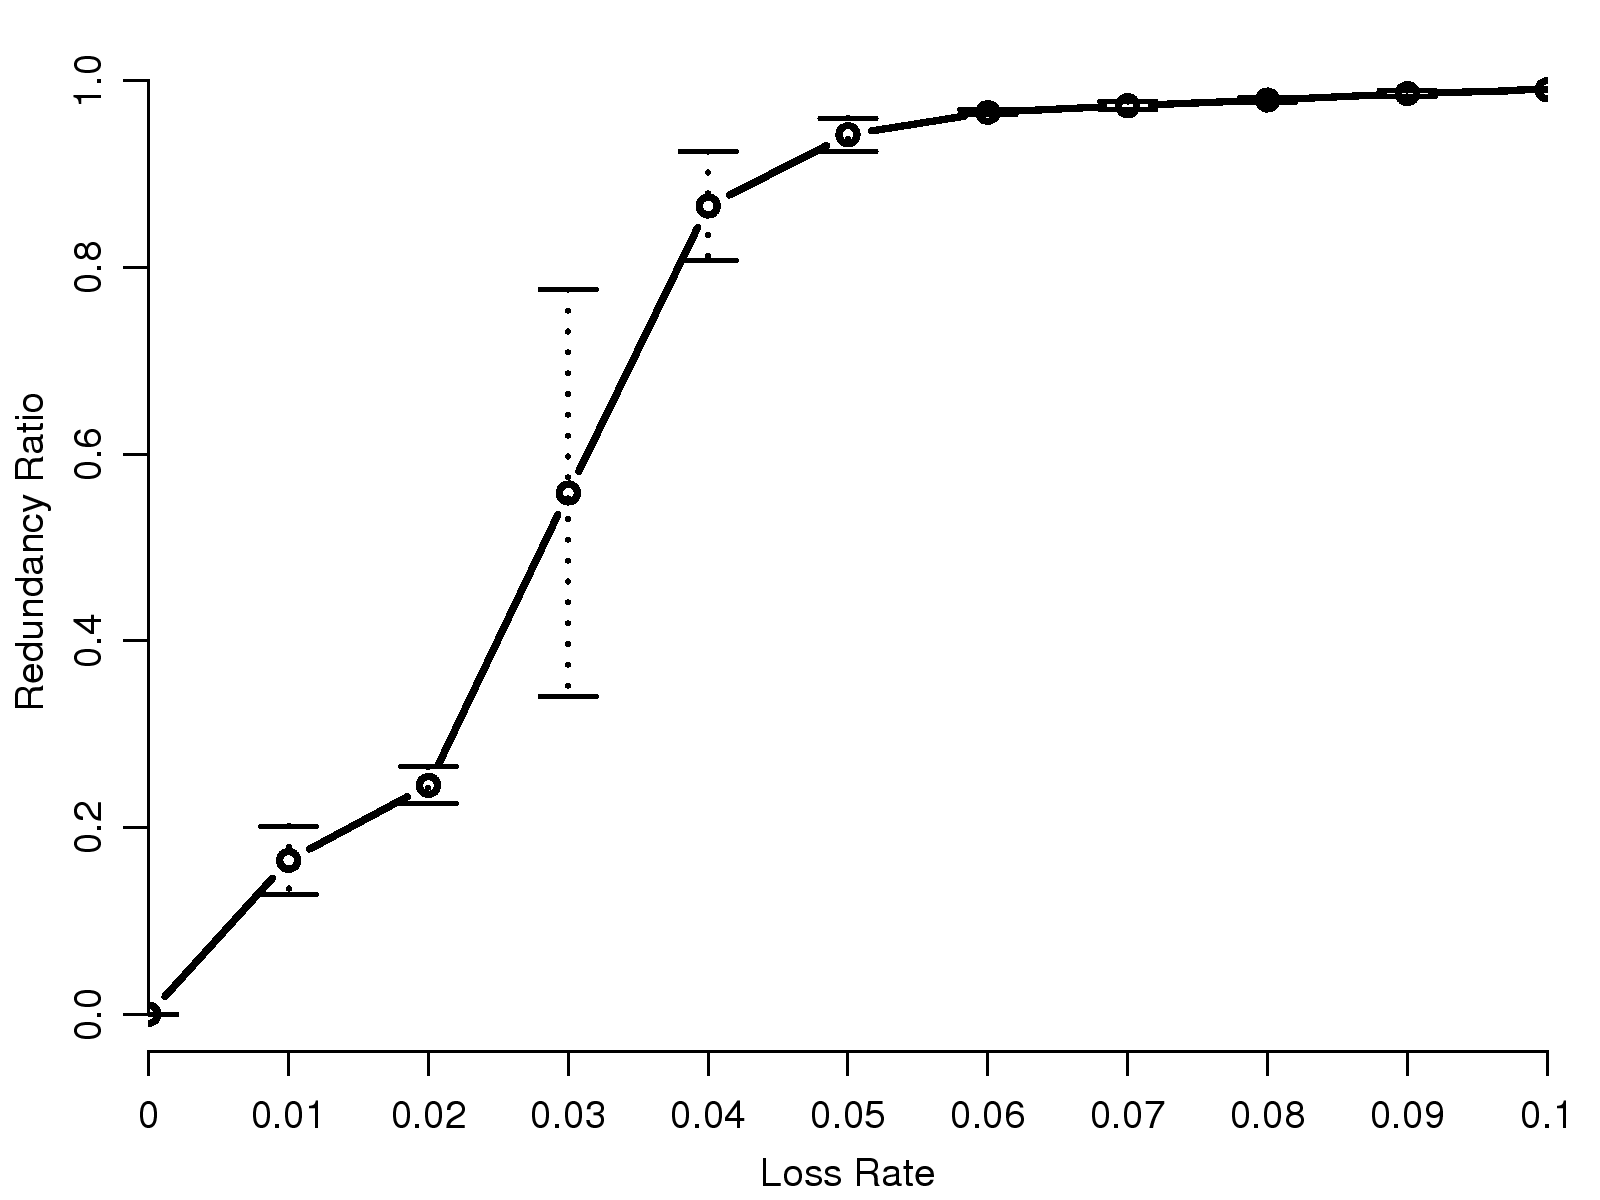
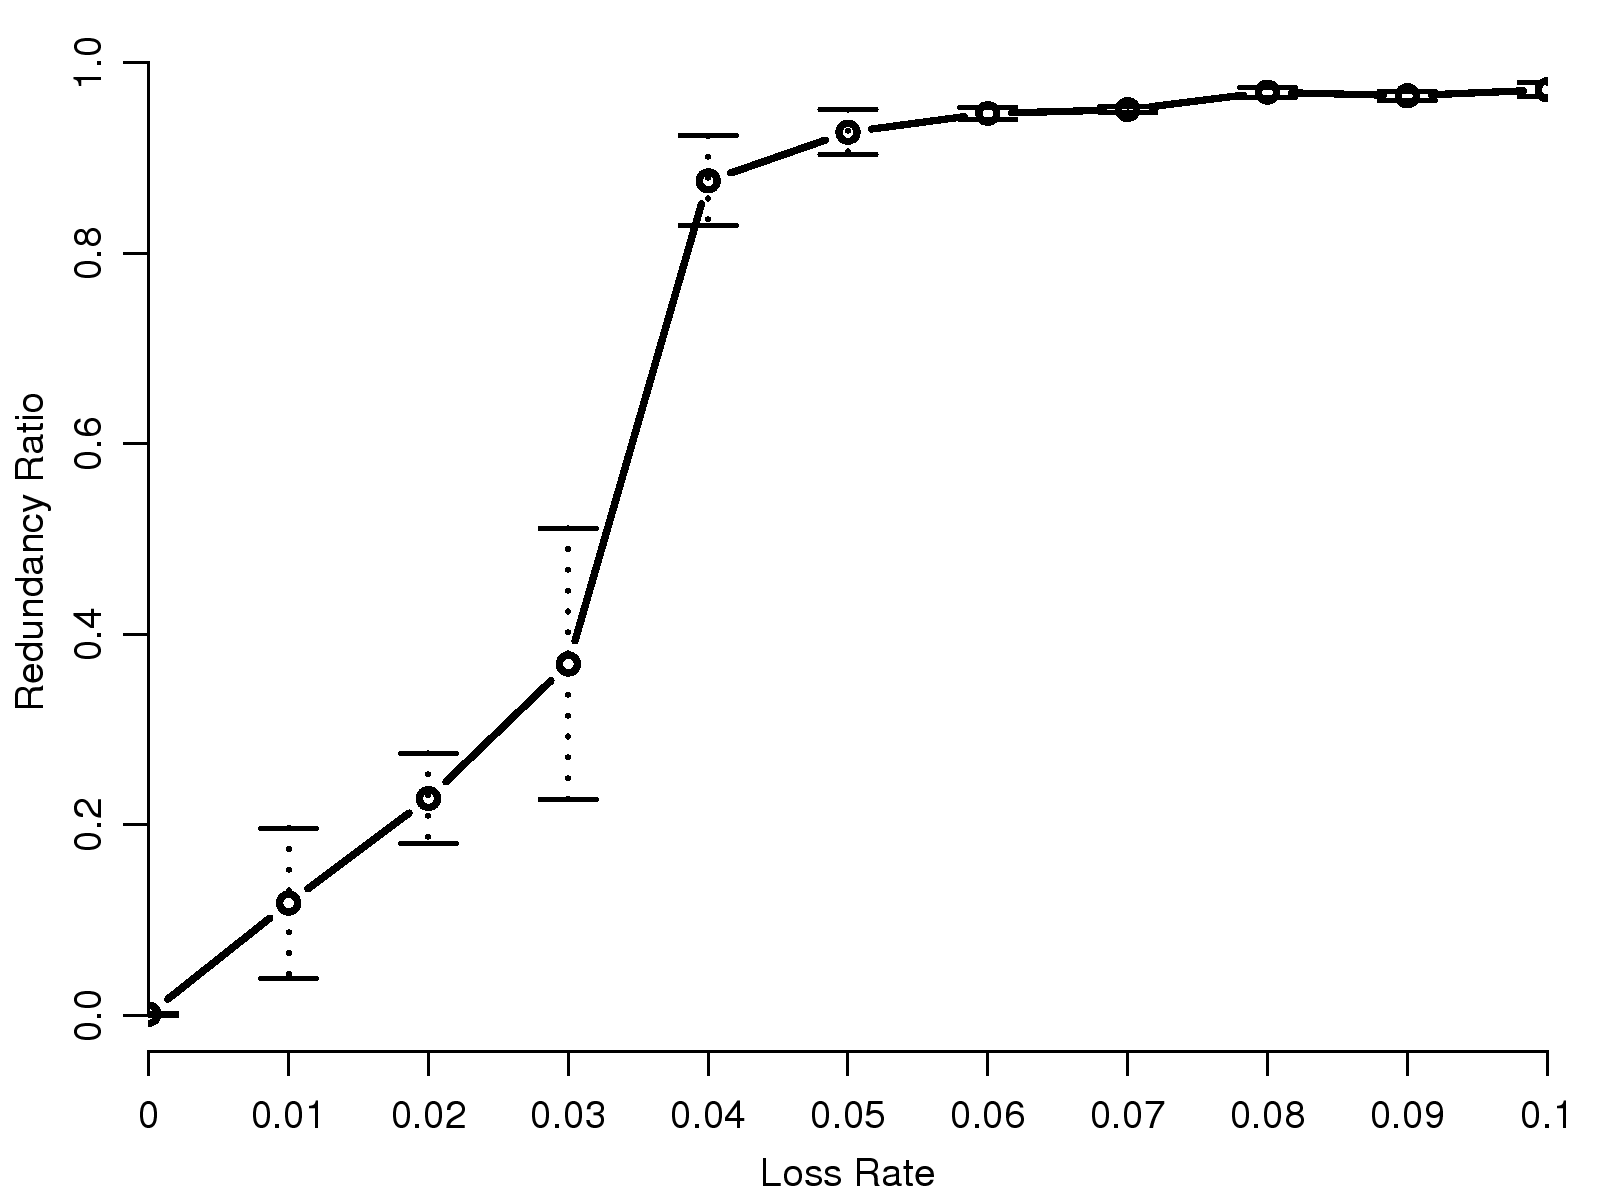
Figure 3: The relationship between the network
loss rate and the redundancy ratio that Skype uses for Skypeout
(G.729) and iSAC.
Fig. 2(a) shows the scatter plot of the payload sizes of the packets in
the SkypeOut (G.729) trace.
From the graph, we observe that when the loss rate is 0%,
i.e., between 0 and 180 seconds, the payload size remains
around 30 bytes. However, as the loss rate
increases, we find there are more packets with a payload size
around 60 bytes. When the loss rate
reaches 10%, i.e., between 1800 and 1980 seconds, the
majority of the packets have a payload of around
60 bytes. However, when the loss rate returns to 0% after 1980 seconds,
the payload size of most packets drops to around 30 bytes. This
phenomenon indicates that Skype changes the proportion of
packets with redundancy information based on the network loss
rate. Note that Skype may also piggyback
signaling data in voice packets. This explains why we can still observe various
payload sizes when no redundant voice information is
introduced, even though G.729 is a constant-bit-rate codec.
The iSAC trace exhibits the same behavior, as shown in Fig. 2(b).
When the loss rate is 0%, the payload size remains
within the range (0,160) bytes approximately. As the loss rate increases,
we find more packets with a payload size in the range (160,320) bytes; and when the loss rate reaches 10%, the majority of the packets have a payload size in the range (160, 320) bytes. Note that although iSAC is a codec with several framing time options,
the framing time of the observing iSAC traffic stays
at 30 ms during the whole call; thus, the variance in the
payload sizes is not a consequence of changes in the speech framing
time.
3.3 Redundancy Ratio Identification
In order to understand the redundancy control algorithm used by Skype, we
attempt to quantify the amount of redundancy added to Skype voice traffic.
We define the redundancy ratio as the percentage of packets that carry
redundant voice data. If all packets carry redundant information, the
redundancy ratio is equal to 1. Conversely, if none of the packets carry
redundant information, the redundancy ratio will be 0.
In the following, we present our method for inferring the redundancy ratio
used by Skype based on the traces collected in the above experiments. We
take G.729 and iSAC as examples, though the method can be extended to other
codecs supported by Skype.
3.3.1 G.729
It is easier to deal with the SkypeOut traces, as the G.729 codec uses
a constant bit rate of 8 Kbps and a constant framing time of 10 ms.
For this reason, the codec's payload
size is more stable than that of iSAC, as shown in Fig. 2(a).
We use a simple threshold method, with the threshold set at 40 bytes, to
determine whether a packet contains a piggybacked frame. In other words,
we assume that a packet contains redundant information
if its payload size is larger than 40 bytes. I.e., if there are 30% of packets with payload size larger than 40 bytes, then the redundancy ratio will be 0.3.
3.3.2 iSAC
It is more difficult to deal with the iSAC traces because iSAC supports
variable bit rate and variable framing time. We use the the following steps
to infer the redundancy ratio in each of the iSAC traces:
First, we determine the framing time of a packet, as it will affect
the payload size of iSAC packets. When the framing time is longer, the
payload size will be larger, since each packet would carry more information.
The framing time can be estimated from the inter-packet time, i.e., the time
difference between successive packets. Because the framing time may be
changed during a call due to network conditions, we estimate the framing
time on a window basis. For a window of n packets, we calculate the
average inter-packet time based on (n−1) inter-packet times. Assuming that
inter-packet time is normally-distributed and centered at the actual framing
time, we compute the likelihoods of the averaged inter-packet time on the
distribution of each possible framing time. Then, we consider the framing
time that yields the maximum likelihood as the actual setting. According
to [4], the possible framing times of iSAC are 30 ms or
60 ms.
Second, by assuming a canonical framing time, we
normalize the packets' payload sizes based on the estimated
framing time. For example, we assume that the canonical framing
time of iSAC is 30 ms. Thus, for a packet with a framing
time of 60 ms, we normalize its payload size by a factor of 2,
i.e., its payload size is divided by 2 in the normalization
step.
Third, we determine whether a packet carries redundant
information based on the normalized payload size. Similar to
the method we used for G.729, we set the threshold at 160 bytes
to identify packets that containing redundancy. We choose this threshold because it is the
maximum observed payload size when there is no packet loss.
3.4 Identification Results
We repeat the experiment five times and estimate the
redundancy ratio for each trace. First, we analyze the G.729
traces. Fig. 3(a) shows the average redundancy ratios and their 95%
confidence intervals with each network loss setting.
We observe that the redundancy ratio increases gradually when the
loss rate is between 1% and 2%, and increases dramatically
when the loss rate is between 3% and 4%. The
redundancy ratio stays higher than 0.9 when the loss rate is
higher than 4%.
Next, we analyze the iSAC traces and plot the relationship
between the average redundancy ratio and the network loss rate,
as shown in Fig. 3(b). From the figure, we find that Skype adjusts
the redundancy ratio for iSAC traffic in a similar way to
that used to adjust G.729, which suggests that Skype adjusts the
redundancy ratio regardless of the codec used.
4 Understanding Skype's Redundancy Control Algorithm
The experiments in Section III show that Skype adjusts its
redundancy ratio based on the current network loss rate. In this section,
we investigate whether Skype considers other factors when it adjusts the
redundancy ratio.
We consider three factors that may affect VoIP quality. The first factor is
available bandwidth, as reduced bandwidth may cause some packets to be
dropped and force the codec to use a lower encoding bit rate whenever
possible. The second factor is the audio codec used, as different codecs may
interpret frame losses in different ways. Moreover, some codecs may be
robust to frame loss, while others may not. Thus, it may be appropriate to
adjust the redundancy ratio with different methods for different audio
codecs. The third factor is the burstiness of network loss, which
characterizes the degree of successiveness on packet drops, since different
patterns of packet loss might cause different levels of voice quality
impairment. In the following sub-sections, we discuss Skype's redundancy
control policy in response to these three factors.
4.1 Effect of Available Bandwidth
How Skype adapts to changing bandwidth has been discussed
in [3]. The authors have found that when they reduced the
bandwidth, the payload size decreased, which suggests the codec switches to
a lower bit rate. Although additional packet loss may occur with a reduced
bandwidth, the authors did not observe any packets with a double payload
size, i.e., did not observe any packets carrying redundant information. This
is probably because the codec successfully switches to a lower bit rate
before the packet loss rate is high enough to trigger the redundancy control
algorithm. The authors concluded that the bandwidth setting does not affect
Skype's redundancy control decisions.
4.2 Effect of the Codec
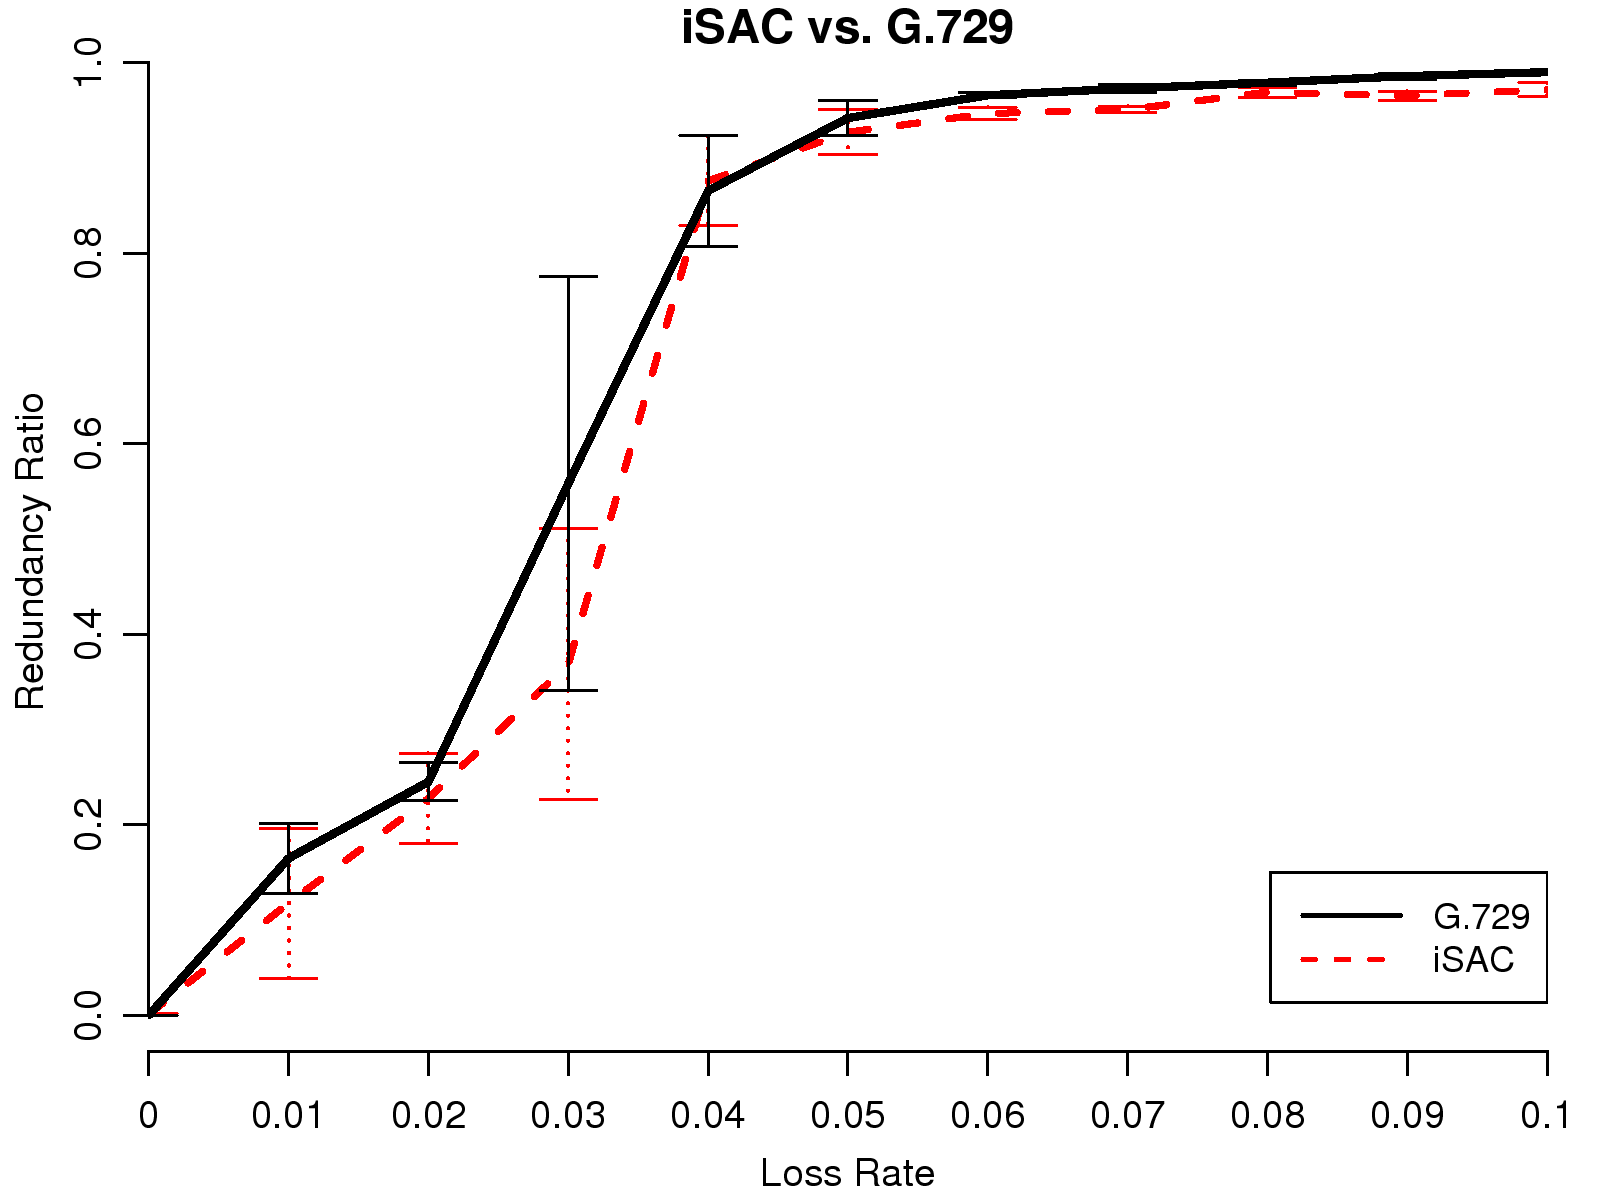
Figure 4: Comparison of Skype's redundancy
control algorithms over different network loss rates for G.729
and iSAC.
Fig. 4 shows the redundancy ratios for various network loss rate
under G.729 and iSAC. Our objective is to determine whether Skype uses different redundancy control algorithms for different codecs.
In the figure, the 95% confidence interval of two curves collide with each other. This
observation strongly suggests that Skype applies the same
redundancy control algorithm for different codecs, even though
it leads to different levels of user satisfaction, as we
will show in the next section.
(a) G.729
(b) iSAC
Figure 5: Comparison of Skype's redundancy control algorithms
for different levels of network loss burstiness for G.729 and
iSAC.
4.3 Effect of Network Loss Burstiness
To quantify the burstiness of network loss, we adopt the
metric burst ratio defined in ITU-T
G.107 [12]:
In this definition, the
burst ratio is equal to 1 when packet loss is purely random,
and it is larger than 1 when packet loss is
bursty. Specifically, a burst ratio equal to 2 indicates
that the average length of consecutive losses is twice longer
than that of purely random losses.
The experiment are similar to those in Section III,
except that the packet loss is now
bursty rather than uniformly distributed. We implemented the Gilbert
model [8] to determine whether a packet should be
dropped in dummynet[17] in order to
simulate different levels of loss burstiness. The
Gilbert model comprises two states, the received state and the
loss state; and two transition probabilities, p and q,
where p is the probability of a transition moving from
"received" to "loss" and q is the probability of a
transition moving from "loss" to "received." In this
model, the packet loss rate is formulated as [p/(p+q)] and the
burst ratio is formulated as [1/(p+q)]. Thus, by setting the
values of p and q, we are able to control both the network
loss rate as well as the burst ratio.
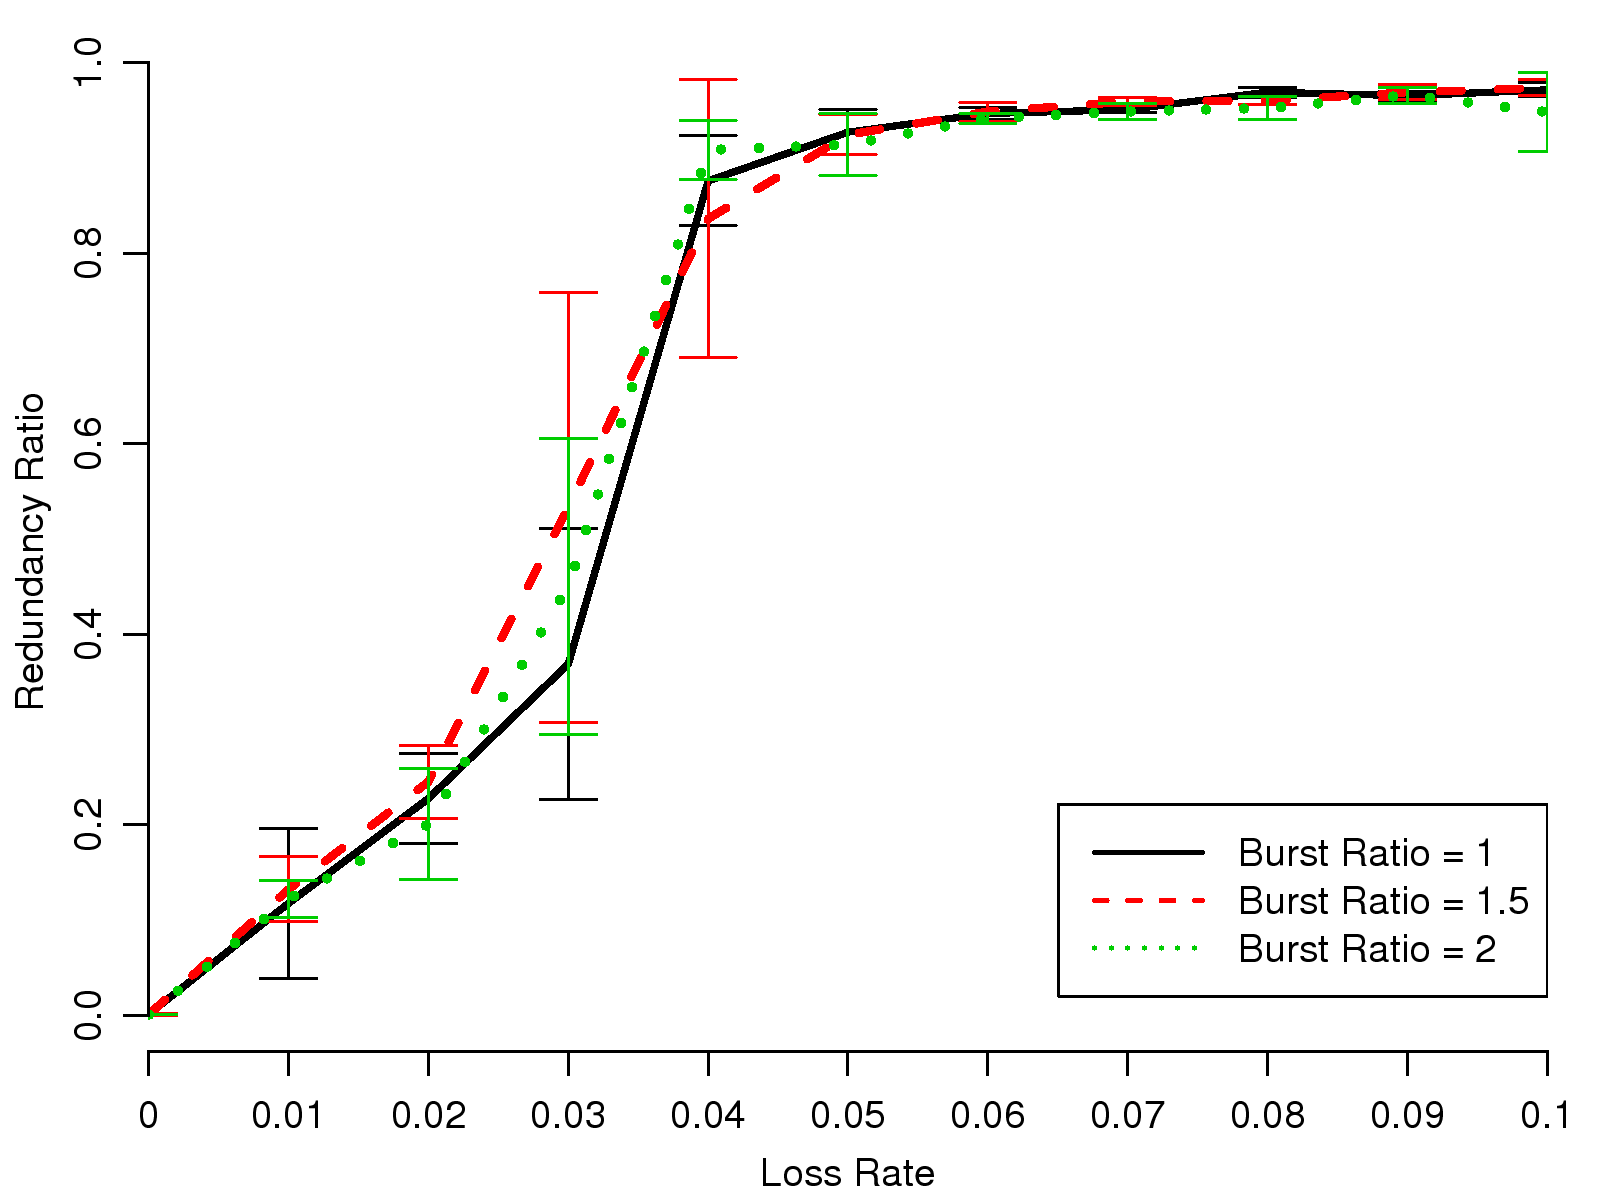
Fig. 5(a) shows the observed redundancy ratio of G.729 when
its traffic experiences packet losses with different burst ratios. As shown
in the figure, each curve is corresponding to a burst ratio setting and
their 95% confidence intervals overlap with each other. Similarly, in
Fig. 5(b), each curve represents the redundancy ratios observed
from iSAC calls with packet losses under different burst ratios. Again, we
found that the 95% confidence intervals of the curves are also
overlapped.
In summary, our experiment results strongly suggest that Skype
adjusts redundancy ratios only based on the network loss
rate; i.e., it does not consider the codec or network loss busrtiness.
5 Deriving an Optimal Redundancy Control Policy
Figure 6: The information flow of our
methodology for computing audio quality under given network
conditions.
In this section, we present a methodology that can
derive the optimal redundancy control policy for a desired VoIP
quality under a certain network condition. We then compare the
inferred Skype redundancy control policy with the optimal
policy to determine whether Skype's policy is optimal.
5.1 Methodology
We develop a simulator that can grade the voice quality of
audio clips transmitted using a specific codec with a given
network condition. To evaluate the quality of an audio clip,
we use PESQ [14], which compares a degraded audio
clip with its original version and output a Mean Opinion
Score (MOS) [13].
The steps of our methodology for deriving the optimal redundancy control
policy are as follows:
Encode an audio clip into voice frames by using one of the
encoders provided by the Intel IPP (Integrated Performance
Primitives) library [11].
Simulate network loss with the Gilbert model; that is,
drop a frame if the model is currently in the "loss" state
and retain the frame otherwise.
Determine whether a frame is piggybacked by the desired
redundancy ratio. If the redundancy ratio is set to p, then
each frame has a probability p of being transmitted twice. Thus,
even if a frame was dropped in step 2, it will be
restored if the subsequent frame was not dropped and was
selected to carry redundant voice data (with probability
p).
Use the corresponding decoder to decode the resulting stream of voice frames into a degraded audio clip.
Use PESQ to quantify the quality of the degraded audio
clip by comparing it to the original clip.
Repeat the above steps for a range of redundancy
ratios, and consider the ratio with the desired PESQ score as the optimal redundancy
ratio. For example, if the desired PESQ score is 3.3, then under each network loss settings, the redundancy ratio achieves exactly 3.3 is considered as the optimal redundancy ratio.
The information flow of the methodology
is illustrated in Fig. 6. In our
simulations, we use an audio clip concatenated from several speech recordings
in American English provided by the Open Speech Repository [20].
The recordings are concatenated using the Sound eXchange (SoX)
Library [18]; the length of the concatenated audio clip is 3 minutes and 27
seconds.
5.2 Optimal Redundancy Ratio for the Codecs
(a) G.711
(b) G.729
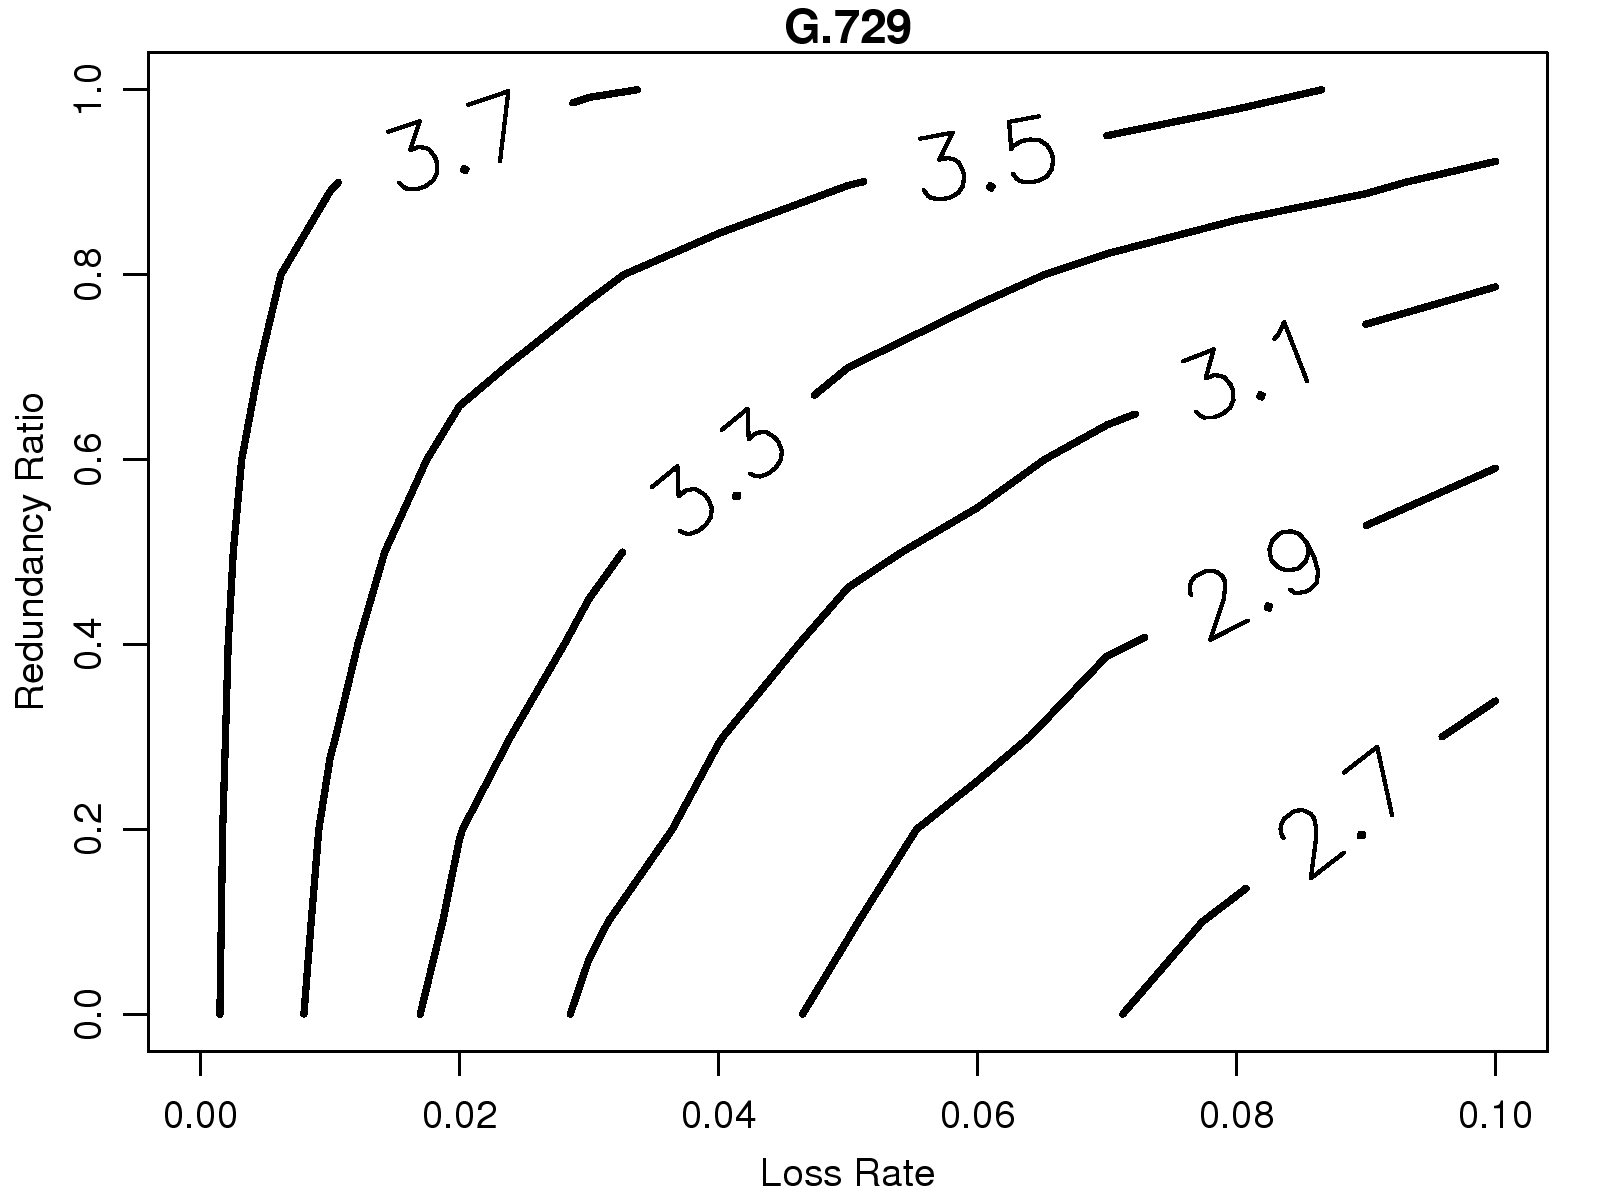
Figure 7: The contour plots of audio quality scores for
different combinations of redundancy ratios and network loss
rates.
First, we consider whether the optimal redundancy ratios are the
same for different audio codecs. To address this issue, we
conduct the simulations described in the previous sub-section for G.711,
the most common codec used in digital speech systems,
and for G.729, the codec used by
SkypeOut2.
The optimal redundancy ratios inferred by our methodology
for G.711 and G.729 are shown in Fig. 7. On each
graph, the contour curve labeled with a number, say 3.3,
represents the
combinations of loss rates and redundancy ratios that yields the
same MOS score, 3.3.
We can see that, for a certain loss rate,
higher redundancy ratios yield to higher MOS scores. On the
other hand, for a certain redundancy ratio, higher loss rates
lead to lower MOS scores. If we compare the contour plots of
both codecs, we find that the redundancy ratios required
to maintain a certain MOS score for G.711 and G.729 are
different. Generally, redundancy should be added more
aggressively for G.711 in order to achieve the same quality as
G.729. For example, assuming the network loss rate is 2%
and the desired MOS score is 3.3, the redundancy ratio should
be set to 0.5 for G.711. In contrast, we can achieve the same
sound quality by setting the redundancy ratio to 0.2
if G.729 is used.
5.3 Optimal Redundancy Ratio for the Burst Ratios
(a) G.711
(b) G.729
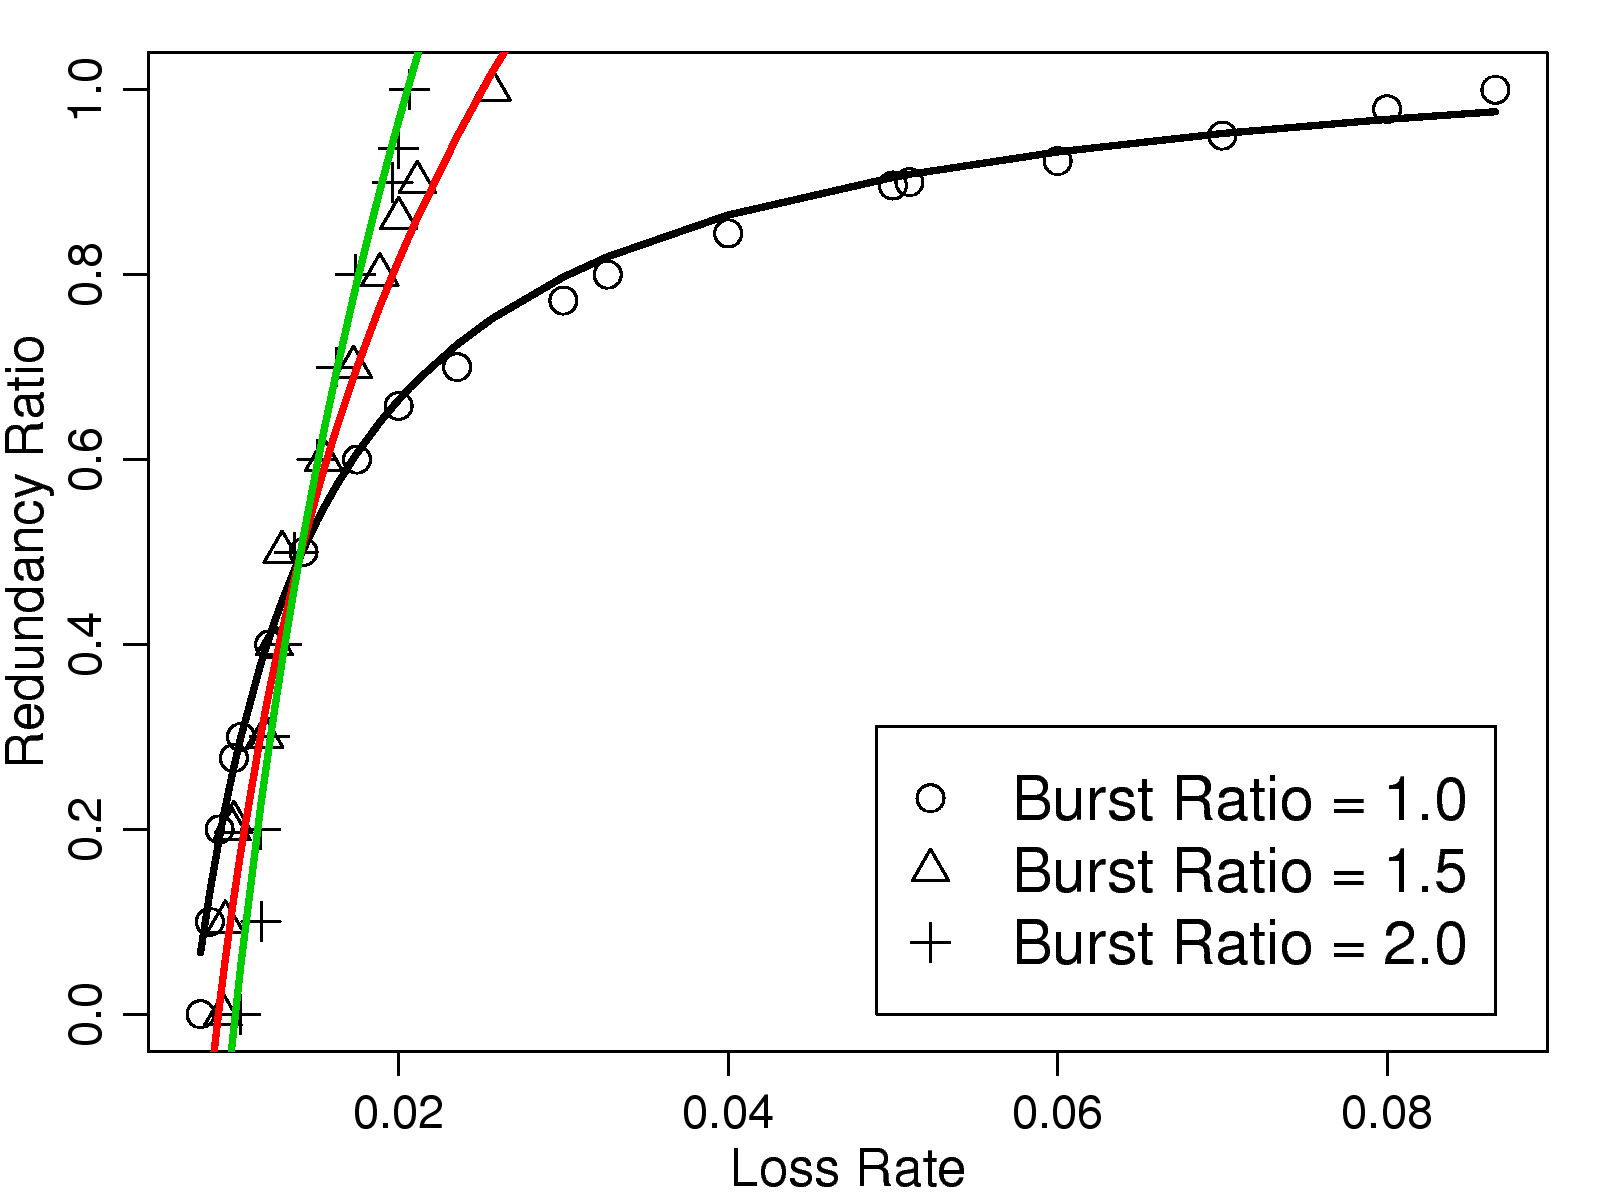
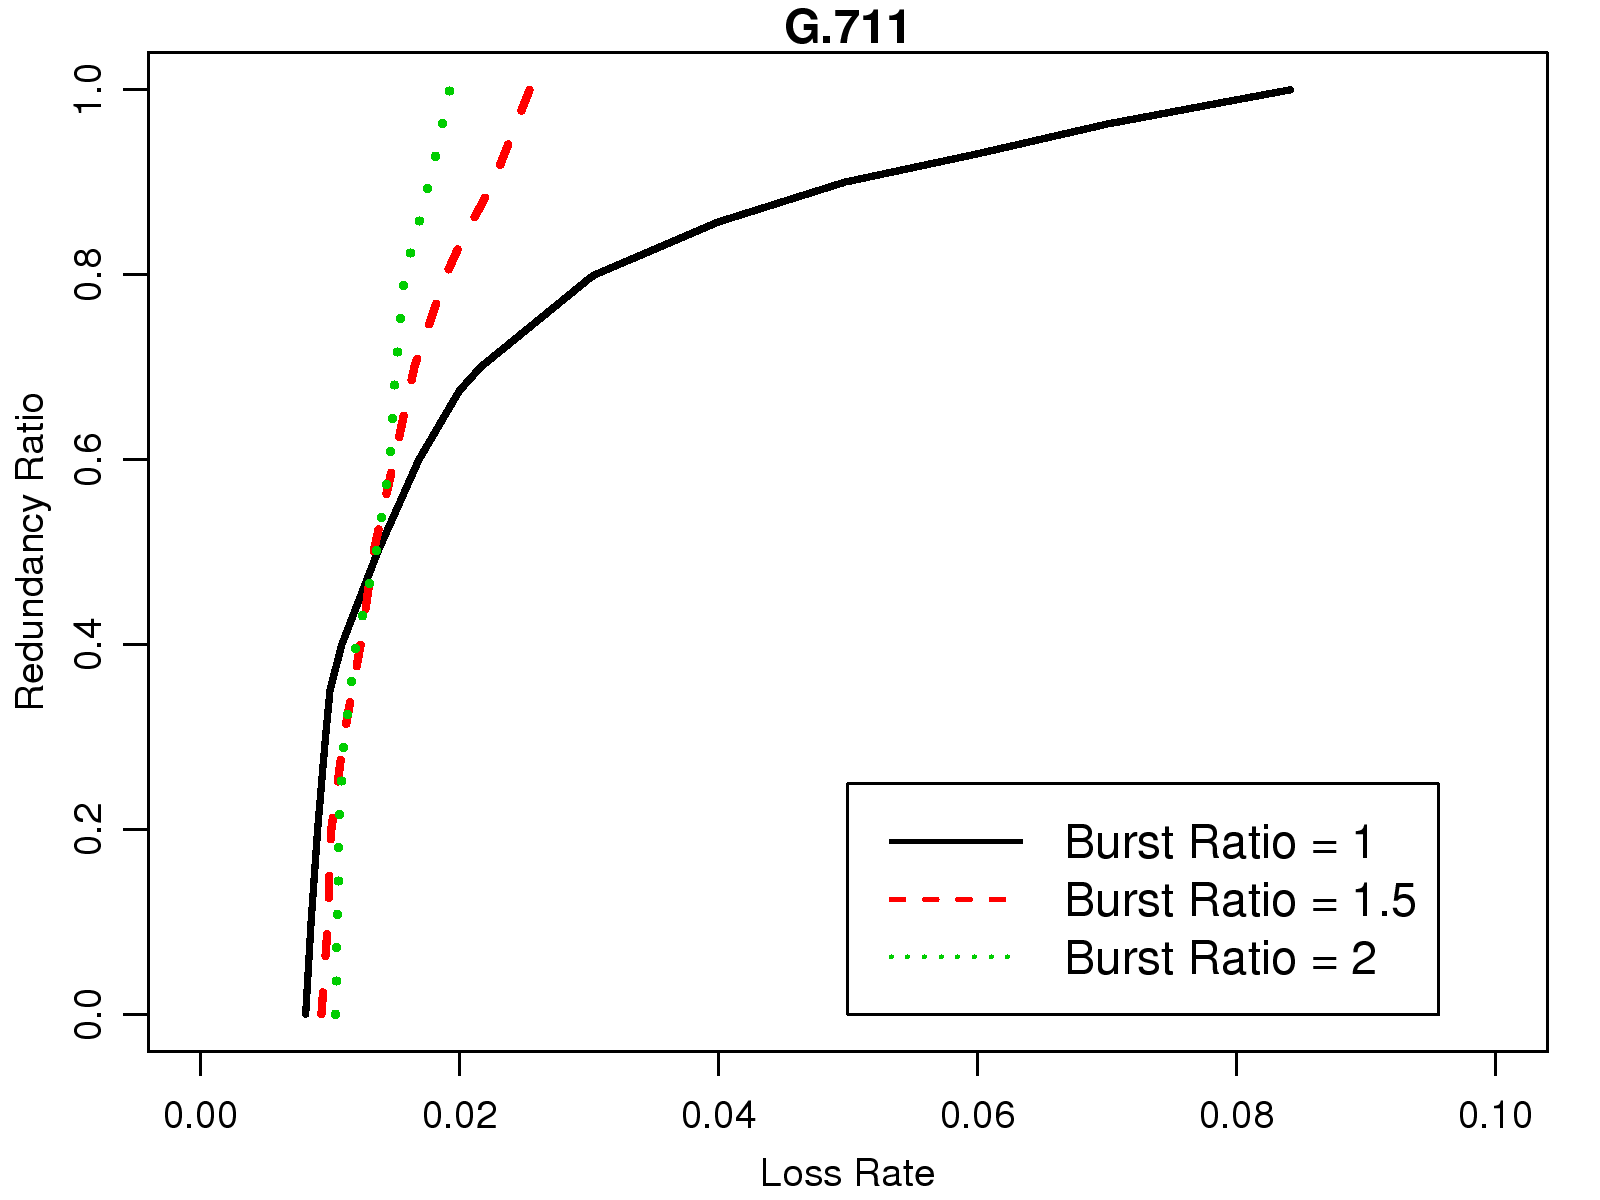
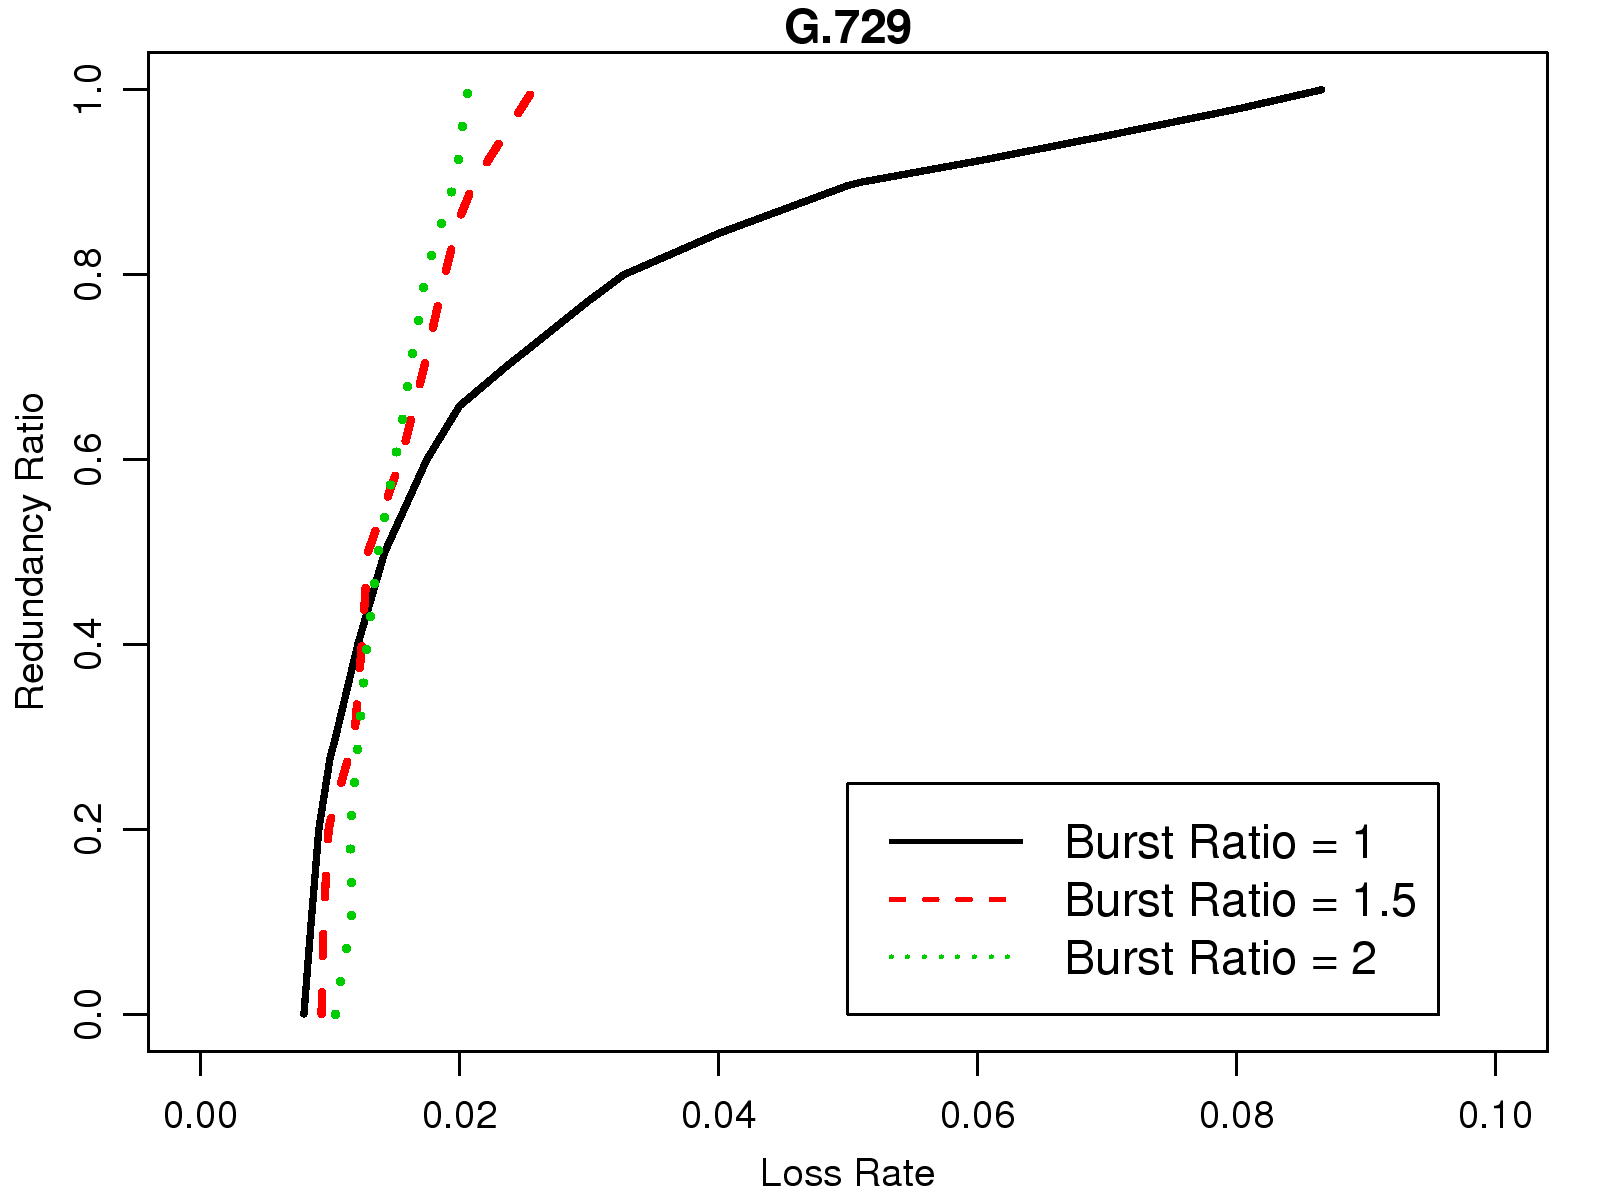
Figure 8: The redundancy ratios needed to sustain voice quality
for a MOS score of 3.5 with different loss rates and burst
ratios.
We repeat the above simulations, except that we now infer the
optimal redundancy ratios for different burst ratios.
Fig. 8 shows the contour lines for G.711 and G.729
that corresponding to the MOS score 3.5 for the
burst ratios 1, 1.5, and 2. From the
graphs, we observe that the redundancy ratio should be
increased more aggressively if we wish to maintain the same
audio quality under higher burst ratios. For example,
to maintain a consistent level of user satisfaction with G.711 under
network loss rate of 2%, the redundancy ratio should be set to 0.7
when the burst ratio is 1; however, it should be set to 0.8 and
1 when the burst ratios are 1.5 and 2, respectively.
5.4 Is Skype's Policy Optimal?
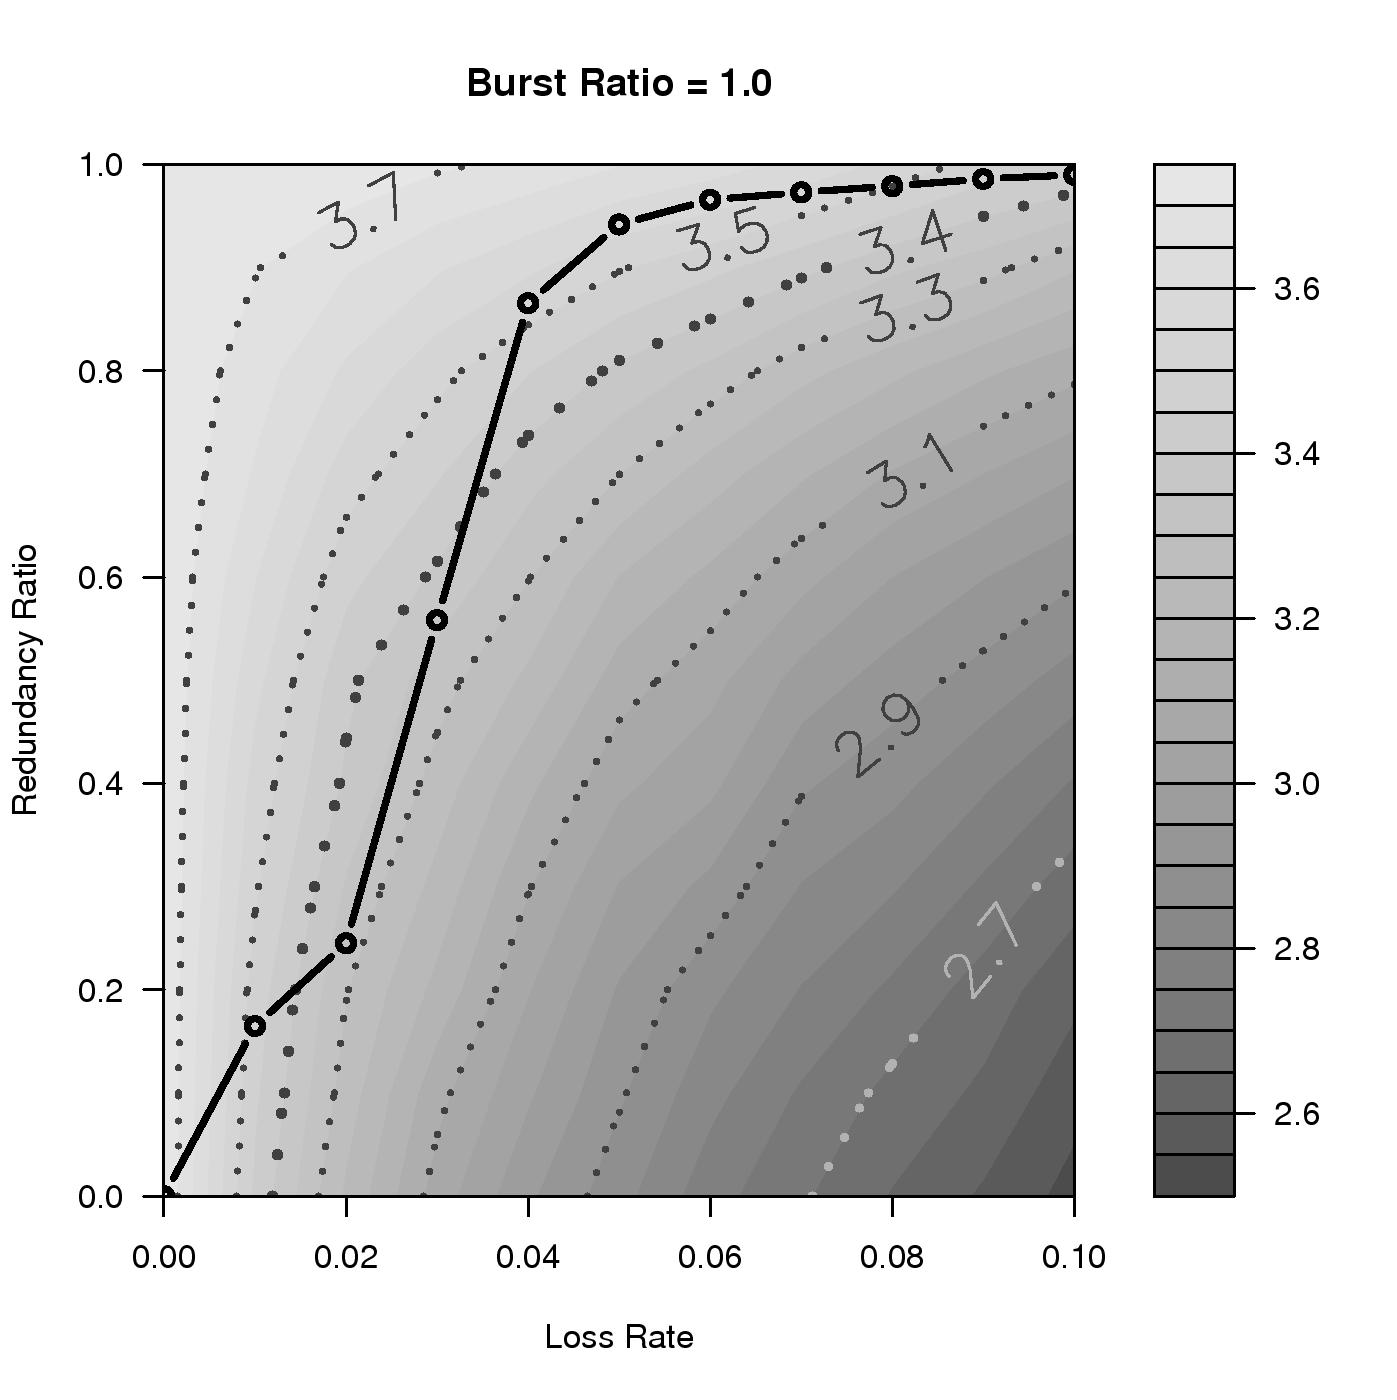
(a) Burst Ratio = 1
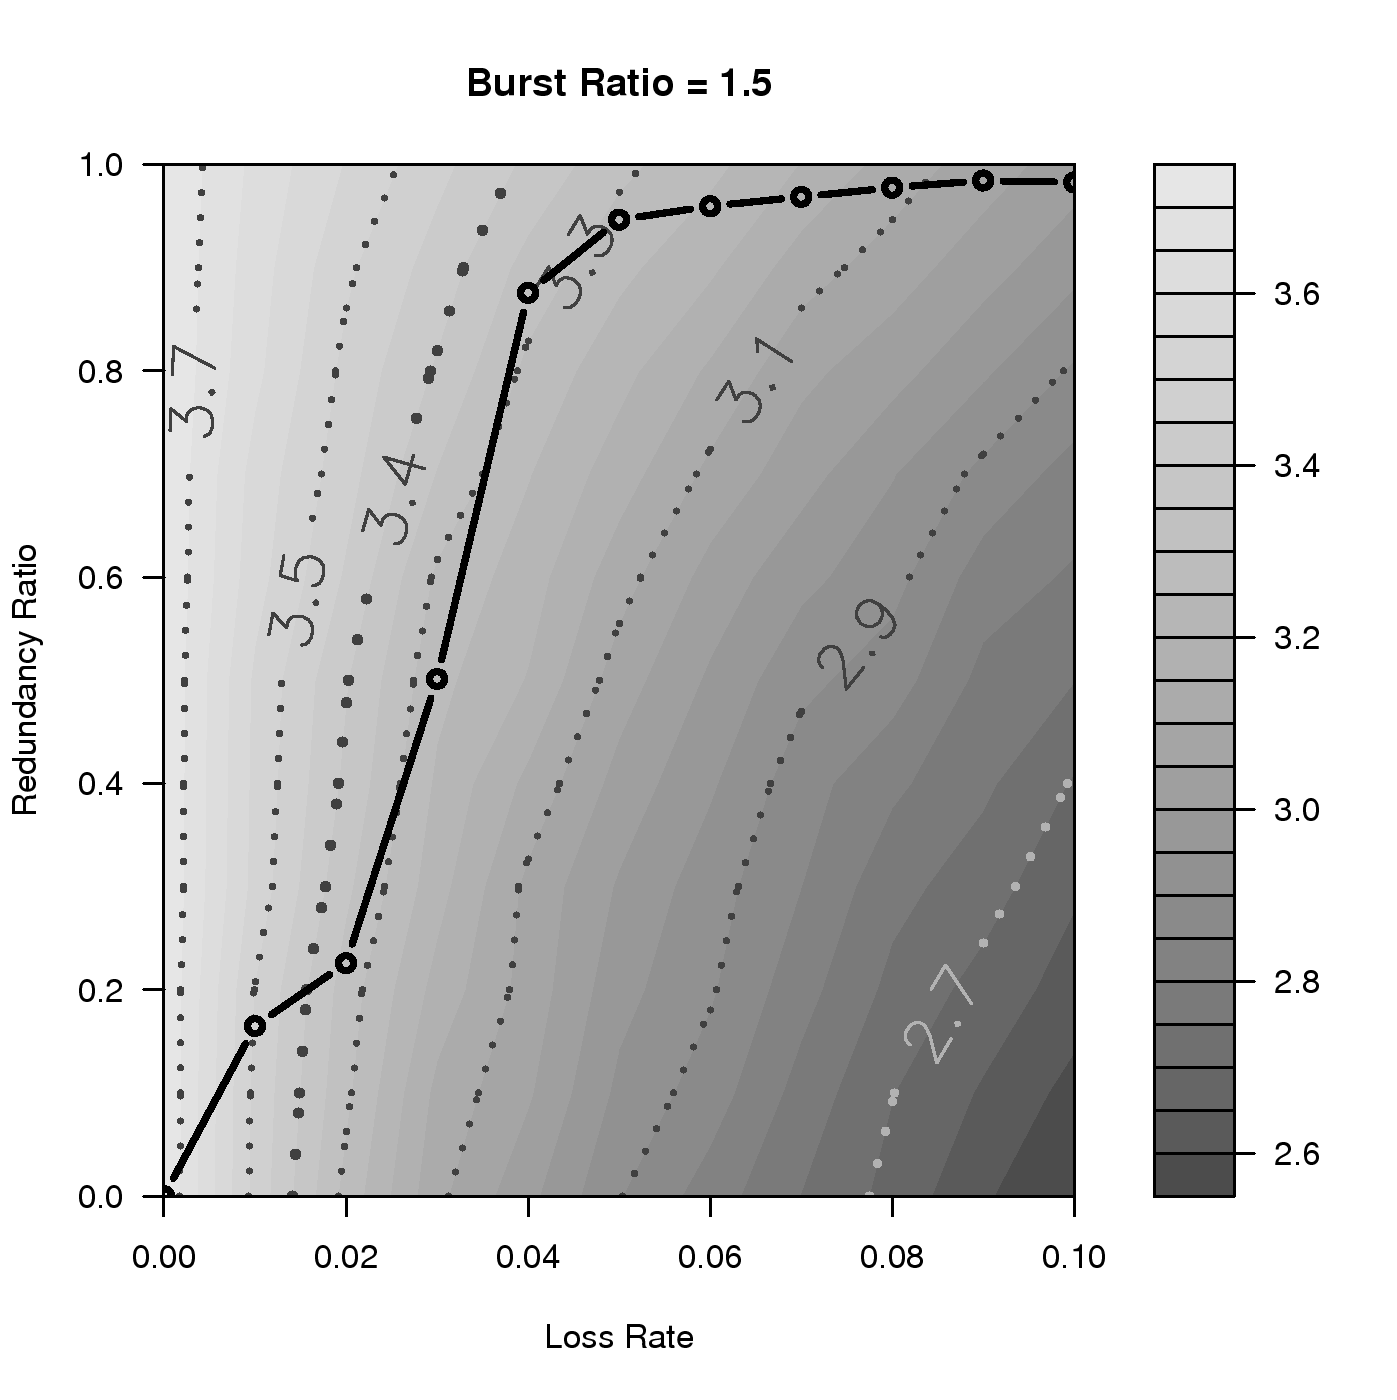
(b) Burst Ratio = 1.5
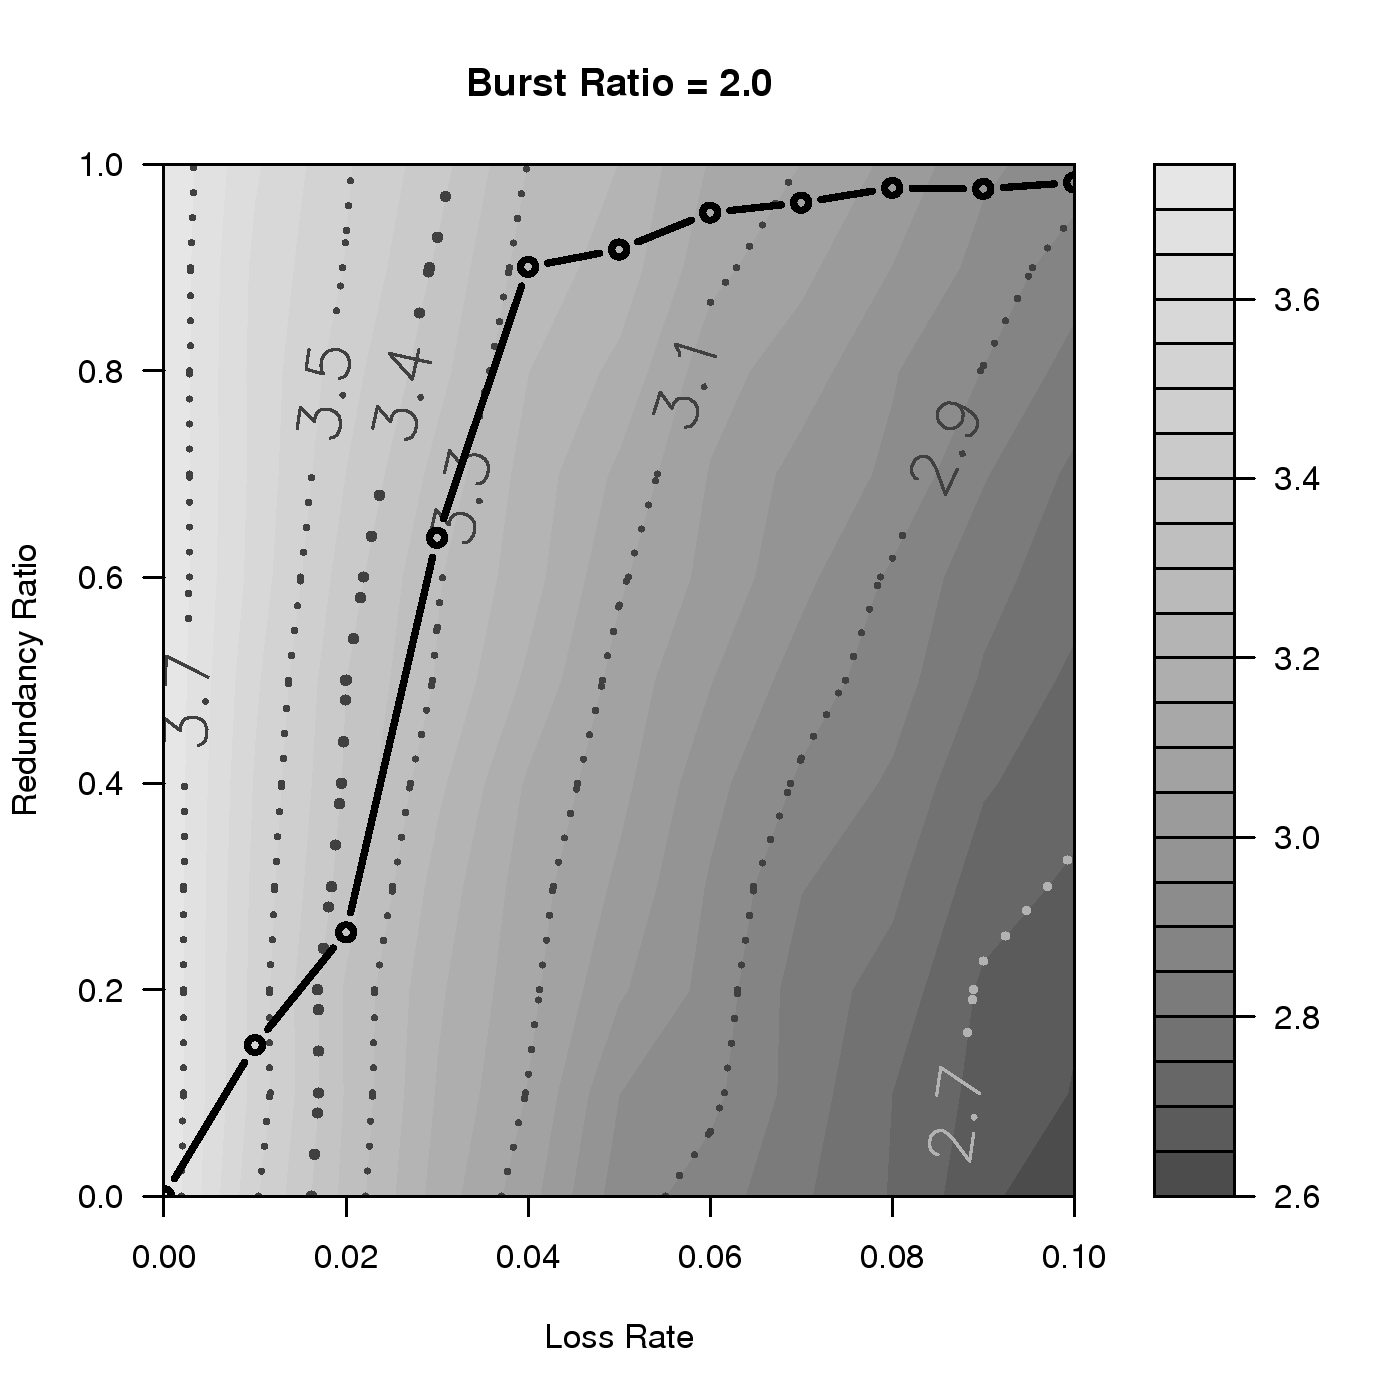
(c) Burst Ratio = 2
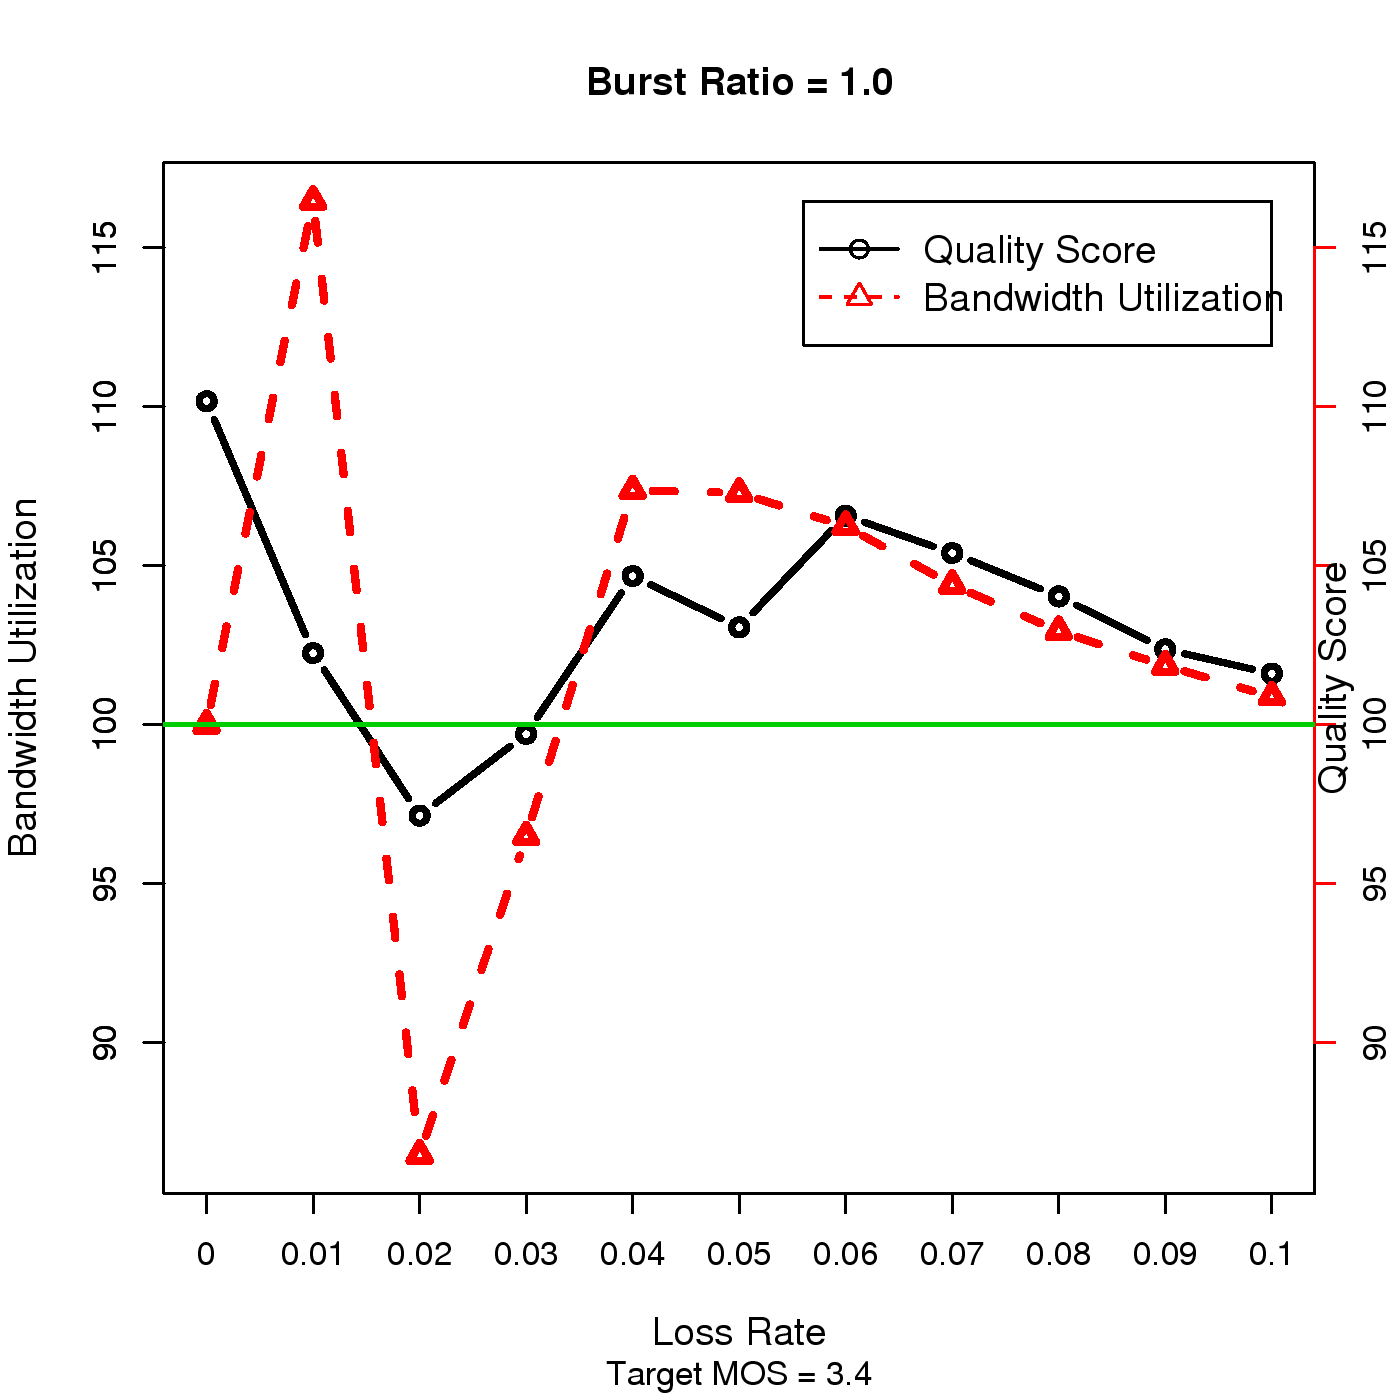
(d) Burst Ratio = 1
(e) Burst Ratio = 1.5
(f) Burst Ratio = 2
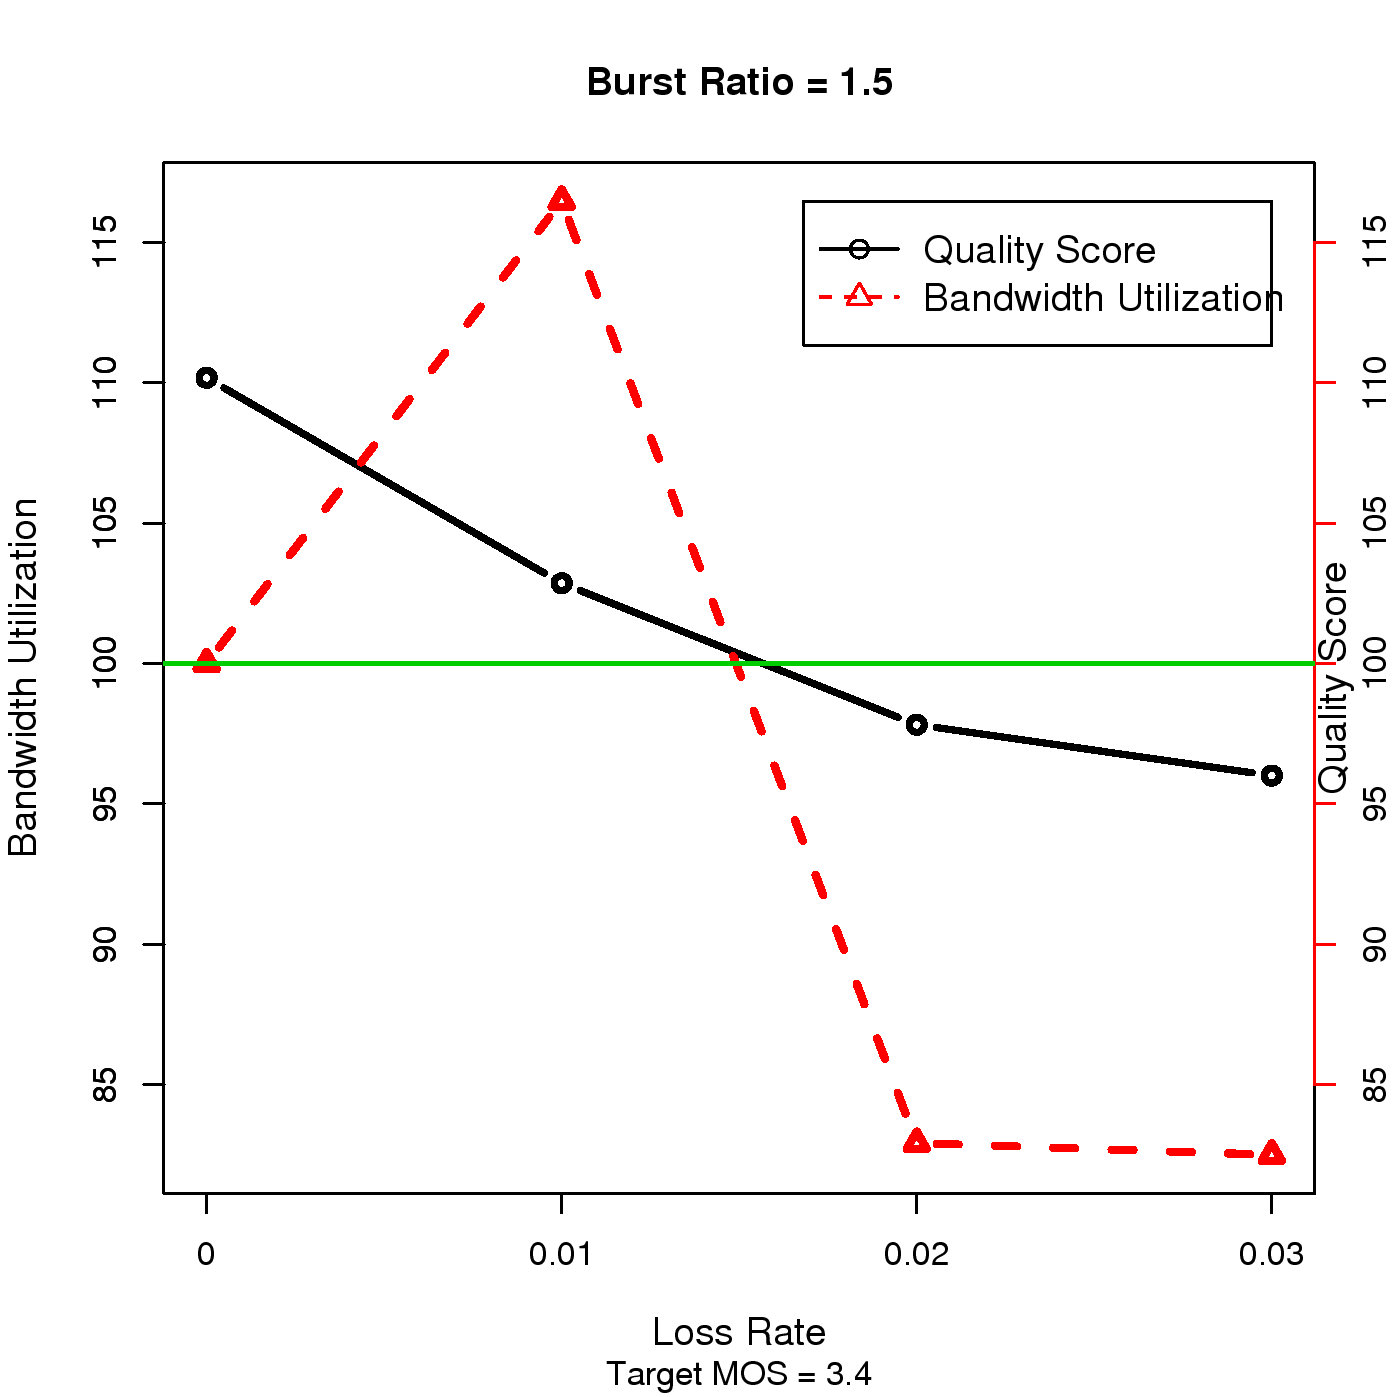
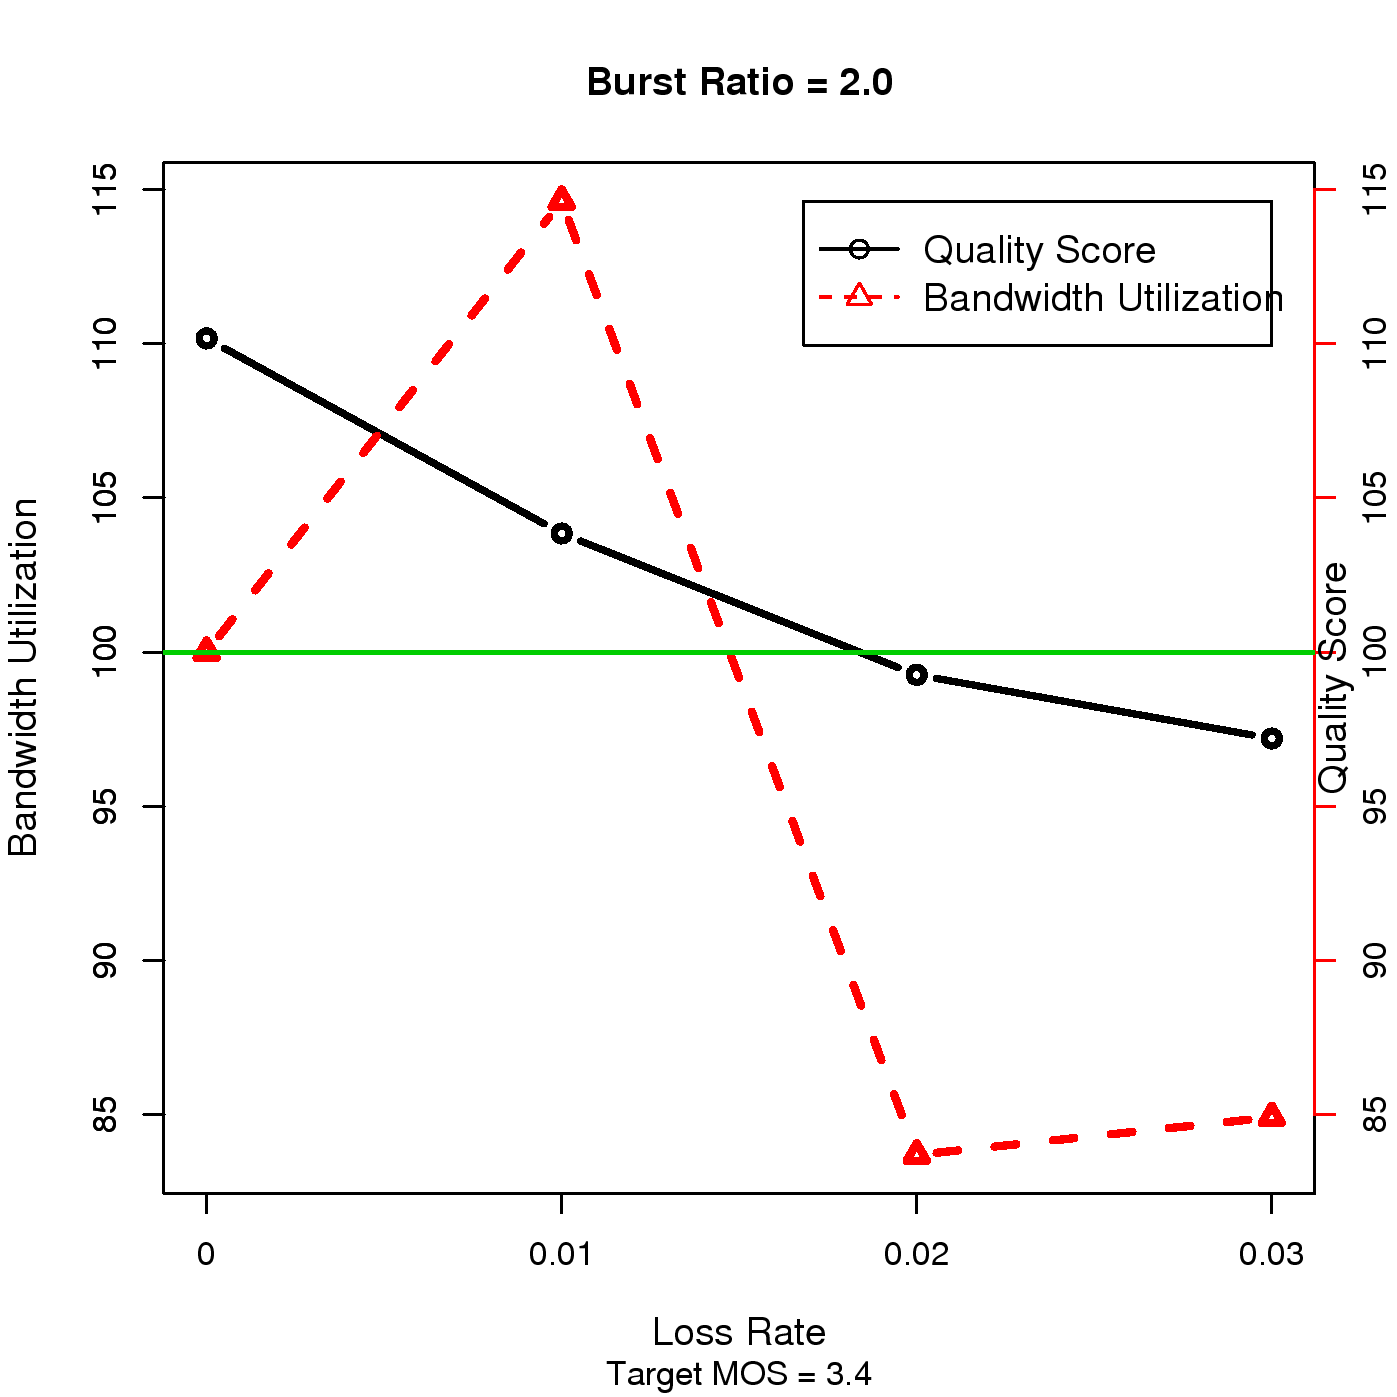
Figure 9: Top row: Comparisons of Skype's redundancy
control policy vs. the redundancy ratios required to achieve
certain audio quality levels. Bottom row: Quantifying
how Skype's redundancy control policy deviates from the optimal
algorithm assuming that a MOS score of 3.4 is desired.
Now that we have determined Skype's redundancy control algorithm
and derived the optimal redundancy control policy, we can now
assess whether Skype's redundancy control policy is optimal by comparing
it with the optimal policy.
In Fig. 9, we overlap Skype's redundancy
control decisions and the optimal redundancy policy for
G.729; each graphs corresponds to a certain burst ratio.
By comparing the contour curves and Skype's redundancy ratio curve,
we find that Skype fails to maintain
a consistent voice quality at a certain level.
For example, in Fig. 9(a), Skype achieves
an audio quality better than that of a MOS score of 3.5 when the loss
rate is higher than 4% or lower than 1%. At the same
time, its quality level is much lower than 3.5 when the loss
rate is between 2% and 4%. The inconsistency in voice
quality would be frustrating for users. On the
other hand, assuming that the desired MOS score is 3.3, this
phenomenon indicates that Skype may inject more than enough
traffic into the network by adjusting the redundancy ratio too
aggressively and obtains an unnecessarily high MOS score as a consequence.
In contrast, by adjusting the redundancy ratio to the optimal redundancy ratio
derived by our methodology, we can ensure a balance between
bandwidth utilization and voice quality.
We use Fig. 9 to quantify the degree
that Skype's redundancy control algorithm deviates from the policy
that achieves a consistent audio quality under various network
conditions. The graphs are computed based on the assumption that the desired
MOS score is 3.4, as Skype's audio quality is mostly around
this level in our simulation scenarios. For each network
setting, we plot the bandwidth Skype uses and the MOS score
Skype provides on the respective normalized scales. The desired
MOS score and the bandwidth required to achieve the
desired audio quality are both set to 100.
On the graphs, the left-hand side of the y-axis marks the
normalized bandwidth utilization, and the right-hand side
marks the normalized MOS score3. We observe that the bandwidth utilization and audio
quality of Skype fluctuate under different network settings.
Sometimes, Skype uses too little bandwidth and results in worse
quality scores than the desired score; for example, the
scenario with 2% loss rate in
Fig. 9(d), and those with 2% and 3%
loss rates in Fig. 9(e) and 9(f) respectively.
At the same time, Skype sometimes
injects too much redundant information and
thus achieves a quality level better than the desired level, e.g., the
scenarios with a loss rate higher than 4% and a burst ratio
equal to 1, as shown in Fig. 9(d).
Our results show that Skype's audio quality is not consistent
as it adjusts the redundancy ratio
independently of the codec used and the
network loss burstiness. The inconsistency in voice quality may result in
frustration for users or over-utilization of bandwidth.
To balance the needs of users and ensure
network efficiency, a more sophisticated redundancy control
algorithm that considers all the necessary factors is required.
6 Modeling Optimal Redundancy Ratios
We have shown that the redundancy control algorithm used by Skype is
suboptimal. Moreover, we have proposed computing the optimal redundancy
control policy based on PESQ quality estimation. The policy can be adopted
by real-time audio streaming tools to provide consistent user experiences no
matter how network conditions change. However, the procedures for deriving
the optimal redundancy ratios are time consuming and therefore need to be
performed beforehand. Note that it is not possible to compute an optimal
redundancy ratio for any combination of network factors, as many of the
factors, including the network loss rate, are real-valued. Therefore, we
believe it is necessary to develop a model that can determine the optimal
redundancy ratio for any network condition.
Table 1: Coefficients in the model
Variable
Coef
Std. Err.
t
Pr > |t|
(constant)
1.06×100
4.47×10⁻²
23.68
< 2×10⁻¹⁶
plr
−1.47×101
8.2×10⁻¹
−17.84
< 2×10⁻¹⁶
plr−1
−5.03×10⁻³
5.53×10⁻⁴
−9.10
3.45×10⁻¹¹
plr:br
1.48×101
0.18
16.25
< 2×10⁻¹⁶
plr−1:br
−2.89×10⁻³
1.90×10⁻⁴
−15.18
< 2×10⁻¹⁶
Take G.729 as an example. Using an ordinal polynomial regression approach,
we develop a model that can predict the optimal redundancy ratio based on a
given network loss rate and burst ratio. The model computes the optimal
redundancy ratio by
(constant)+
coefplr·plr+coefplr−1·plr−1+
coefplr:br·plr·br+ coefplr−1:br·plr−1·br,
where plr denotes the packet loss rate, and br denotes the
burst ratio. The coefficients are listed in
Table I. To evaluate the model's adequacy, we
show both the computed and the predicted optimal redundancy ratios
for G.729 under various network conditions in
Fig. 10.
The prediction curves on the graph describe the computed optimal redundancy
ratios very well based on the two network factors. The R2
value of the regression model is as high as 0.986, which
indicates that the model fits the data very well.
Figure 10: Comparison of computed and predicted optimal
redundancy ratios for G.729 with different combinations of
network loss rates and burst ratios.
This approach for predicting optimal redundancy ratios can be extended to
other audio codec and generalized by incorporating additional network
factors.
The advantage of our model is that it is easy to compute, as only simple
arithmetic is needed to calculate the optimal redundancy ratio given the
network factors. Therefore, any VoIP application that adopts the model can
provide consistent service quality with minimum computation and network
overhead.
7 Conclusion
In this paper, we have determined how Skype adapts its redundancy levels to network loss rate and burstiness; shown that Skype's rate adaptation mechanism is not really geared for user satisfaction; and proposed a general model for various codecs to tune the redundancy for consistent user satisfaction. The methodology used to derive the general model can be extended by Skype developers to facilitate tuning of different proprietary codecs, such as iSAC and SVOPC.
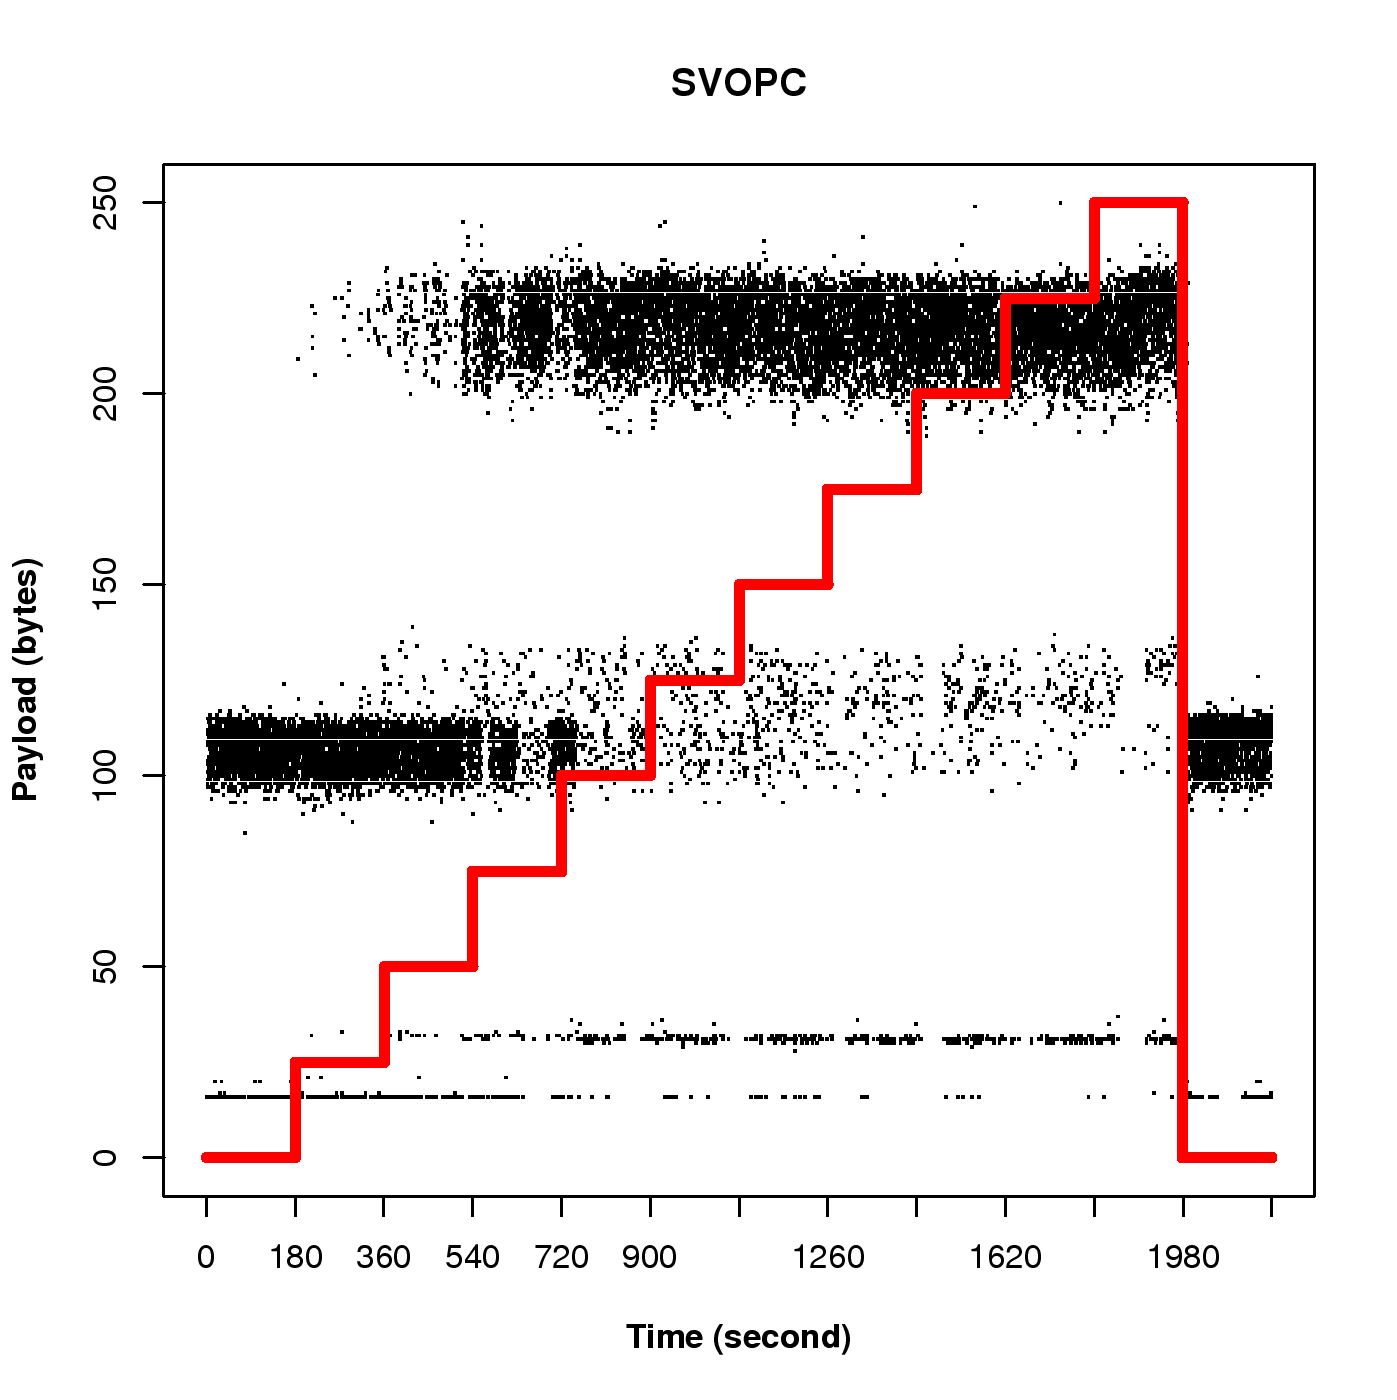
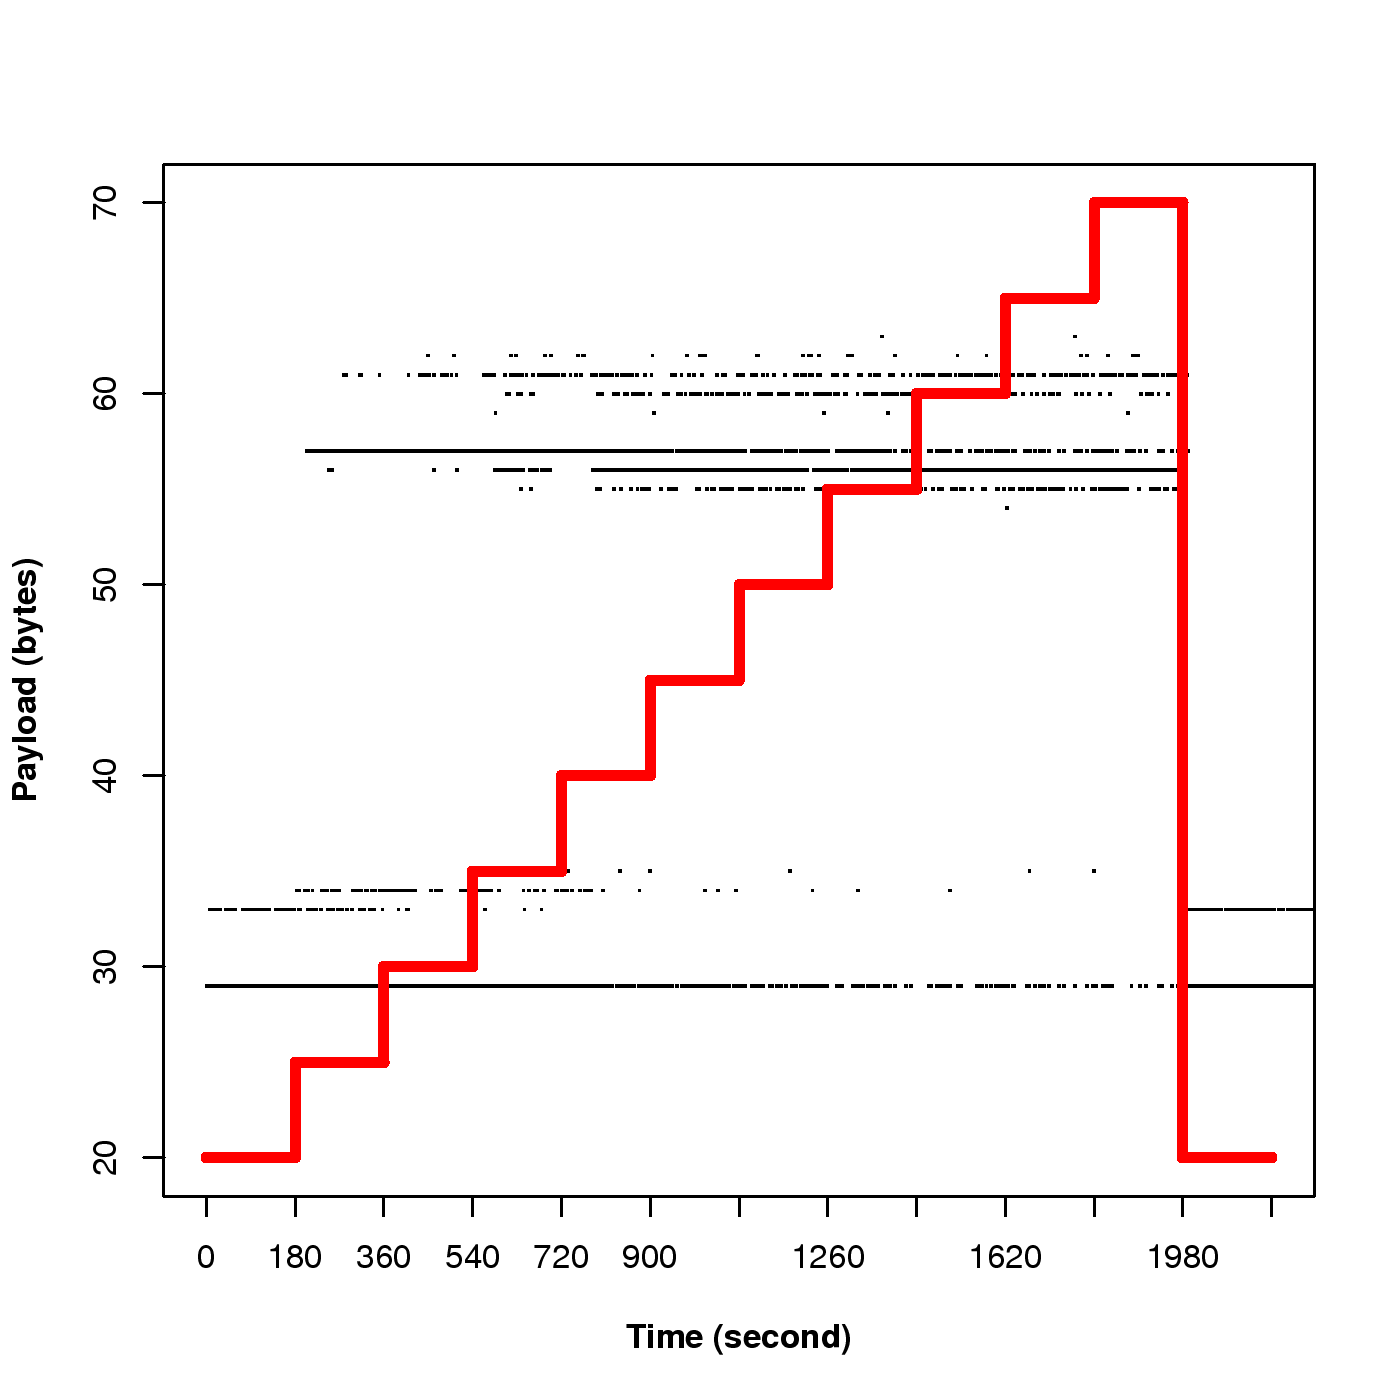
During our research, Skype has changed
to SVOPC for most PC-to-PC calls. The results of our
preliminary experiments (Fig. 11) show that Skype's current
redundancy control mechanism is much the same as that used in previous
releases. This is consistent with our findings on G.729 and
iSAC, and confirms that Skype's redundancy control mechanism is probably
not codec specific.
Figure 11: The impact of network loss rate on the payload size of SVOPC packets
Acknowledgement
The authors would like to thank anonymous reviewers for their constructive
comments. This work was supported in part by grants from Intel Education
Program, Taiwan Information Security Center (TWISC) and National Science
Council of Taiwan under Contract NSC 97-2220-E-002-005, NSC
97-2220-E-002-012, NSC 97-2219-E-001-00, NSC 97-2219-E-011-006, and NSC
96-2628-E-001-027-MY3.
References
[1]
S. Baset and H. Schulzrinne, "An analysis of the Skype peer-to-peer internet
telephony protocol," in Proceedings of IEEE INFOCOM'06, Barcelona,
Spain, Apr. 2006.
[2]
P. Biondi and F. Desclaux, "Silver needle in the Skype," Amsterdam, the
Netherlands, Mar 2006.
[3]
D. Bonfiglio, M. Mellia, M. Meo, N. Ritacca, and D. Rossi, "Tracking down
Skype traffic," in Proceedings of IEEE INFOCOM'08, Phoenix, AZ,
Apr. 2008.
[4]
D. Bonfiglio, M. Mellia, M. Meo, D. Rossi, and P. Tofanelli, "Revealing
Skype traffic: when randomness plays with you," in Proceedings of
ACM SIGCOMM'07, Kyoto, Japan, Aug. 2007, pp. 37-48.
[5]
K.-T. Chen, C.-Y. Huang, P. Huang, and C.-L. Lei, "Quantifying Skype User Satisfaction," in Proceedings of ACM SIGCOMM'06, Pisa, Italy, Sep.
2006.
[6]
K.-T. Chen, C. C. Tu, and W.-C. Xiao, "OneClick: A Framework for Measuring Network Quality of Experience," in Proceedings of IEEE INFOCOM 2009,
April 2009.
[7]
S. Floyd, M. Handley, J. Padhye, and J. Widmer, "Equation-based congestion
control for unicast applications," in In Proceedings of ACM
SIGCOMM'00, Stockholm, Sweden, Aug. 2000.
[8]
E. Gilbert, "Capacity of a burst-noise channel," The Bell System
Technical Journal, vol. 39, pp. 1253-1265, SEP 1960.
[9]http://www.gipscorp.com/, Global IP Solutions.
[10]
S. Guha, N. Daswani, and R. Jain, "An experimental study of the Skype
peer-to-peer VoIP system," in Proceedings of The 5th International
Workshop on Peer-to-Peer Systems (IPTPS'06), Santa Barbara, CA, Feb. 2006,
pp. 1-6.
[11]http://support.intel.com/support/performancetools/libraries/ipp/, Intel
Integrated Performance Primitives (Intel IPP).
[12]
ITU-T Recommendation G.107, "The E-model, a computational model for use in
transmission planning," Mar. 2005.
[13]
ITU-T Recommendation P.800, "Methods for subjective determination of
transmission quality," 1996.
[14]
ITU-T Recommendation P.862, "Perceptual evaluation of speech quality
(PESQ), an objective method for end-to-end speech quality assessment of
narrow-band telephone networks and speech codecs," Feb. 2001.
[15]
V. Jacobson, C. Leres, and S. McCanne, tcpdump, 1989. [Online].
Available: ftp://ftp.ee.lbl.gov
[16]
J. Lindblom, "A sinusoidal voice over packet coder tailored for the
frame-erasure channel," IEEE Trans. Speech Audio Processing, 2004,
accepted.
[17]
L. Rizzo, "Dummynet and forward error correction," in In Proc. of the
1998 USENIX Annual Technical Conf.
USENIX Association, 1998.
[18]http://sox.sourceforge.net/, SoX - Sound eXchange, Swiss Army knife of sound
processing programs.
[19]
K. Suh, D. R. Figueiredo, J. Kurose, and D. Towsley, "An analysis of the
Skype peer-to-peer internet telephony protocol," in Proceedings of
IEEE INFOCOM'06, Barcelona, Spain, Apr. 2006.
[20]http://www.voiptroubleshooter.com/, Open Speech Repository.
[21]
C.-C. Wu, K.-T. Chen, Y.-C. Chang, and C.-L. Lei, "Peer-to-Peer Application Recognition Based on Signaling Activity," in Proceedings of IEEE ICC
2009, June 2009.
Footnotes:
1. http://www.tgdaily.com/content/view/38431/122/2. We did not evaluate iSAC because it is a proprietary codec of Global IP
Solutions [9]; hence, we do not have access to the source codes of its encoder and decoder, and therefore not be able to include the iSAC into the simulation.
3. Note that
the x-axes of Fig. 9(e) and
Fig. 9(f) end at 0.03. The reason is
that it is impossible to achieve a MOS score of 3.4 when the
burst ratio is 1.5 or 2 with a loss rate higher than
3%.
Sheng-Wei Chen (also known as Kuan-Ta Chen) http://www.iis.sinica.edu.tw/~swc
Last Update September 28, 2019
 (a) G.729
 (b) iSAC
 (a) G.729
 (b) iSAC
 (a) G.729
 (b) iSAC

 (a) G.711
 (b) G.729
 (a) G.711
 (b) G.729
 (a) Burst Ratio = 1
 (b) Burst Ratio = 1.5
 (c) Burst Ratio = 2
 (d) Burst Ratio = 1
 (e) Burst Ratio = 1.5
 (f) Burst Ratio = 2