Understanding The Performance of Thin-Client Gaming

Yu-Chun Chang, Po-Han Tseng, Kuan-Ta Chen†, and Chin-Laung Lei
Department of Electrical Engineering, National Taiwan University
Institute of Information Science, Academia Sinica
congo@fractal.ee.ntu.edu.tw, {pohan,ktchen}@iis.sinica.edu.tw, lei@cc.ee.ntu.edu.tw

PDF Version | Contact Us

Abstract

The thin-client model is considered a perfect fit for online gaming. As modern games normally require tremendous computing and rendering power at the game client, deploying games with such models can transfer the burden of hardware upgrades from players to game operators. As a result, there are a variety of solutions proposed for thin-client gaming today. However, little is known about the performance of such thin-client systems in different scenarios, and there is no systematic means yet to conduct such analysis.
In this paper, we propose a methodology for quantifying the performance of thin-clients on gaming, even for thin-clients which are close-sourced. Taking a classic game, Ms. Pac-Man, and three popular thin-clients, LogMeIn, TeamViewer, and UltraVNC, as examples, we perform a demonstration study and determine that 1) display frame rate and frame distortion are both critical to gaming; and 2) different thin-client implementations may have very different levels of robustness against network impairments. Generally, LogMeIn performs best when network conditions are reasonably good, while TeamViewer and UltraVNC are the better choices under certain network conditions.

1  Introduction

The centralized thin-client model offers a solution to resource-intensive applications. While applications run on a remote server, the client transmits user inputs, such as keyboard and mouse events, to the server; after processing the commands, the server returns screen updates to the client. When the server and client are connected via network communications, as shown in Figure 1, this model of computing is called thin-client computing.
The thin-client model is considered a perfect fit for online gaming for a number of reasons. Because modern games normally require tremendous computing and rendering power at the game client, deploying games with such models can transfer the burden of hardware upgrades from players to game operators. In doing so, game designers no longer need to undergo a long process testing all possible combinations of audio and video cards, and game players no longer need to worry about hardware and software compatibility and performance issues before trying out a game. Numerous startup companies, such as Games@Large [14], OnLive [3], and StreamMyGame [5], have offered thin-client solutions for online gaming. While their design and implementations may differ, the concept is the same: game software runs on the server, and players just need to install the provided thin-clients (or browser-based thin-clients) to play the games.
After examining a variety of solutions designed for thin-client gaming, we wondered which design provides the more satisfactory gaming experience to players. However, quantifying and measuring the performance of thin-client systems are difficult, partly because most such systems are closed and proprietary. Quite a few previous researchers, such as [12,[22,[21,[13], have measured the performance of thin-clients when they are used to watch video clips played at the server side. However, those existing techniques do not apply in our scenario, because they do not take the interactive nature of gaming into consideration. To the best of our knowledge, this paper is the first work to quantify the performance of thin-clients on gaming.
thinclient.png
Figure 1: The thin-client computing model
In this paper, we propose a methodology for quantifying the performance of thin-clients on gaming, even for those thin-clients which are close-sourced. Taking a classic game, Ms. Pac-Man, and three popular thin-clients, LogMeIn [2], TeamViewer [7], and UltraVNC [8], as examples, we present a case study and derive the following conclusions:
  1. Display frame rate and frame distortion at the client side are both critical to gaming performance, where the frame rate is a much more important performance factor when designing a good thin-client for gaming (cf. Figure 7).
  2. Different thin-client implementations may have very different levels of robustness against network impairments (cf. Figure 8). For example, TeamViewer is extremely robust to network delay, packet loss, and small bandwidth, while the performance of LogMeIn and UltraVNC are highly dependent on network conditions. In general, network delay is the most essential dimension among the factors we studied in affecting gaming performance.
  3. Different thin-clients may excel in different network conditions. If network conditions are reasonably good (i.e., network delays shorter than 200 ms and loss rates smaller than 5%), LogMeIn obviously performs better than the two other programs for gaming. However, TeamViewer and UltraVNC are winners under some certain network conditions (cf. Figure 9).
In this work, our contributions are two-fold: 1) we propose a methodology for quantifying the performance of thin-clients on gaming; 2) with a case study, we show that it is feasible to measure and compare different thin-client implementations even when they are close-sourced. We hope the proposed methodology will serve as a starting point to provide players an always-pleasant gaming experience via the thin-client solution.
The remainder of this paper is organized as follows. Section II describes related works in the area of measuring thin-client performance. In Section III, we describe our experiment setup and methodology for extracting two independent factors as frame-based metrics. In Section IV, we propose a frame-based QoE model to derive a user's score by frame-based metrics, a frame rate prediction model to examine what network factors have significant impact on thin-client systems, and a network-based QoE model to evaluate three thin-client systems. Finally, Section V states our conclusions.

2  Related Work

Currently, there are several existing papers that measure the performance of thin-client systems. Using slow-motion benchmarking, in [18], the authors measured performance by capturing network packet traces between a thin-client and its corresponding server, during the execution of a slow-motion version of a conventional benchmark application. By using this technique, the authors measured the performance of popular thin-client systems such as Citrix [1], RDP [9], VNC [20], and Sun Ray [6]. Their results showed that slow-motion benchmarking provides far more accurate measurements than conventional benchmarking approaches.
Similarly, other authors have used the same technique in a WAN environment [15,[16] to determine the impact of WAN latency on thin-client systems. The results showed that although using thin-client computing in a wide-area network environment can deliver acceptable performance, performance varies widely among different thin-client systems, and not all systems are suitable for this environment. The authors also characterized and analyzed the different design choices in various thin-client systems and explained which of these choices should be selected for supporting wide-area thin-client computing.
exp.png
Figure 2: The experiment setup for thin-client performance measurement

3  Experiment methodology

In this section, we describe the experiment setup, present the procedure for analyzing frame-based metrics from three thin-client systems under various network scenarios, and summarize our experiment results.
frame.png
Figure 3: Methodology for measuring frame-based metrics based on video recordings at both the server and client

3.1  Experiment Setup

As depicted in Figure 2, we first set up three machines. On one machine we installed a game client with the ICE Pambush 3 [17], a Java-based game bot [10]. The bot is used to simulate real game play in the game client to automatically play the well-known Ms. Pac-Man game for players. In the experiment, we use three different kinds of thin-client systems, LogMeIn, TeamViewer and UltraVNC. To evaluate the thin-client systems under different network QoS, we set up another FreeBSD 7.0 machine as a router, using dummynet to control the patterns of traffic flows passing through the thin-client systems. During game play, the bot detects positions of Pac-Man and enemies on the screen, controls Pac-Man through a maze, and eats pac-dots to get points. If an enemy touches Pac-Man, a player loses a life. A player has three lives in each round. The game calculates points and records the final score for each round. We used the final score as a metric to represent the performance of each player.
During the experiment, we used the CamStudio program to record the screen of the game separately on both the server and the client machines. We recorded each round on both sides simultaneously and saved the videos using the Microsoft Video 1 codec format with 200 frames per second. To evaluate the performance of thin-client systems, in the next subsection, we will compare both recorded videos to extract two independent factors as performance metrics.
By configuring dummynet on the router, we can control the network delay, bandwidth, and the loss rate between thin-client systems. Since players use thin-client systems to play games on servers, we can examine how a player's performance changes under different network QoS. In this paper, we use the following settings: network delay (0, 100, and 200 ms), loss rate (0%, 2.5%, and 5%), and bandwidth (300 and 600 Kbps; unlimited).

3.2  Frame-based Metrics Extraction

To evaluate the performance of thin-client systems, we must first determine appropriate performance metrics. Since the game play screen can represent the performance of thin-client systems, the performance metrics can be inferred from the comparisons of recorded videos from the server and client, respectively. Therefore, we define two frame-based metrics: 1) display frame rate: the average number of frames per second on the client side; and 2) frame distortion: the average of mean square error (MSE) of each frame.
The graph in Figure 3 displays the diagram of extracting frame-based metrics by comparing recorded videos of the server and client. For example, we take the F1-F7 frames. If the client only gets F1, F3, F6 frames, we can calculate two metrics as follows. First, we can find that the frame rate is the reciprocal of T6c minus T3c, where T6c and T3c are timestamps of F6c and F3c respectively. Then, frame distortion is calculated by the average of MSE of each frame. For example, the MSE difference of F1 is computed by comparing F1c and F1s.

3.3  Trace Summary

Table I summarizes the frame-based metrics of the three thin-client systems, LogMeIn, TeamViewer and UltraVNC. The results show that LogMeIn has a higher display frame rate and lower frame distortion. We then present the cumulative distribution function (CDF) of frame-based metrics in Figure 4. Notably, the figure shows that the graphical quality differs between of the three thin-client systems.
We also discover that frame-based metrics are highly related to a player's performance. As shown in Figure 5, we display the relationship between frame-based metrics and the game play scores. We add a lowess curve [11] in each graph to show the smoothness of the population in each plot with two 95% confidence band dotted curves. From this figure, we see that the frame-based metrics significantly impact a player's score. For example, when the frame rate lowers or frame distortion (MSE) increases, the scores subsequently decrease.
Table 1: Summary of the frame-based metrics of the three thin-clients
Display frame rate Frame distortion
(FPS) (MSE)
LogMeIn17.41.22418.3
TeamViewer9.7176.91227.4
UltraVNC10.625.11481.2
Overall13.559.01741.2

4  Performance Evaluation

In this section, we first propose a frame-based QoE model to derive a user's score by frame-based metrics, and then determine which frame-based metrics have a greater influence on users' performance. We then use a frame rate prediction model to examine what network factors significantly impact thin-client systems. Finally, we use a network-based QoE model to evaluate the three thin-client systems.
summary.png
Figure 4: The cumulative distribution functions of frame-based metrics
summary_score.png
Figure 5: The relationships between frame-based metrics and the score in the Ms. Pac-Man game
Table 2: Coefficients of the frame-based QoE Model
VariableCoefStd. ErrortPr \textgreater | t|
(constant)738.10208.28 3.540.001∗∗
fr100.02 13.91 7.191 ×10⁻⁸∗∗∗
log(fd)−73.16 26.70−2.740.010∗∗

4.1  Modeling QoE with Frame-based Metrics

Above, we demonstrated how a player's score is highly related to the frame-based metrics in Section  III-C. From this result, we develop a frame-based QoE model based on these frame-based metrics to determine users' performance. Using an ordinal linear regression approach, our frame-based QoE model predicts a user's score by the two given metrics. Our frame-based QoE model computes a user's score by

(costant) + coeflog(fd)·log(fd) +
coeffr·fr,
(1)
where fd denotes frame distortion, and fr denotes display frame rate. The coefficients are listed in Table II.
To evaluate the model's adequacy, we show both the actual and the predicted score in Figure 6. The line on the graph shows that the predicted scores fully match the actual scores. The R2 value of the regression model is as high as 0.72, which indicates that the model fits the original data very well. Therefore, we conclude that our frame-based QoE model had high credibility to predict user scores.
For evaluating frame-based metrics, we adopt a QoE degradation approach. Using the optimal user's score as a criterion, QoE degradation indicates how frame-based metrics contributes to a user's score. For example, if QoE degradation of the display frame rate is greater than the QoE degradation of frame distortion, we can claim that the display frame rate is more influential on users' performance than frame distortion.
We compute the QoE degradation by calculating the difference between the optimal user's score and the predicted user's score. First, we summarize the best score from the experiment set as the optimal user's score. We then predict the user's score by keeping one frame-based metric for evaluation, while setting other frame-based metrics to the best score. For example, if we want to evaluate the display frame rate, we can predict the user's score by maintaining the display frame rate, while setting other frame-based metrics to the best score. We then obtain the degradation of the display frame rate by using the optimal user's score minus the predicted user's score.
Figure 7 displays the results of the QoE degradation of frame-based metrics. The figure shows how frame rate has a greater influence on users' performance. The QoE degradation of display frame rate is around 1400, which is higher than that of frame distortion. Thus, we can conclude that frame rate is the major factor influencing users' performance in thin-client systems.

4.2  Modeling with Network Metrics

After determining the importance of the display frame rate on users' performance in thin-client systems, we then use this measure to help determine what network conditions significantly impact thin-client systems. Taking the display frame rate as the performance of thin-client systems, we consider three network factors: network delay, network loss rate and network bandwidth. Figure 8 depicts the display frame rate of the thin-client systems under these network conditions. The figure shows that both network delay and network bandwidth have greater influence on the display frame rate in LogMeIn and UltraVNC. If network delay lengthens or bandwidth lowers, display frame rate values deteriorate sharply.
test_perf6_pred.png
Figure 6: Comparison of the actual and predicted scores in the frame-based QoE model
degradation_all.png
Figure 7: The average QoE degradation due to individual frame-based metrics
app_fr.png
Figure 8: The display frame rates of thin-clients in different network conditions
In order to quantify the effect of network conditions on thin-client systems, we propose a frame rate prediction model. Here, the model uses the display frame rate to measure the performance of thin-client systems. Thus, our frame rate prediction model computes the display frame rate by

(costant) + coefapp1·app1 + coefapp2·app2 +
coefdl·dl + coefdt·dt + coefdu·du +
coefll·ll + coeflt·lt + coeflu·lu +
coefbl·bl + coefbt·bt + coefbu·bu,
(2)
where app1, app2 denote the three kinds of thin-client systems; dl, dt, du are the network delays of LogMeIn, TeamViewer, and UltraVNC, respectively; ll, lt, lu are the network loss rates of LogMeIn, TeamViewer, and UltraVNC, respectively; and bl, bt, bu are the network bandwidths of LogMeIn, TeamViewer, and UltraVNC, respectively. For representing three thin-client systems by two dummy variables (app1, app2), we use (1, 0) to stand for LogMeIn, (0, 1) to stand for TeamViewer, and (0, 0) to stand for UltraVNC. The coefficients are listed in Table III.
Table 3: Coefficients of the frame rate prediction model
VariableCoefStd. ErrortPr \textgreater | t|
(constant) 4.9542.690 1.8420.080.
app1 6.6463.804 1.7470.095.
app2 7.4623.804 1.9620.063.
dl−0.0930.011−8.6472 ×10⁻⁸∗∗∗
dt 0.0080.011 0.7250.476
du−0.0530.011−4.9726 ×10⁻⁵∗∗∗
ll−0.5490.430−1.2760.216
lt 0.0590.430 0.1370.893
lu−0.3990.430−0.9280.364
bl 0.0110.003 3.0480.006∗∗
bt−0.0030.003−0.9530.351
bu 0.0090.003 2.4870.021
Here, the R2 value of the regression model is as high as 0.85, which indicates that the model has high predictability. Therefore, we conclude that our frame rate prediction model can credibly predict the performance of different thin-client systems under different network conditions. The p-value of dl, du shows that the delay of both LogMeIn and UltraVNC greatly influences users' performance. Furthermore, the p-value of bl, bu shows that the bandwidth of both LogMeIn and UltraVNC also influences users' performance. Therefore, we can conclude that both network delay and network bandwidth are important network factors that affect the performance of thin-client systems.

4.3  Comparison of Thin-Client Systems

perf10_pic_2d.png
Figure 9: The thin-clients which provide the best QoE (in terms of game play score) in different network conditions
To determine which thin-client systems can provide better performance in gaming applications, we use a user's score as a benchmark. First, we extend the frame rate prediction model in Section  IV-B and create a network-based QoE model to predict a user's score. The model predicts a user's score by the given three network factors in the three thin-client systems. The coefficients are listed in TableIV. Again, the R2 value of the regression model is as high as 0.81, which indicates that the model is highly credible in predicting a user's score within different thin-client systems under different network conditions.
After determining the model's predictability, we compare user scores of three thin-client systems to decide which systems can provide the best QoE. Figure 9 provides a summary of results, divided into delay-bandwidth, loss-bandwidth and loss-delay, under each network condition. In each part of Figure 9, the third network factor is considered as a perfect setting: 0 ms for network delay, 0% for loss rate and unlimited for network bandwidth. Each section represents the best performance among the three thin-client systems, and each thin-client system has better performance within a range of network conditions. For example, the figure notes that LogMeIn can provide better performance for users when network delay is below 250 ms, loss rate is below 25%, and bandwidth is below 6000 Kbps.
Table 4: Coefficients of the network-based QoE model
VariableCoefStd. ErrortPr \textgreater | t|
(constant) 917.659433.916 2.1150.047
app11522.212613.650 2.4810.022
app2 236.307613.650 0.3850.704
dl −9.678 1.736−5.5761 ×10⁻⁵∗∗∗
dt −3.632 1.736−2.0920.049
du −5.103 1.736−2.9400.008∗∗
ll−124.274 69.427−1.7900.088.
lt−129.056 69.427−1.8590.077.
lu −65.160 69.427−0.9390.359
bl 0.884 0.564 1.5680.132
bt 0.530 0.564 0.9390.358
bu 0.992 0.564 1.7590.093.
We also use empirical network conditions to predict the performance of the three systems. We use 300 records collected by the PingER project [4], an Internet end-to-end performance measurement project that monitors network conditions of Internet links. The main mechanism of this project is ping, the Internet Control Message Protocol (ICMP) echo mechanism, which is used to measure the round-trip time and packet loss of a link. From these ping measurements, this project makes use of the method [19] to derive TCP throughput, which we adopt as available bandwidth in our empirical network conditions. These results are also summarized in Figure 9. We use the ° symbol to represent empirical records. The figure shows that most records are under the LogMeIn sections. Therefore, we can conclude that LogMeIn can ensure good performance in gaming applications under empirical network conditions.

5  Conclusion and Future Work

In this paper, we have proposed a methodology for quantifying the performance of thin-clients on gaming, and presented a case study on three popular thin-clients, LogMeIn, TeamViewer, and UltraVNC. We show that the display frame rate and frame distortion at the client side are both critical to gaming performance. Also, we find that different thin-client implementations may have very different levels of robustness against network impairments. While different implementations may excel in different network situations, LogMeIn in general performs the best among the three implementations we studied.
In the future, we plan to extend our methodology to incorporate more thin-clients into our evaluation experiments. Meanwhile, we will make the experiment methodology generalizable to all types of games, in order to understand the performance and corresponding design decisions for thin-client gaming within different game genres.

References

[1] "Citrix." [Online]. Available: http://www.citrix.com/
[2] "LogMeIn." [Online]. Available: http://www.logmein.com/
[3] "OnLive." [Online]. Available: http://www.onlive.com/
[4] "PingER," http://www-iepm.slac.stanford.edu/pinger/.
[5] "StreamMyGame." [Online]. Available: http://www.streammygame.com/
[6] "Sun Ray." [Online]. Available: http://www.sun.com/sunray/
[7] "TeamViewer." [Online]. Available: http://www.teamviewer.com/
[8] "UltraVNC." [Online]. Available: http://www.uvnc.com/
[9] "Windows Remote Desktop Protocol (RDP)." [Online]. Available: http://msdn.microsoft.com/en-us/library/aa383015.aspx
[10] K.-T. Chen, J.-W. Jiang, P. Huang, H.-H. Chu, C.-L. Lei, and W.-C. Chen, "Identifying MMORPG Bots: A Traffic Analysis Approach," EURASIP Journal on Advances in Signal Processing, 2009.
[11] 
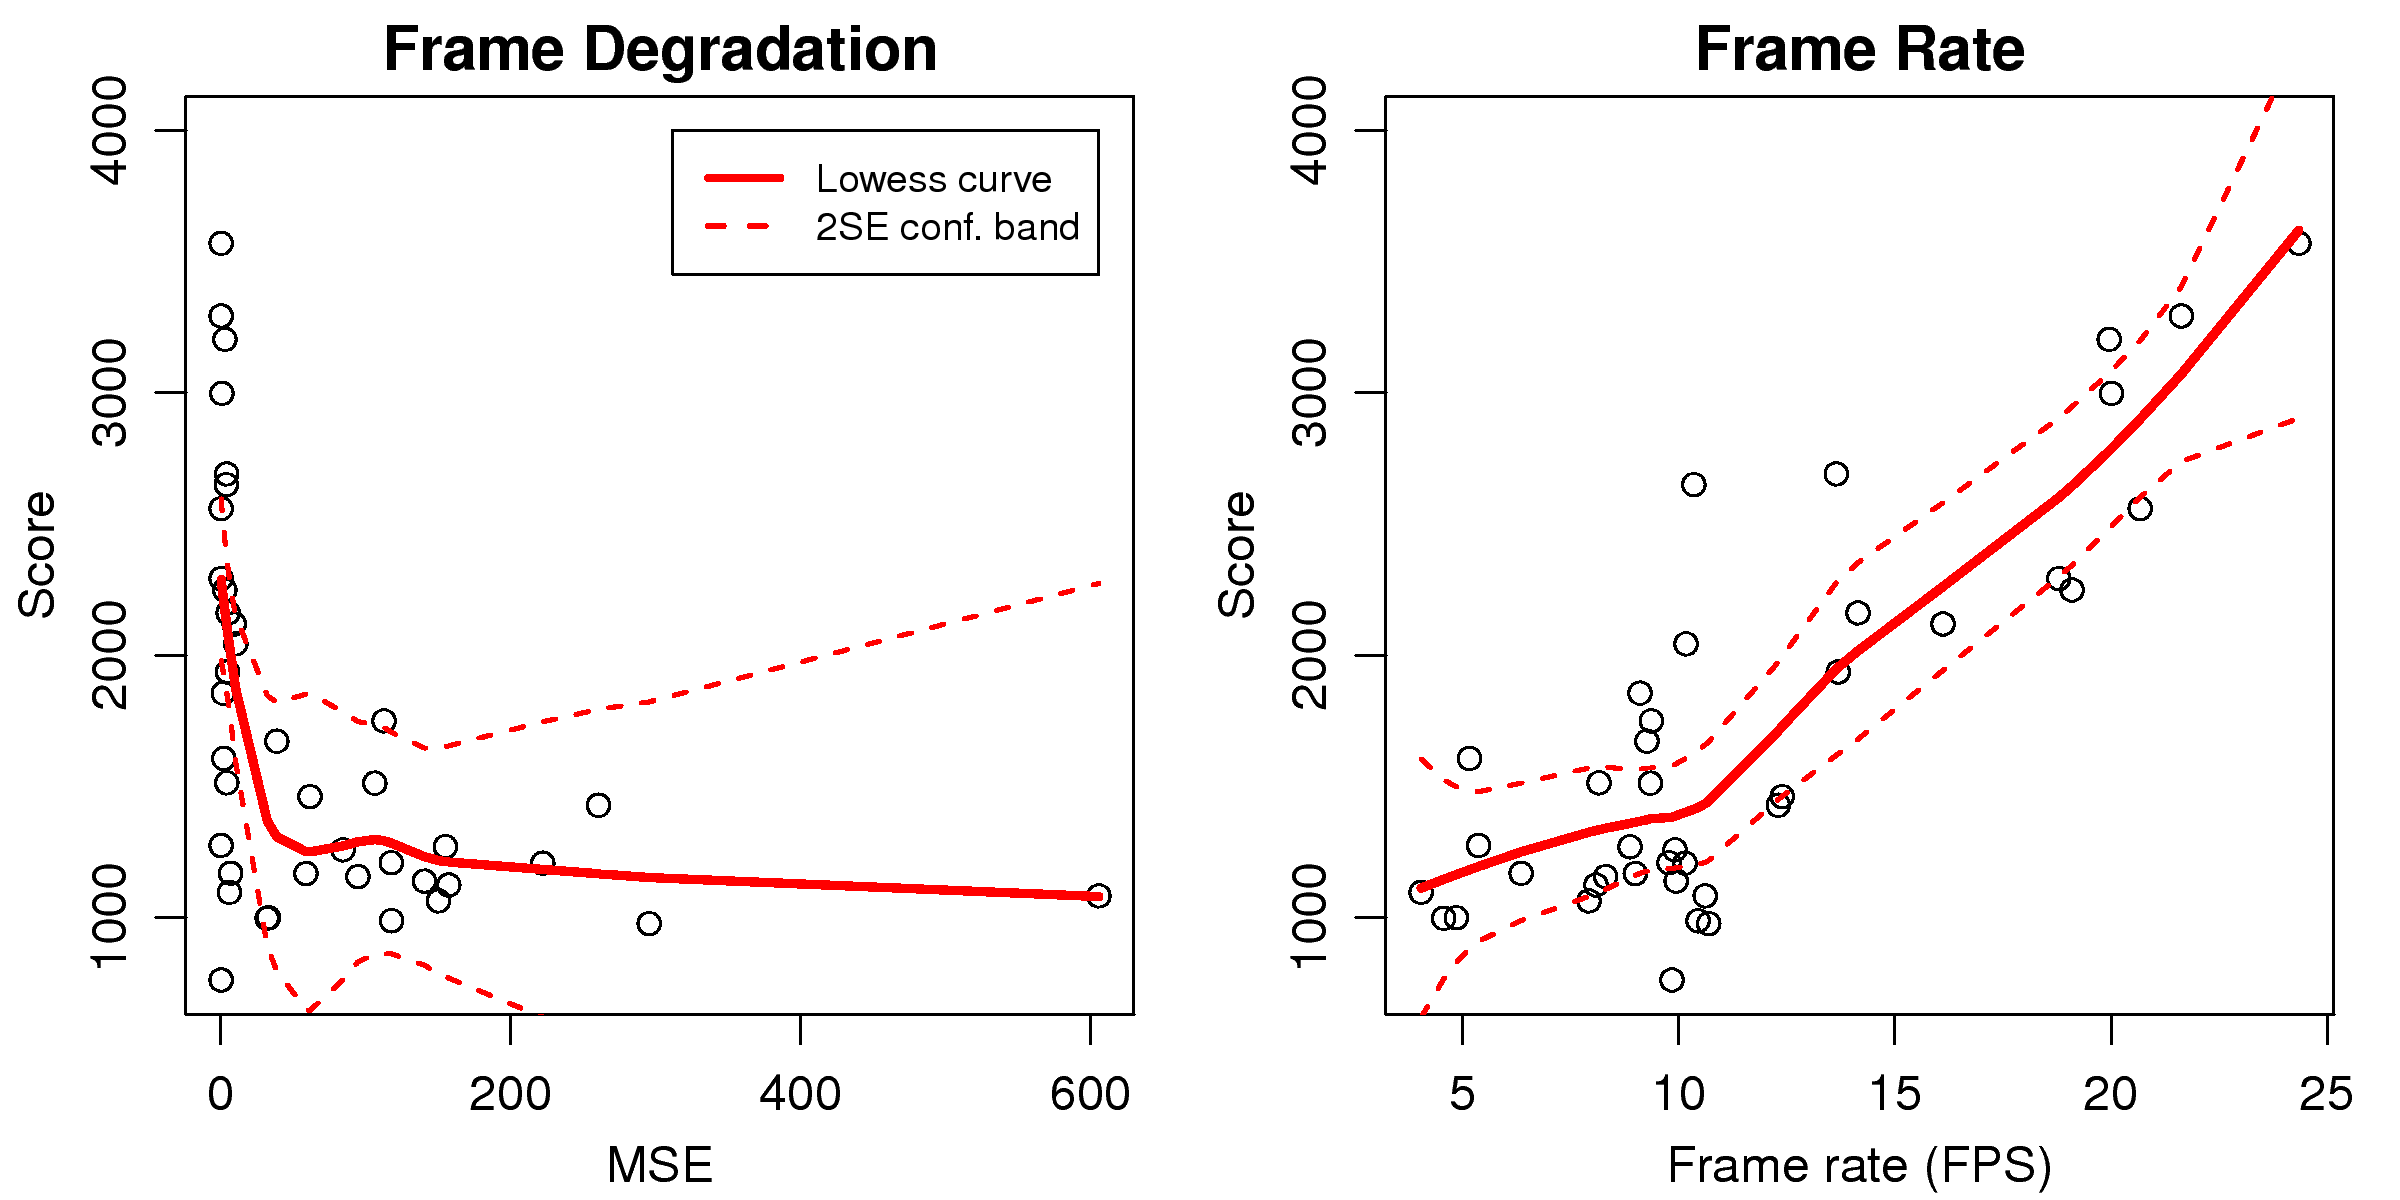
W. S. Cleveland, "Robust locally weighted regression and smoothing scatterplots," Journal of the American Statistical Association, vol. 74, no. 368, pp. 829-836, 1979.
[12] D. De Winter, P. Simoens, L. Deboosere, F. De Turck, J. Moreau, B. Dhoedt, and P. Demeester, "A hybrid thin-client protocol for multimedia streaming and interactive gaming applications," in Proceedings of the International Workshop on Network and Operating Systems Support for Digital Audio and Video, 2006.
[13] L. Deboosere, J. De Wachter, P. Simoens, F. De Turck, B. Dhoedt, and P. Demeester, "Thin client computing solutions in low-and high-motion scenarios," in International Conference on Networking and Services, 2008.
[14] A. Jurgelionis, P. Fechteler, and P. Eisert, "Platform for distributed 3D gaming," International Journal of Computer Games Technology, January 2009.
[15] A. Lai and J. Nieh, "Limits of wide-area thin-client computing," ACM SIGMETRICS Performance Evaluation Review, vol. 30, no. 1, pp. 228-239, 2002.
[16] --, "On the performance of wide-area thin-client computing," ACM Transactions on Computer Systems (TOCS), vol. 24, no. 2, pp. 175-209, 2006.
[17] H. Matsumoto, T. Ashida, Y. Ozasa, T. Maruyama, and R. Thawonmas, "ICE Pambush 3," Controller description paper, http://cswww.essex.ac.uk/staff/sml/pacman/cig2009/ICEPambush 3/ICE Pambush 3.pdf.
[18] J. Nieh, S. Yang, and N. Novik, "Measuring thin-client performance using slow-motion benchmarking," ACM Transactions on Computer Systems (TOCS), vol. 21, no. 1, pp. 87-115, 2003.
[19] J. Padhye, V. Firoiu, D. Towsley, and J. Kurose, "Modeling TCP throughput:a simple model and its empirical validation," in Proceedings of the ACM SIGCOMM Conference on Applications, Technologies, Architectures, and Protocols for Computer Communication, 1998, pp. 303-314.
[20] T. Richardson, Q. Stafford-Fraser, K. Wood, and A. Hopper, "Virtual network computing," IEEE Internet Computing, vol. 2, no. 1, pp. 33-38, 2002.
[21] P. Simoens, P. Praet, B. Vankeirsbilck, J. De Wachter, L. Deboosere, F. De Turck, B. Dhoedt, and P. Demeester, "Design and implementation of a hybrid remote display protocol to optimize multimedia experience on thin client devices," in Telecommunication Networks and Applications Conference, 2008, pp. 391-396.
[22] B. Vankeirsbilck, P. Simoens, J. De Wachter, L. Deboosere, F. De Turck, B. Dhoedt, and P. Demeester, "Bandwidth optimization for mobile thin client computing through graphical update caching," in Telecommunication Networks and Applications Conference, 2008, pp. 385-390.

Footnotes:

1. This work was supported in part by the National Science Council under the grants NSC99-2221-E-002-109-MY3 and NSC99-2221-E-001-015.
2. †. Corresponding author. Address: Institute of Information Science, Academia Sinica, No. 128, Sec. 2, Academia Rd, Nankang, Taipei 115, Taiwan. Tel.: +886-2-27883799; fax: +886-2-27824814.


Sheng-Wei Chen (also known as Kuan-Ta Chen)
http://www.iis.sinica.edu.tw/~swc 
Last Update September 28, 2019