[1]
M. Haruki,
Afternoon at Langerhan's Island, ser. Shinchosha
series. Shinchosha Publishing, 1990.
[2]
J. Hyun,
Breaking the Bamboo Ceiling: Career Strategies for
Asians. HarperCollins, 2005.
[3]
Y. Li, "The pursuit of happiness," Global Times, 5 Jan. 2015.
[4]
M. Lazer-Walker, "Designing Elegant Mobile Games," objc.io, Nov.
2014.
[5]
"The global games market reaches $99.6 billion in 2016," Newzoo, 21 Apr.
2016.
[6]
L. Bridgestock, "Differences in average working hours around the world," QS
Quacquarelli Symonds, 12 Mar. 2014.
[7]
C. Heart, "Why cherish fragmentary time?" GeekPark.net, 5 Aug. 2013.
[8]
S. Nanda Kumar, "Developing an alternate pricing model for mobile games," pp.
1-75, 2016.
[9]
S. Perez, "App Annie Integrates with Google Analytics, Launches
Free In-App Analytics for Developers," App Annie, 9 Jul. 2015.
[10]
"Consumer Barometer," Google, Apr. 2016.
[11]
"World Values Survey," World Values Survey Association, Jan. 2015.
[12]
G. Blalock, D. R. Just, and D. H. Simon, "Hitting the jackpot or hitting the
skids: Entertainment, poverty, and the demand for state lotteries,"
American Journal of Economics and Sociology, vol. 66, no. 3, pp.
545-570, 2007.
[13]
Y.-H. Lee and D. Y. Wohn, "Are there cultural differences in how we play?
examining cultural effects on playing social network games,"
Computers
in Human Behavior, vol. 28, no. 4, pp. 1307-1314, 2012.
[14]
"Searching for a little happiness," The Taipei Times, 2 Mar. 2014.
[15]
A. Y.-L. Chong, F. T. Chan, and K.-B. Ooi, "Predicting consumer decisions to
adopt mobile commerce: Cross country empirical examination between china and
malaysia,"
Decision Support Systems, vol. 53, no. 1, pp. 34-43,
2012.
[16]
H. Xie, S. Devlin, D. Kudenko, and P. Cowling, "Predicting player
disengagement and first purchase with event-frequency based data
representation," in
IEEE Conference on Computational Intelligence and
Games (CIG), 2015, pp. 230-237.
[17]
R. Sifa, F. Hadiji, J. Runge, A. Drachen, K. Kersting, and C. Bauckhage,
"Predicting purchase decisions in mobile free-to-play games," in
Eleventh Artificial Intelligence and Interactive Digital Entertainment
Conference, 2015.
[18]
E. B. Seufert,
Freemium economics: Leveraging analytics and user
segmentation to drive revenue.
Elsevier, 2013.
[19]
B.-W. Park and K. C. Lee, "Exploring the value of purchasing online game
items,"
Comput. Hum. Behav., vol. 27, no. 6, pp. 2178-2185, Nov.
2011.
[20]
D. Draganov,
Freemium Mobile Games: Design & Monetization. CreateSpace Independent Publishing Platform,
2014.
[21]
E. J. Jeong and D. J. Kim, "Definitions, key characteristics, and generations
of mobile games,"
Encyclopedia of mobile computing and commerce, pp.
185-189, 2007.
[22]
D. Anderson,
World Gone Mobile Apps. CreateSpace Independent Publishing Platform, 2015.
[23]
"World Bank Open Data," The World Bank Group, Jan. 2014.
[24]
"Compare countries on just about anything!" Nation Master, Jan. 2013.
[25]
"Unemployment Rate," Trading Ecomomics, Dec. 2015.
[26]
Wikipedia, "List of minimum wages and annual leave by country," Wikimedia
Foundation, Dec. 2013.
[27]
"Average annual hours actually worked per worker," Organisation for Economic
Co-operation and Development, Jan. 2016.
[28]
"The Association of Religion Data Archives - Quality Data on
Religion," The Association of Religion Data Archives, Jan. 2013.
[29]
"Human Development Data (1980-2015)," United Nations Development
Programme, 15 Nov. 2015.
[30]
"The Happy Planet Index measures what matters," New Economics
Foundation, Jul. 2015.
[31]
The World Factbook. Central
Intelligence Agency, 2016.
[32]
"Countries in the world by population (2016)," Worldometers, Jan. 2016.
[33]
ITU - 2015 Global ICT Development Index. International Telecommunication Union, 2015.
[34]
"The Connected Consumer-Google Public Data Explorer 2016," TNS
Infratest Germany, Google Publice Data, 10 Jun. 2015.
[35]
Device Atlas. Afilias
Technologies Ltd (dotMobi), Feb. 2016.
[36]
A. Chowdhry, "Average iPhone price increases to $687 and android decreases
to $254." Forbes Media LLC, 3 Feb. 2015.
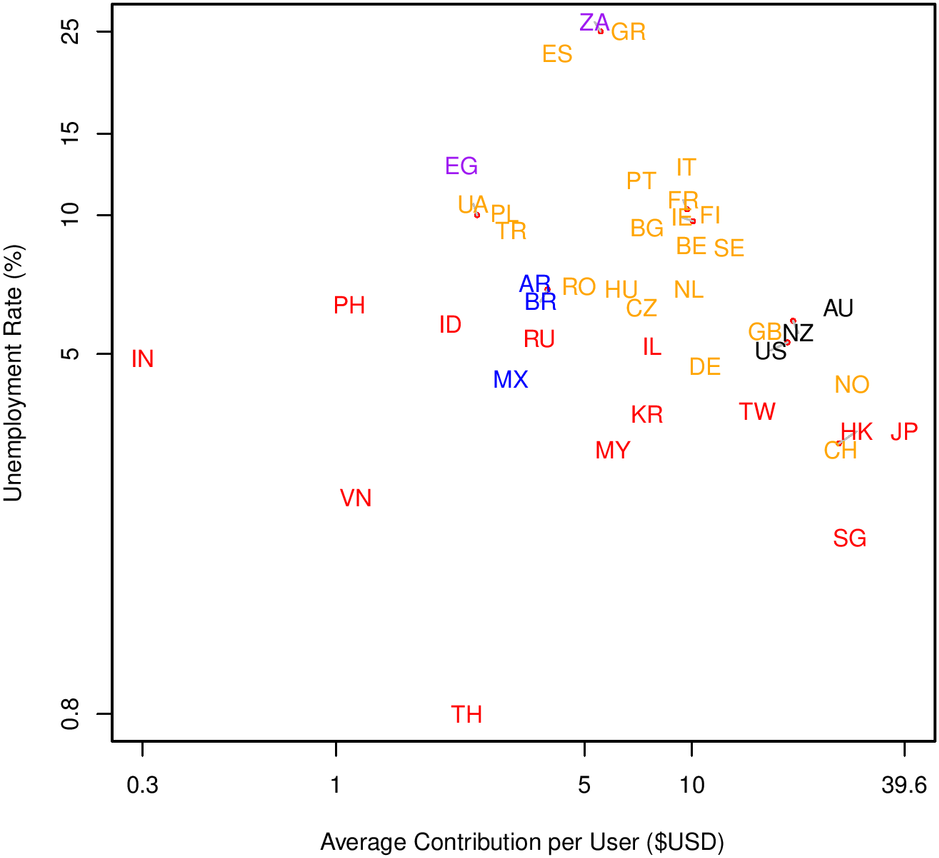
 (a) App Store
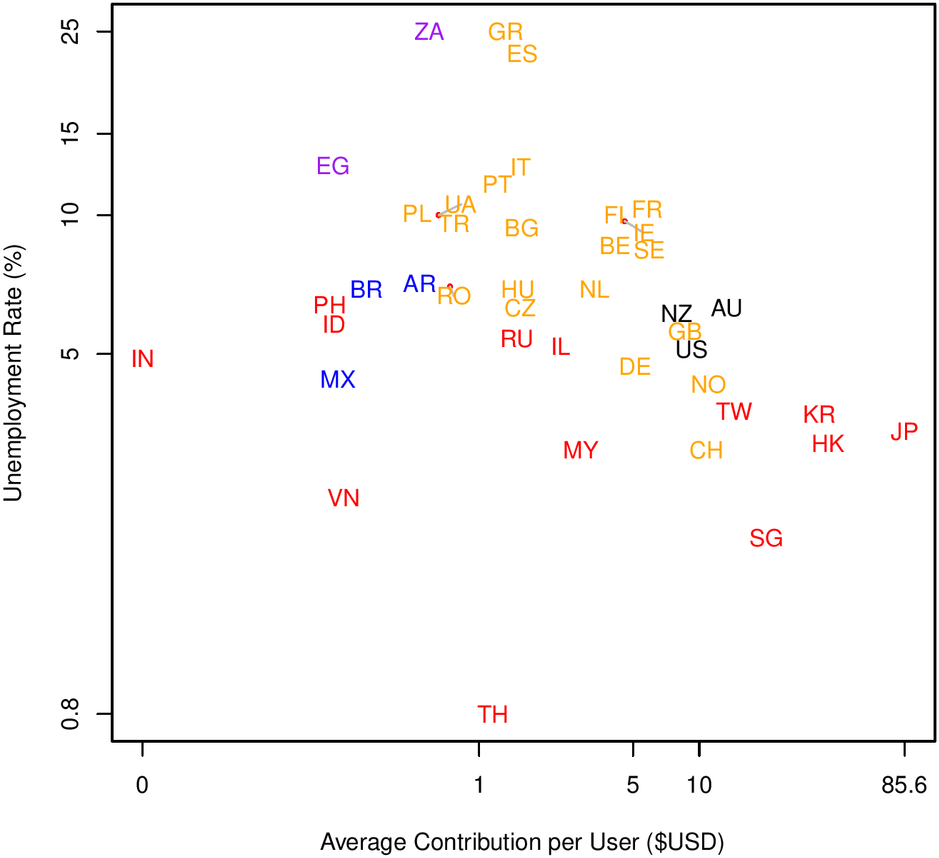
 (b) Google Play