From the perspective of game system designers, players' behavior is one of the most important factors they must consider when designing game systems. To gain a fundamental understanding of the game play behavior of online gamers, exploring users' game play time provides a good starting point. This is because the concept of game play time is applicable to all genres of games and it enables us to model the system workload as well as the impact of system and network QoS on users' behavior. It can even help us predict players' loyalty to specific games.
In this paper, we present the World of Warcraft Avatar History (WoWAH) dataset, which comprises the records of 91,065 avatars. The data includes the avatars' game play times and a number of attributes, such as their race, profession, current level, and in-game locations, during a 1,107-day period between Jan. 2006 and Jan. 2009. We believe the WOWAH dataset could be used for various creative purposes, now that it is a public asset of the research community. It is available for free download at http://mmnet.iis.sinica.edu.tw/dl/wowah/.
Game session, MMOG, MMORPG, User behavior
1 Introduction
Massively multiplayer online games (MMOGs) are a popular type of entertainment on the Internet. In [26], it is reported that over 55% of Internet users are also online gamers, while the number of MMOG subscribers worldwide grew to 21 million in 2010. For the popular game StarCraft II1, one of the biggest real-time strategy (RTS) titles in 2010, the average number of active players is 500,000 per day; while the number of players listed on the Battle.net scoreboard2 is around 1.7 million [1].
Among the various types of MMOGs, massively multiplayer online role-playing games (MMORPGs) are the most popular genre, with a 95% share of the MMOG market [22]. According to [25], the MMORPG market is currently worth in excess of US$6 billion worldwide, with an anticipated value of US$8 billion by 2014.
From the perspective of game system designers, players' behavior is one of the most important factors they must consider when designing game systems. However, understanding player behavior is not a trivial task because there are so many types of player behavior to be considered, and the behavior is usually game-dependent. For example, how players control troop movements in real-time strategies and how players interact with each other (e.g., chatting, trading, or fighting) in role-play games may be important issues in some game genres, but not in others. Moreover, some types of player behavior are more general than others. For example, how players react to imperfect network conditions is a general problem in all real-time network games, so it is a concern for all game designers.
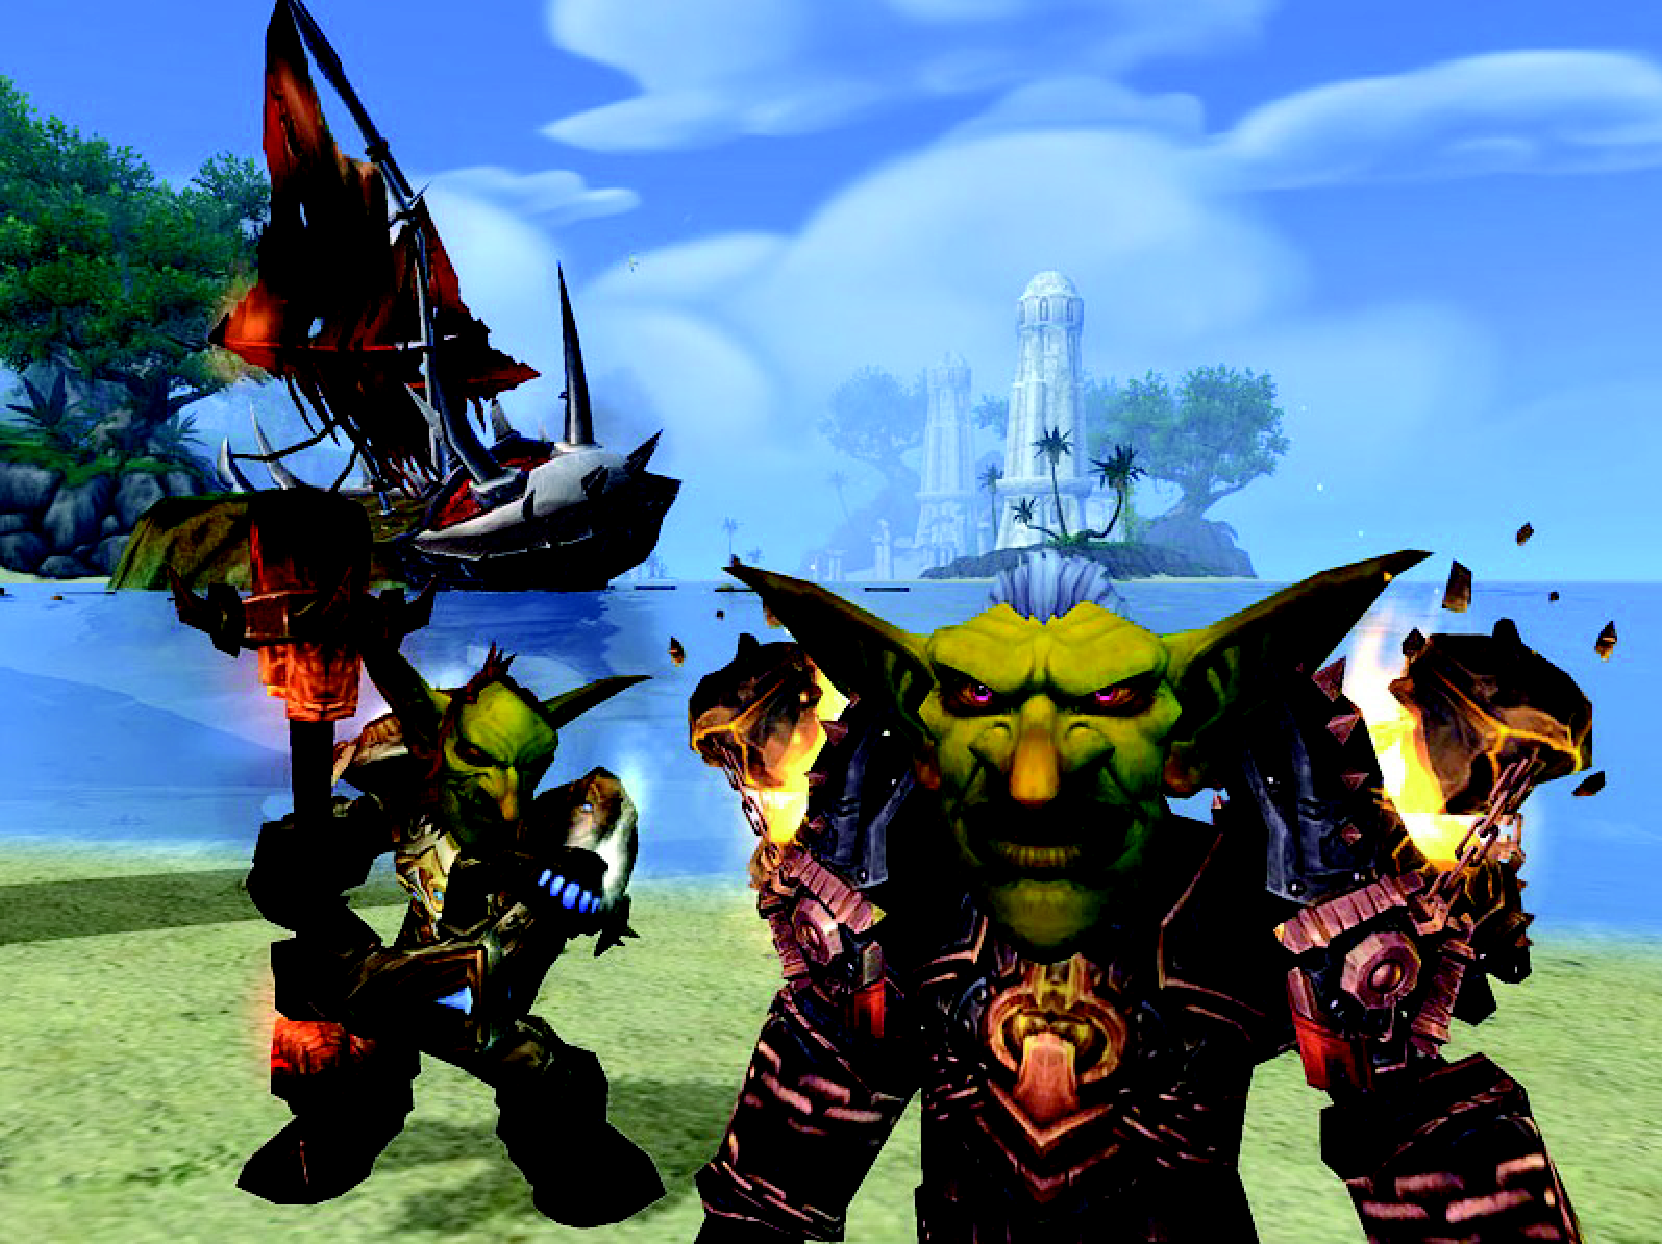
Figure 1: A screenshot of World of
Warcraft.
To gain a fundamental understanding of users' online game play behavior, we believe that exploring users' game play time provides a good starting point because game play time is the most general type of player behavior; thus, it is applicable to all genres of games. Game play time refers to all the information related to the time between when a player logs into a game and the time he logs out. How can information about game play time benefit the research community? The following list describes some of the uses of such information.
System workload modeling/prediction: The arrival and departure process of game players determines the workload of game systems [7,9]. Thus, if we could model and even predict game players' arrival and departure events, we could improve the provisioning and allocation of system resources, and simultaneously maintain satisfactory QoS (Quality of Service) levels [3,5].
System QoS modeling/prediction: The early departure of game players may indicate that a game system is providing less-than-satisfactory QoS. By combining the information about system- and network-level QoS with game play time data, we can model the impact of QoS factors on player departure processes and improve system designs based on such models [4].
Player loyalty modeling/prediction: Players may quit a game because they are dissatisfied with the game's design or content, or possibly due to cheating by other players. In other words, to some degree, quitting behavior may indicate low user satisfaction. Thus, we may infer a player's loyalty to a particular game based on his game play history [18,19].
In this paper, we present the World of Warcraft Avatar History (WoWAH) dataset, which provides information about the game play time of 91,065 avatars and a number of their attributes. We focus on the World of Warcraft (WoW) because it is the most popular MMORPG in the world (as of December 2010). According to MMOData.net [8], the game's 12 million subscribers accounted for 62% of the MMOG market in March 2010 [14]. Because of the game's popularity, it has motivated studies by researchers in various academic fields, such as psychology [24], social interaction [6,15], and game play behavior [2,9,10,11,16].
The WoWAH dataset comprises continual observations of the status of 91,065 avatars over a 3-year period (Jan. 2006 to Jan. 2009). During each observation we recorded the names of the avatars that were online and their respective attributes, including their current levels and in-game locations. Observations were made at 10-minute intervals; hence, during the 3-year period, we made approximately 157,680 observations (samples) on a WoW server. Because the samples are dense, we can extract the avatars' game play history from the 10-minute observations (i.e., if an avatar appeared in one sample but not in the subsequent one, we assumed it had logged out in the time between the two samples).
The WOWAH dataset is now publicly available at http://mmnet.iis.sinica.edu.tw/dl/wowah/.
Researchers are free to download it for their own research purposes.
In the remainder of the paper, we explain how we compiled the dataset in Section 2, and discuss its basic statistics in Section 3. We present two sample studies based on the dataset in Section 4, and then summarize our conclusions in Section 5.
2 Dataset Description
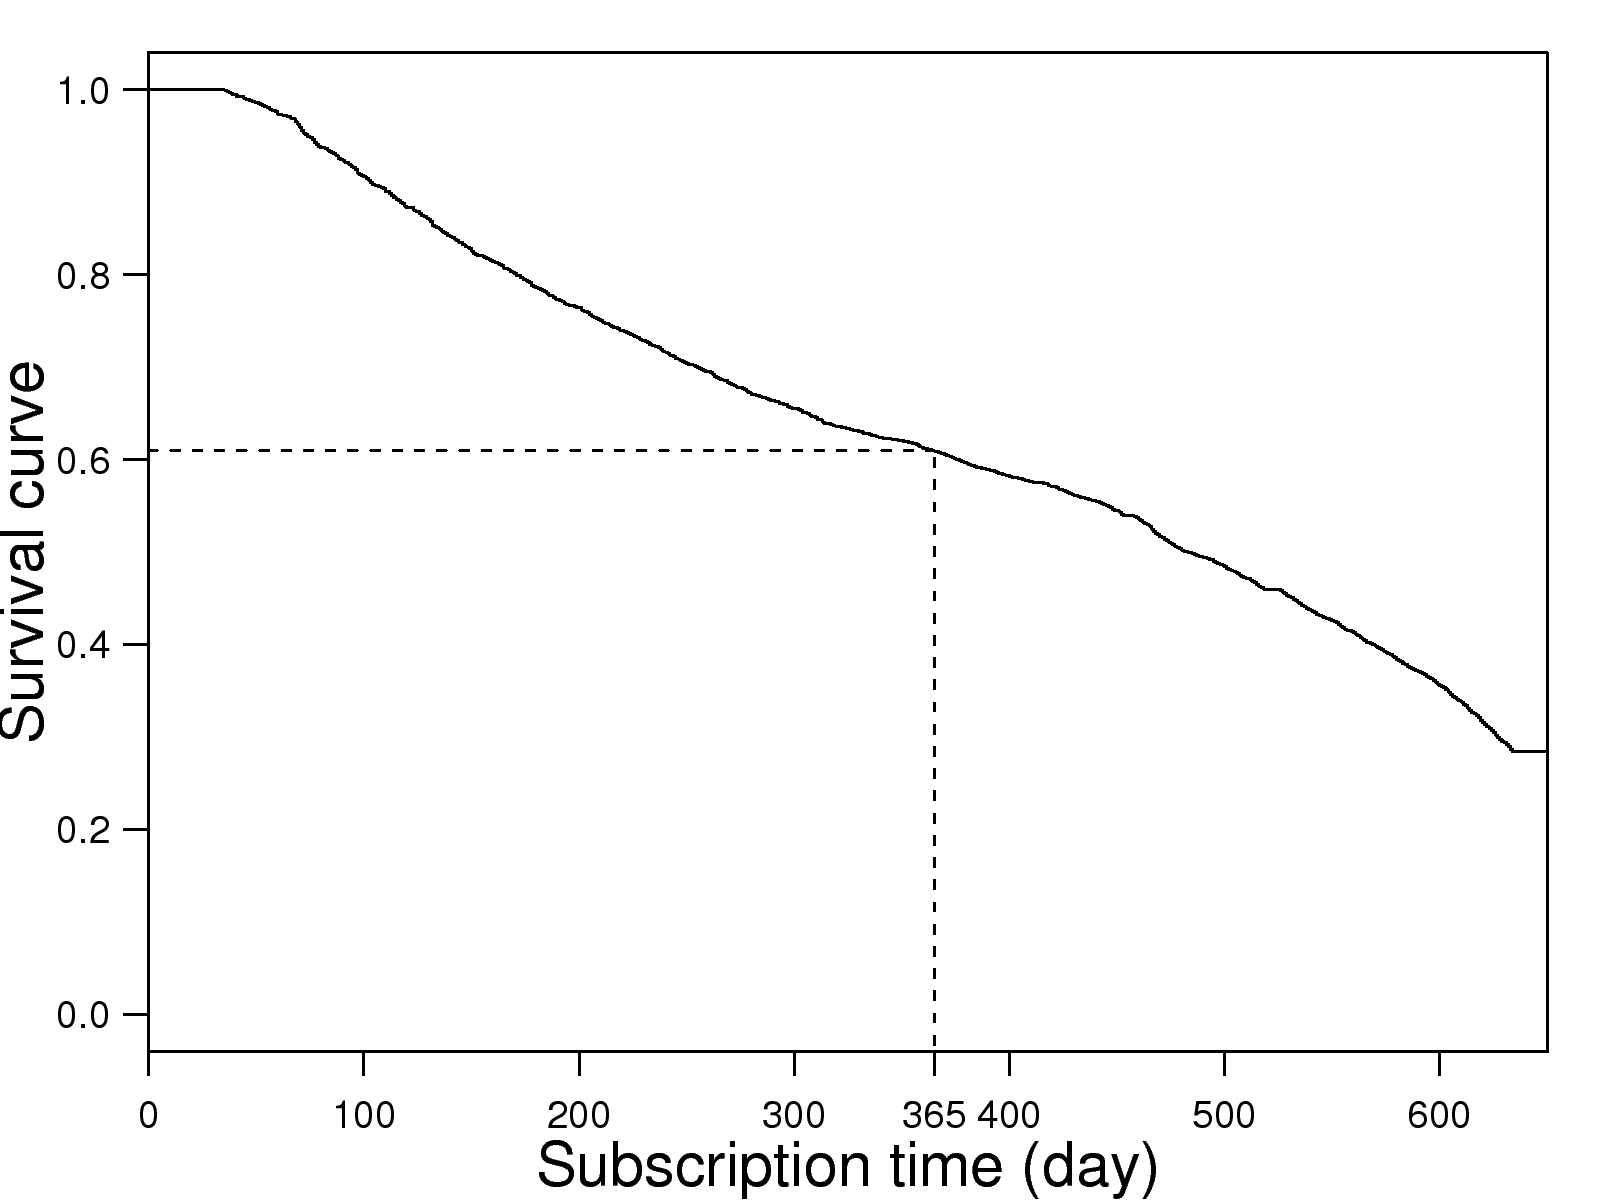
Figure 2: The survival curve of players' subscription
times.
In this section, we explain how we collected the avatars' game play history in an automated fashion. After describing the data collection methodology, we discuss the naming and format of log files, and conclude with a summary of the traces.
2.1 Data Collection Methodology
We used the who command to collect the trace at regular intervals. The command, which asks the game server to provide a list of avatars in the same faction that are currently online, is available to every player in the game; hence, anyone can obtain the game play history of all the avatars in the same faction from the server.
To collect the trace, we created a character in a World of Warcraft realm (the Light's Hope realm in Taiwan) and kept it online throughout the 3-year study period. The character was controlled by a program written in the Lua scripting language [23], which World of Warcraft uses for interface customization. Our program automatically collected a list of the online avatars every 10 minutes. If an avatar logins and logouts within 10 minutes, we may not be able to observe his re-login activity in consecutive snapshots. However, we do not think this is a significant problem because most World of Warcraft sessions are much longer than 10 minutes [17].
Because of scalability considerations, World of Warcraft servers restrict the number of avatars returned in response to a query to a maximum of 50. Thus, we have to narrow down our query ranges by dividing all the avatars into different races, professions, and levels. For example, in the initial query, we need to ask the server to list all the avatars in the Fighter class whose levels are between level 1 and level 20. Then, in the second query, we ask the server to list all the avatars in the Fighter class whose levels are between level 21 and level 40, and so on. This technique allows us to systematically list the entire set of online avatars despite the restriction of the query function.
2.2 Log File Naming
The directory structure of the dataset archive comprises two levels of sub-directories. Each sub-directory in the first level represents the traces in a season with the directory name format yyyy-fm-lm, where fm, lm, and yyyy refer, respectively, to the first month, last month, and year of the traces in the sub-directory. For example, for the traces in 2006, there are four first-level directories, namely, 2006-01-03, 2006-04-06, 2006-07-09, and 2006-10-12. Each of the second-level sub-directories contains the traces collected in a day with the directory name format yyyy-mm-dd, where mm denotes the month and dd denotes the day of the month of the traces in the directory. With a few exceptions, which we discuss shortly, there are 144 files in each second-level sub-directory. Each file contains all the information observed about the avatars online during the sampling period. The reason for 144 files is that there are 1,440 minutes in a day and we make observations every 10 minutes. The name format of the log files is hh-mm-ss, where hh, mm, and ss represent, respectively, the hour, minute, and second of the sampling time.
2.3 Log Format
A log file is composed of two arrays: Persistant_Storage and RoundInfo. All the information collected about the avatars' history is stored in the Persistant_Storage array. Each element stores the information about an avatar observed during the sampling period; thus, the number of elements is equal to the number of avatars online in that sampling interval. An element is a string that contains 11 fields separated by commas. The 11 fields are dummy, query time, query sequence number, avatar ID, guild, level, race, class, zone, dummy, dummy. The meanings and valid values of the fields are detailed in Table 2. We also provide three sample records in Table 3. The first record, which relates to the initial query, indicates that we observed an avatar with ID 467 at 23:59:39 on 01/01/2006, and the avatar was a level-1 non-guilded Orc Warrior in Orgrimmar.
2.4 Data Summary
We collected the data over 1,107 days between Jan. 2006 and Jan. 2009. During the monitored period, 91,065 avatars, and 667,032 sessions associated with the avatars were observed. Because the sampling interval was 10 minutes, there should have been 159,408 samples, each providing the status of all the avatars online during the sampling period. However, 21,324 samples were missing due to server maintenance3 and occasional client compatibility problems. As a result, the total number of samples was 138,084. In the dataset archive, the details of the missing samples are stored in the missingdata directory. To protect players' privacy, we mapped the avatars' names and guild names randomly as positive integers with a consistent mapping (i.e., the same names were always mapped to the same integers). A summary of the dataset is presented in Table 1.
In this section, we present some basic statistics derived from the dataset. By assuming that each avatar is played by one game player, we can analyze the subscription length and daily game play behavior of World of Warcraft players. We also examine the variability and regularity of the number of avatars online because the information is an important indicator of the workload on game servers.
3.1 Subscription Time
A player's subscription time denotes the length of time since he became a member of the game to the time of his last login, i.e., the player has not logged in since then. Figure 2 shows the survival function [5] of players' subscription times. According to the statistics, 60% of users will subscribe for longer than one year after their first visit, and 50% will subscribe for longer than 500 days. These figures indicate that the game is indeed very attractive, and most players seem to become addicted to its fantasy world once they are immersed in it.
3.2 Daily Game Play Activities
We also investigate gamers' daily play behavior, including the average daily play time, average daily session count, and average session play time. Note that if a gamer does not play the game for some days, we do not include those days in his average daily play time. For example, if a gamer's subscription period was one year, but he only played for 200 days, then his average daily play time was his overall play time divided by 200 days.
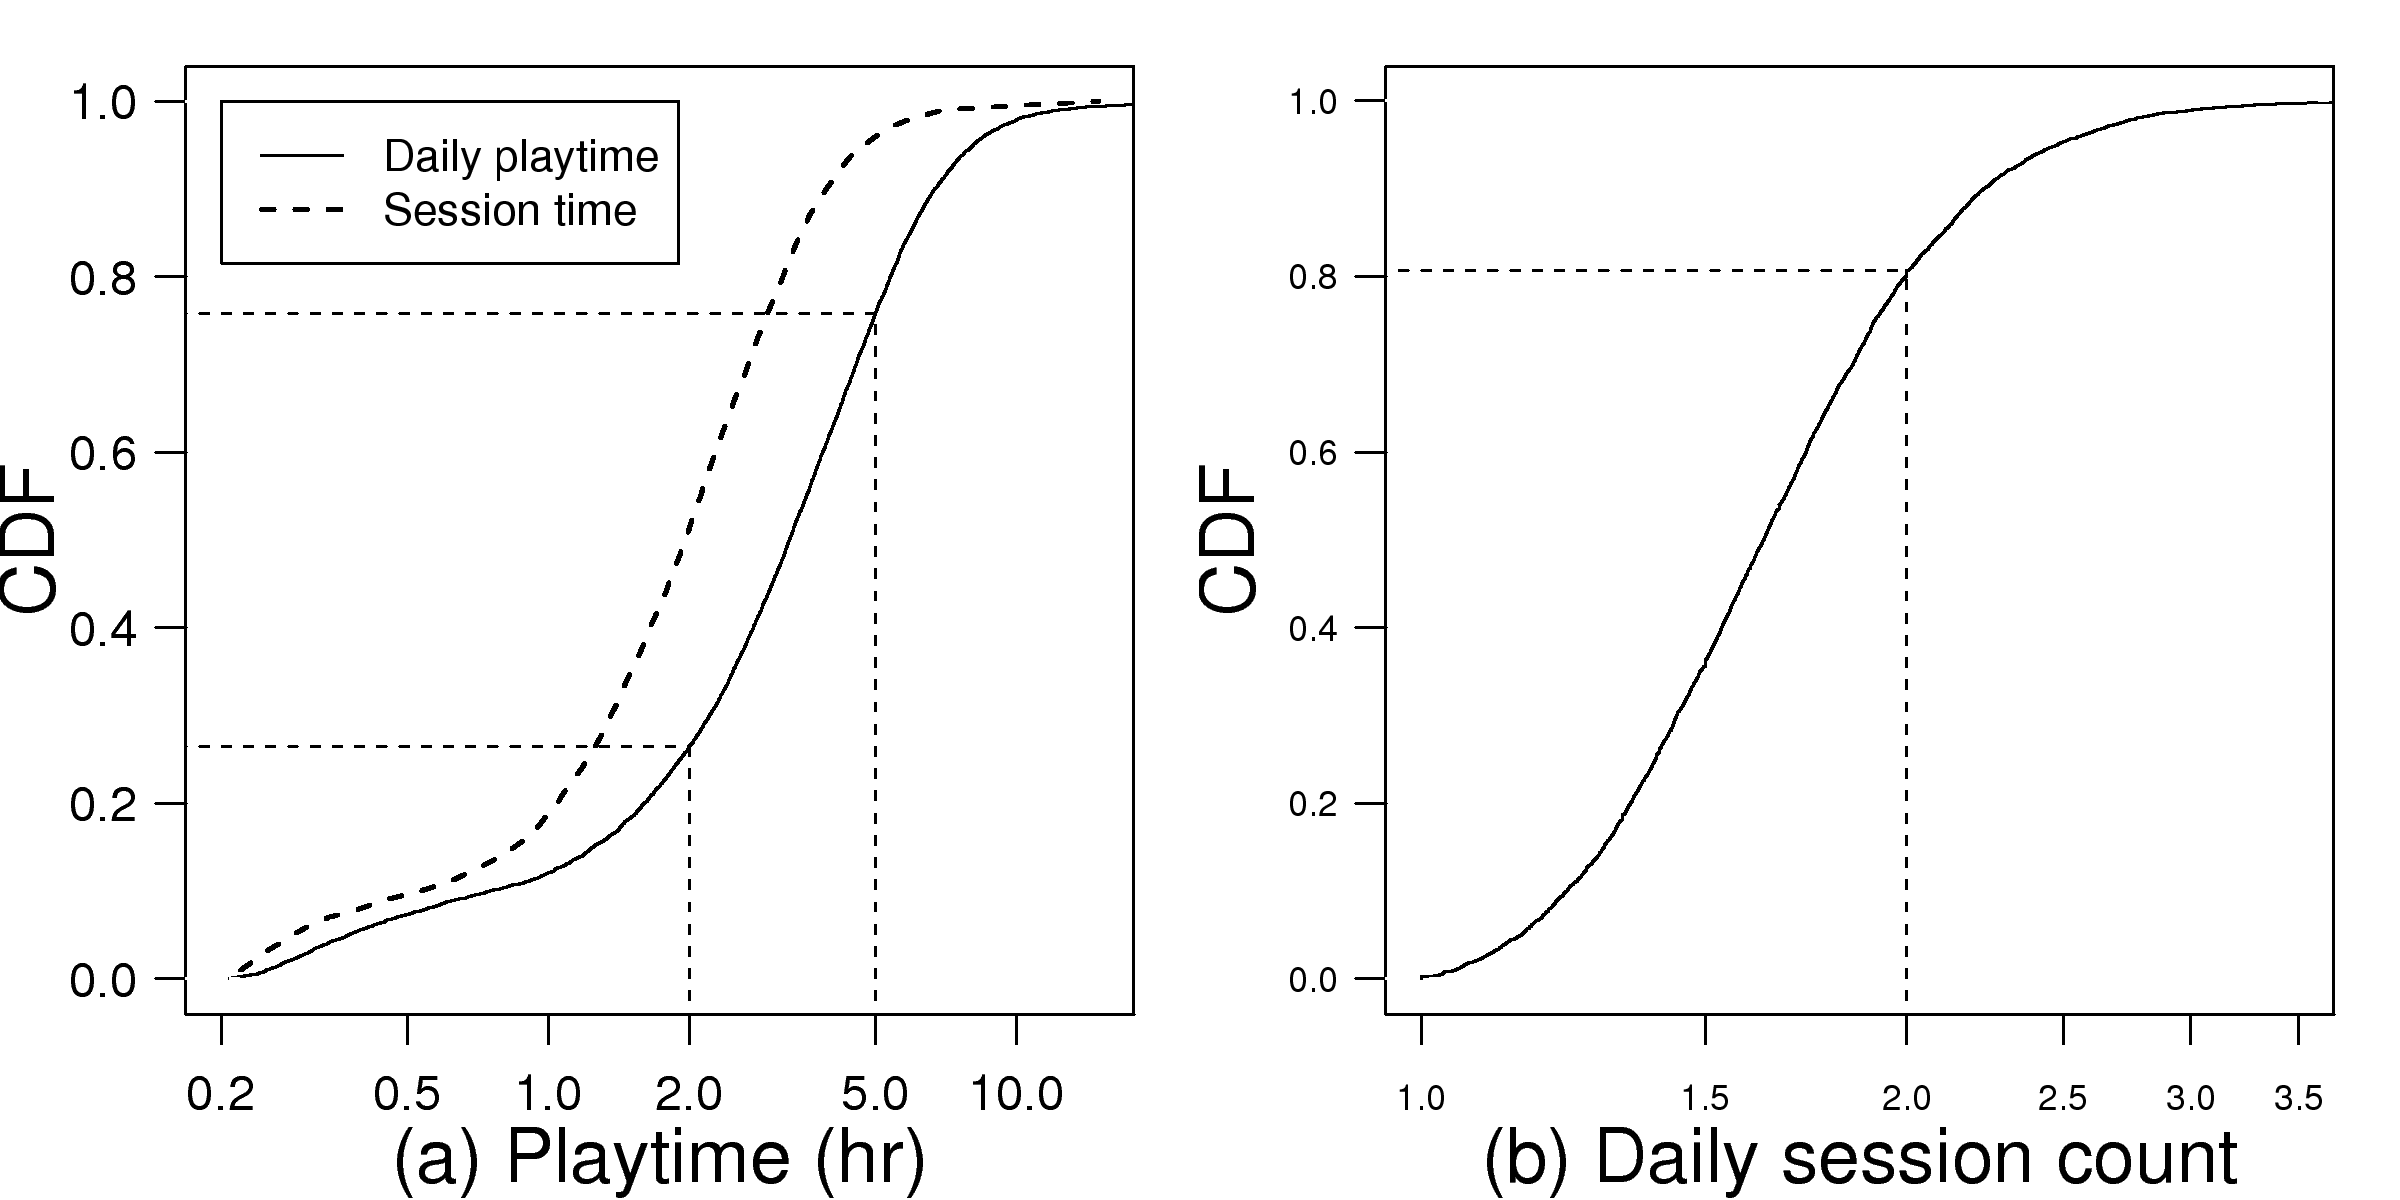
Figure 3: CDF of daily play time and session
times.
The cumulative distribution functions (CDFs) of the average daily play time and the average session play time are shown in Figure 3(a). We find that 75% of gamers play longer than 1.9 hours per day on average, and 25% play longer than 4.9 hours per day, which again indicates that the game is very attractive to the gamers. If we analyze the average session play time, we find significant "knee" around 1 hour and 5 hours, which indicate that after logging into the game, there is a high probability that players will stay for at least one hour, but usually no longer than 5 hours. Because of the long session property, players probably do not login into the game too many times a day; hence, the daily session count is not large, as shown in Figure 3(b), where more than 80% of gamers have less than 2 session counts per day on average. We summarize the quantiles and averages of the average daily play time, average session play time, and average daily session count in Table 4.
Table 4: Summary of daily game play activities
(Mean, SD)
Quantiles (5%, 25%, 50%, 75%, 95%)
Session time (hr)
(2.8, 1.8)
(0.4, 1.0, 1.8, 3.0, 5.5)
Daily session count
(1.7, 0.9)
(1.0, 1.1, 1.4, 2.1, 3.3)
Daily play time (hr)
(3.7, 2.8)
(0.5, 1.6, 3.1, 5.1, 8.8)
3.3 Variations in the Number of Avatars Online
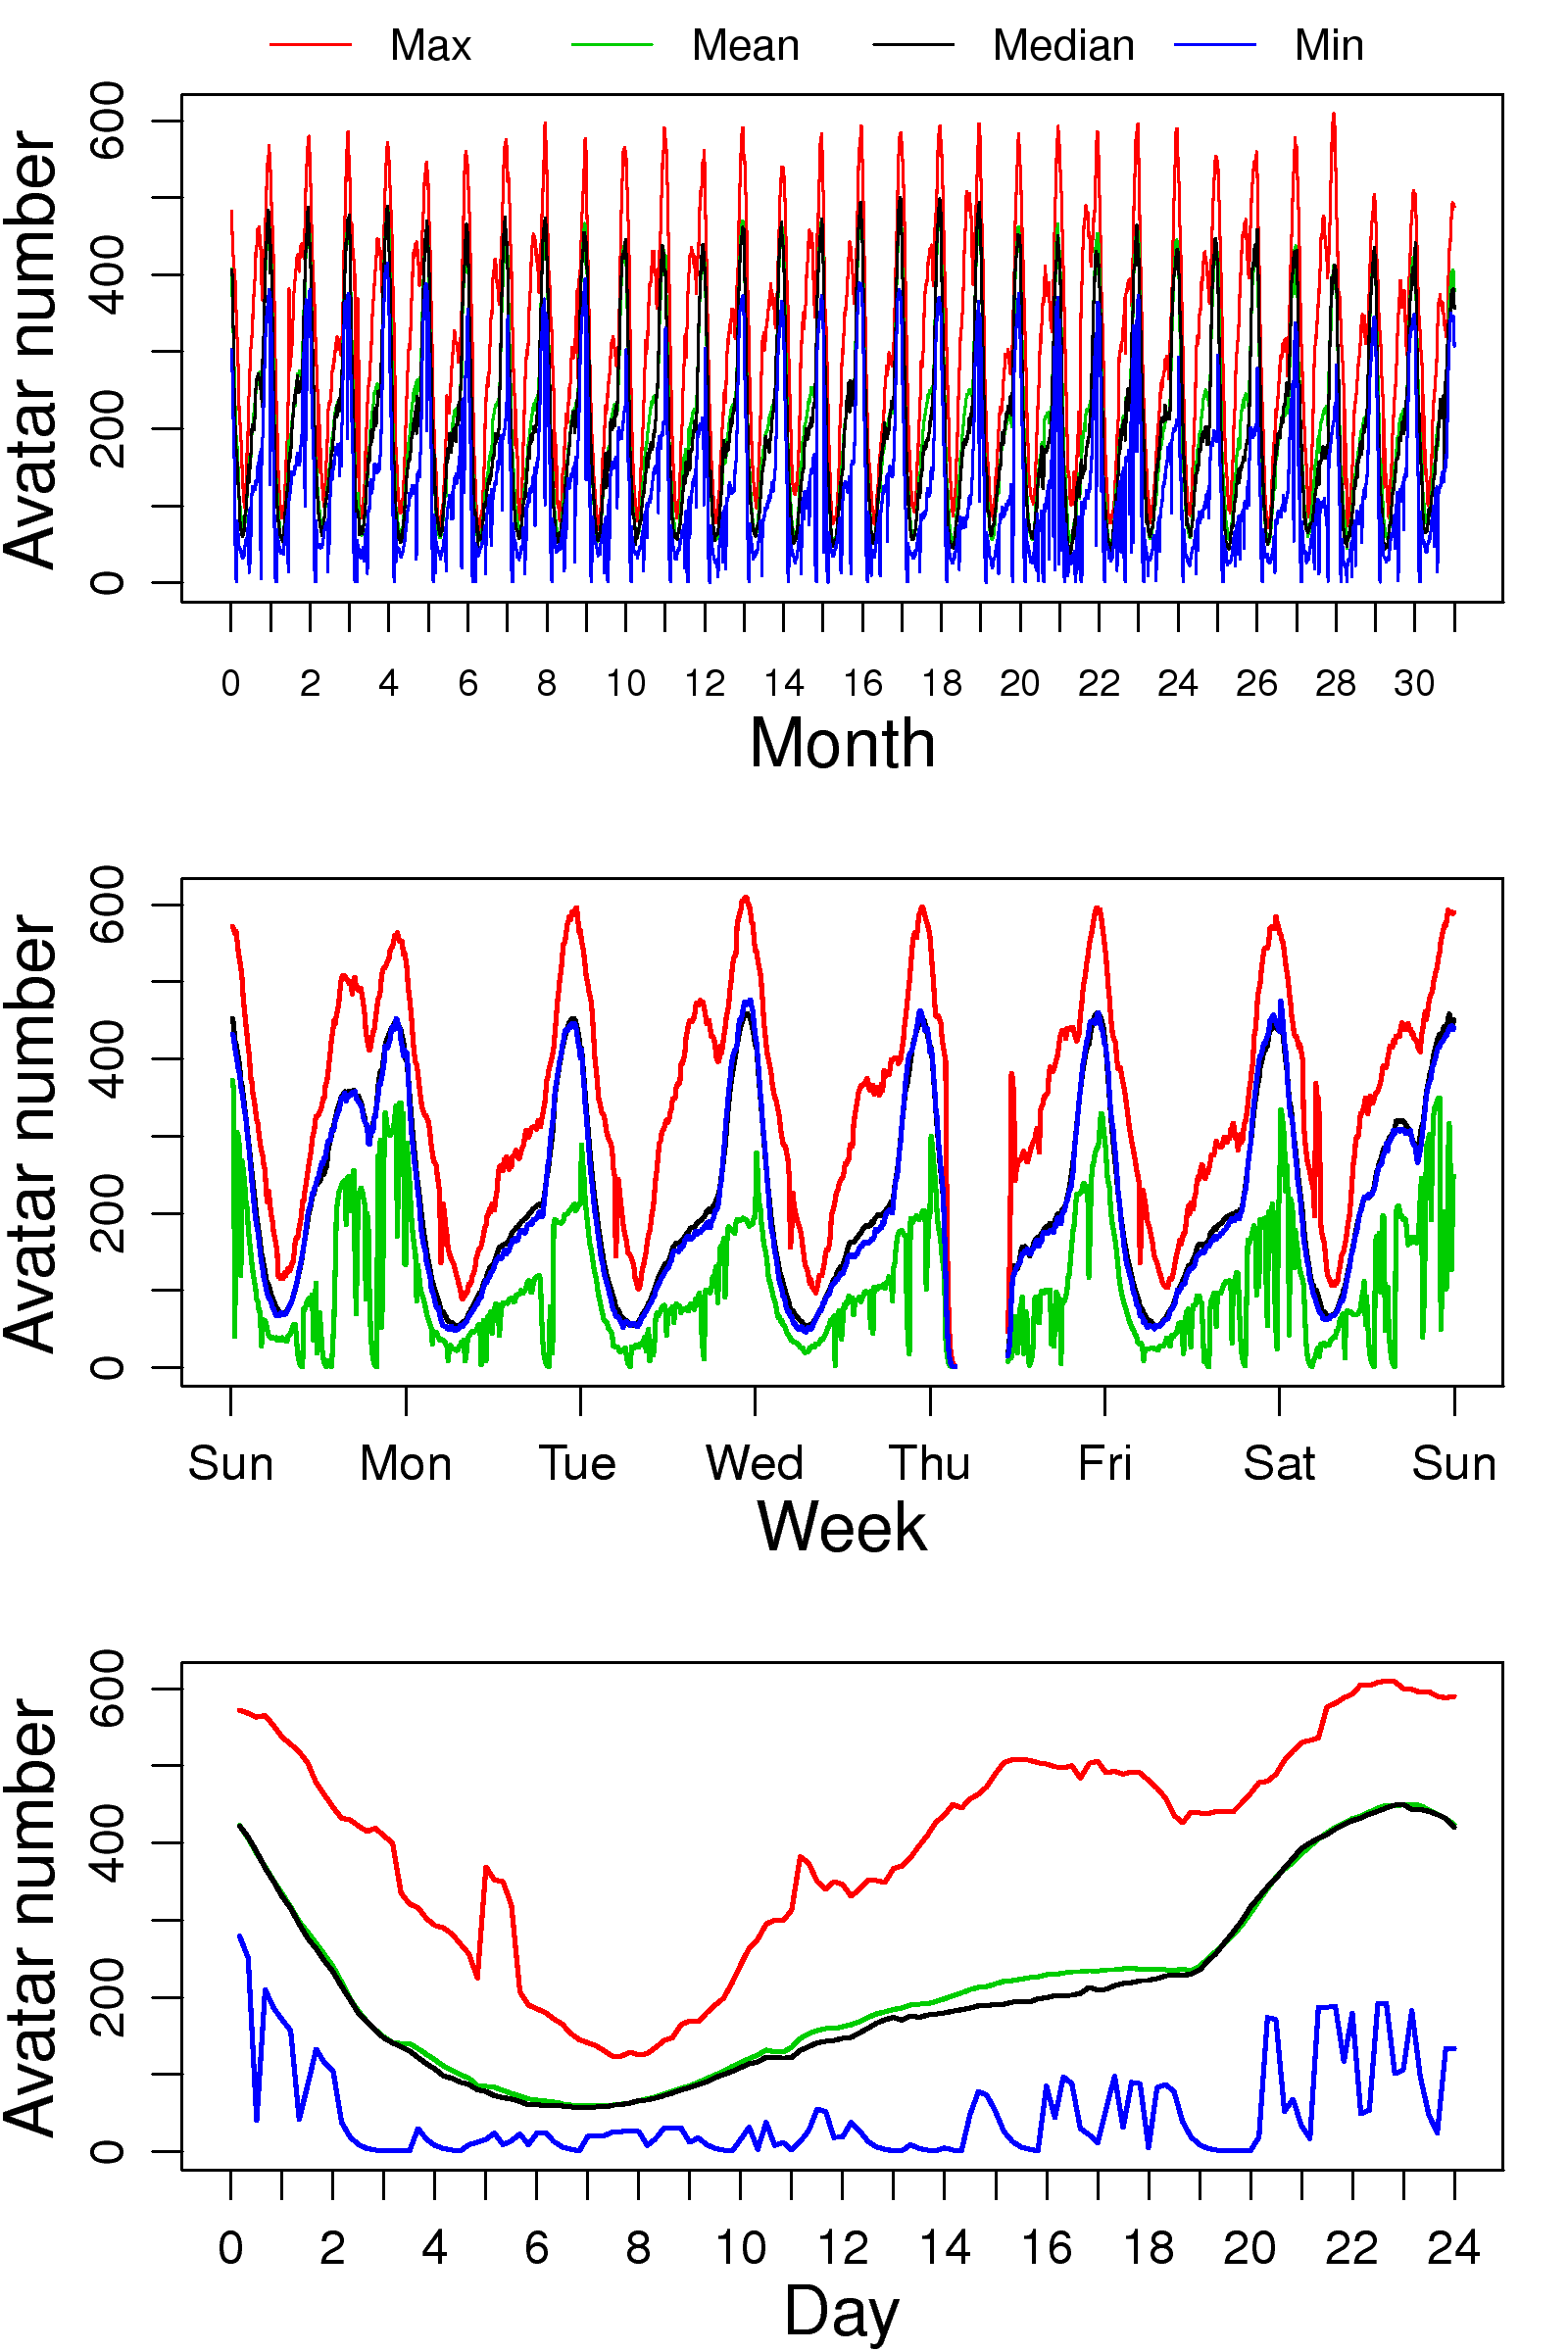
Figure 4: The averaged avatar number process shown
in different time scales. The top two graphs are plotted based on daily
averages and the bottom one is plotted based on the hourly
averages.
Figure 5: The cumulative distribution functions of averaged
avatar numbers in different time scales. The leftmost graph is based on
monthly averaged numbers; the middle graph is based on weekly averaged
numbers; the rightmost graph is based on daily averaged numbers.
In this subsection, we consider how the number of avatars online evolves over time. We begin by plotting the average maximum, mean, median, and minimum numbers of avatars in different time scales, as shown in Figure 4. The top graph in the Figure 4 shows that, except for daily variations, there are no obvious systematic variations at larger time scales. By contrast, the middle graph shows that daily variations dominate the variability in the evolution of the number of avatars. The blackout period on Thursday morning is due to weekly maintenance downtime scheduled by the operator. The bottom graph plots daily variations in the number of avatars. Clearly, there are large fluctuations in the number of avatars (between 0 and 600) in a 24-hour period. On average, the quietest period is around 7am and the busiest period is around 11pm. This finding shows that many people play all night, and therefore implies that the game is addictive.
We also consider the distribution of the number avatars in consecutive periods for different time scales, as shown in Figure 5. The left-hand graph in the figure shows that the number of avatars in different months are similar with a slightly decreasing trend over the 9-month period. The only exception is January, which we suspect is a consequence of the Chinese New Year vacation. During such vacations, Chinese people gather with their families, play mahjong, and travel; thus, in our trace, the number of avatars in January was slightly lower than in February.
The middle graph in Figure 5 shows that, as expected, the distribution of the number of avatars in different weeks is similar. Meanwhile, in the right-hand graph, the distribution of avatars on each day of the week indicates that the overall game play time is significantly different on weekdays and weekends, with Sunday attracting more gamers than Saturday. The distribution curve of Thursday is due to the scheduled weekly maintenance. The deviation of the curve from those of other weekdays implies that gamers return immediately after the maintenance period without "wasting" off-game time, which again reveals the addictiveness of the game.
3.4 Regularity of the Number of Avatars Online
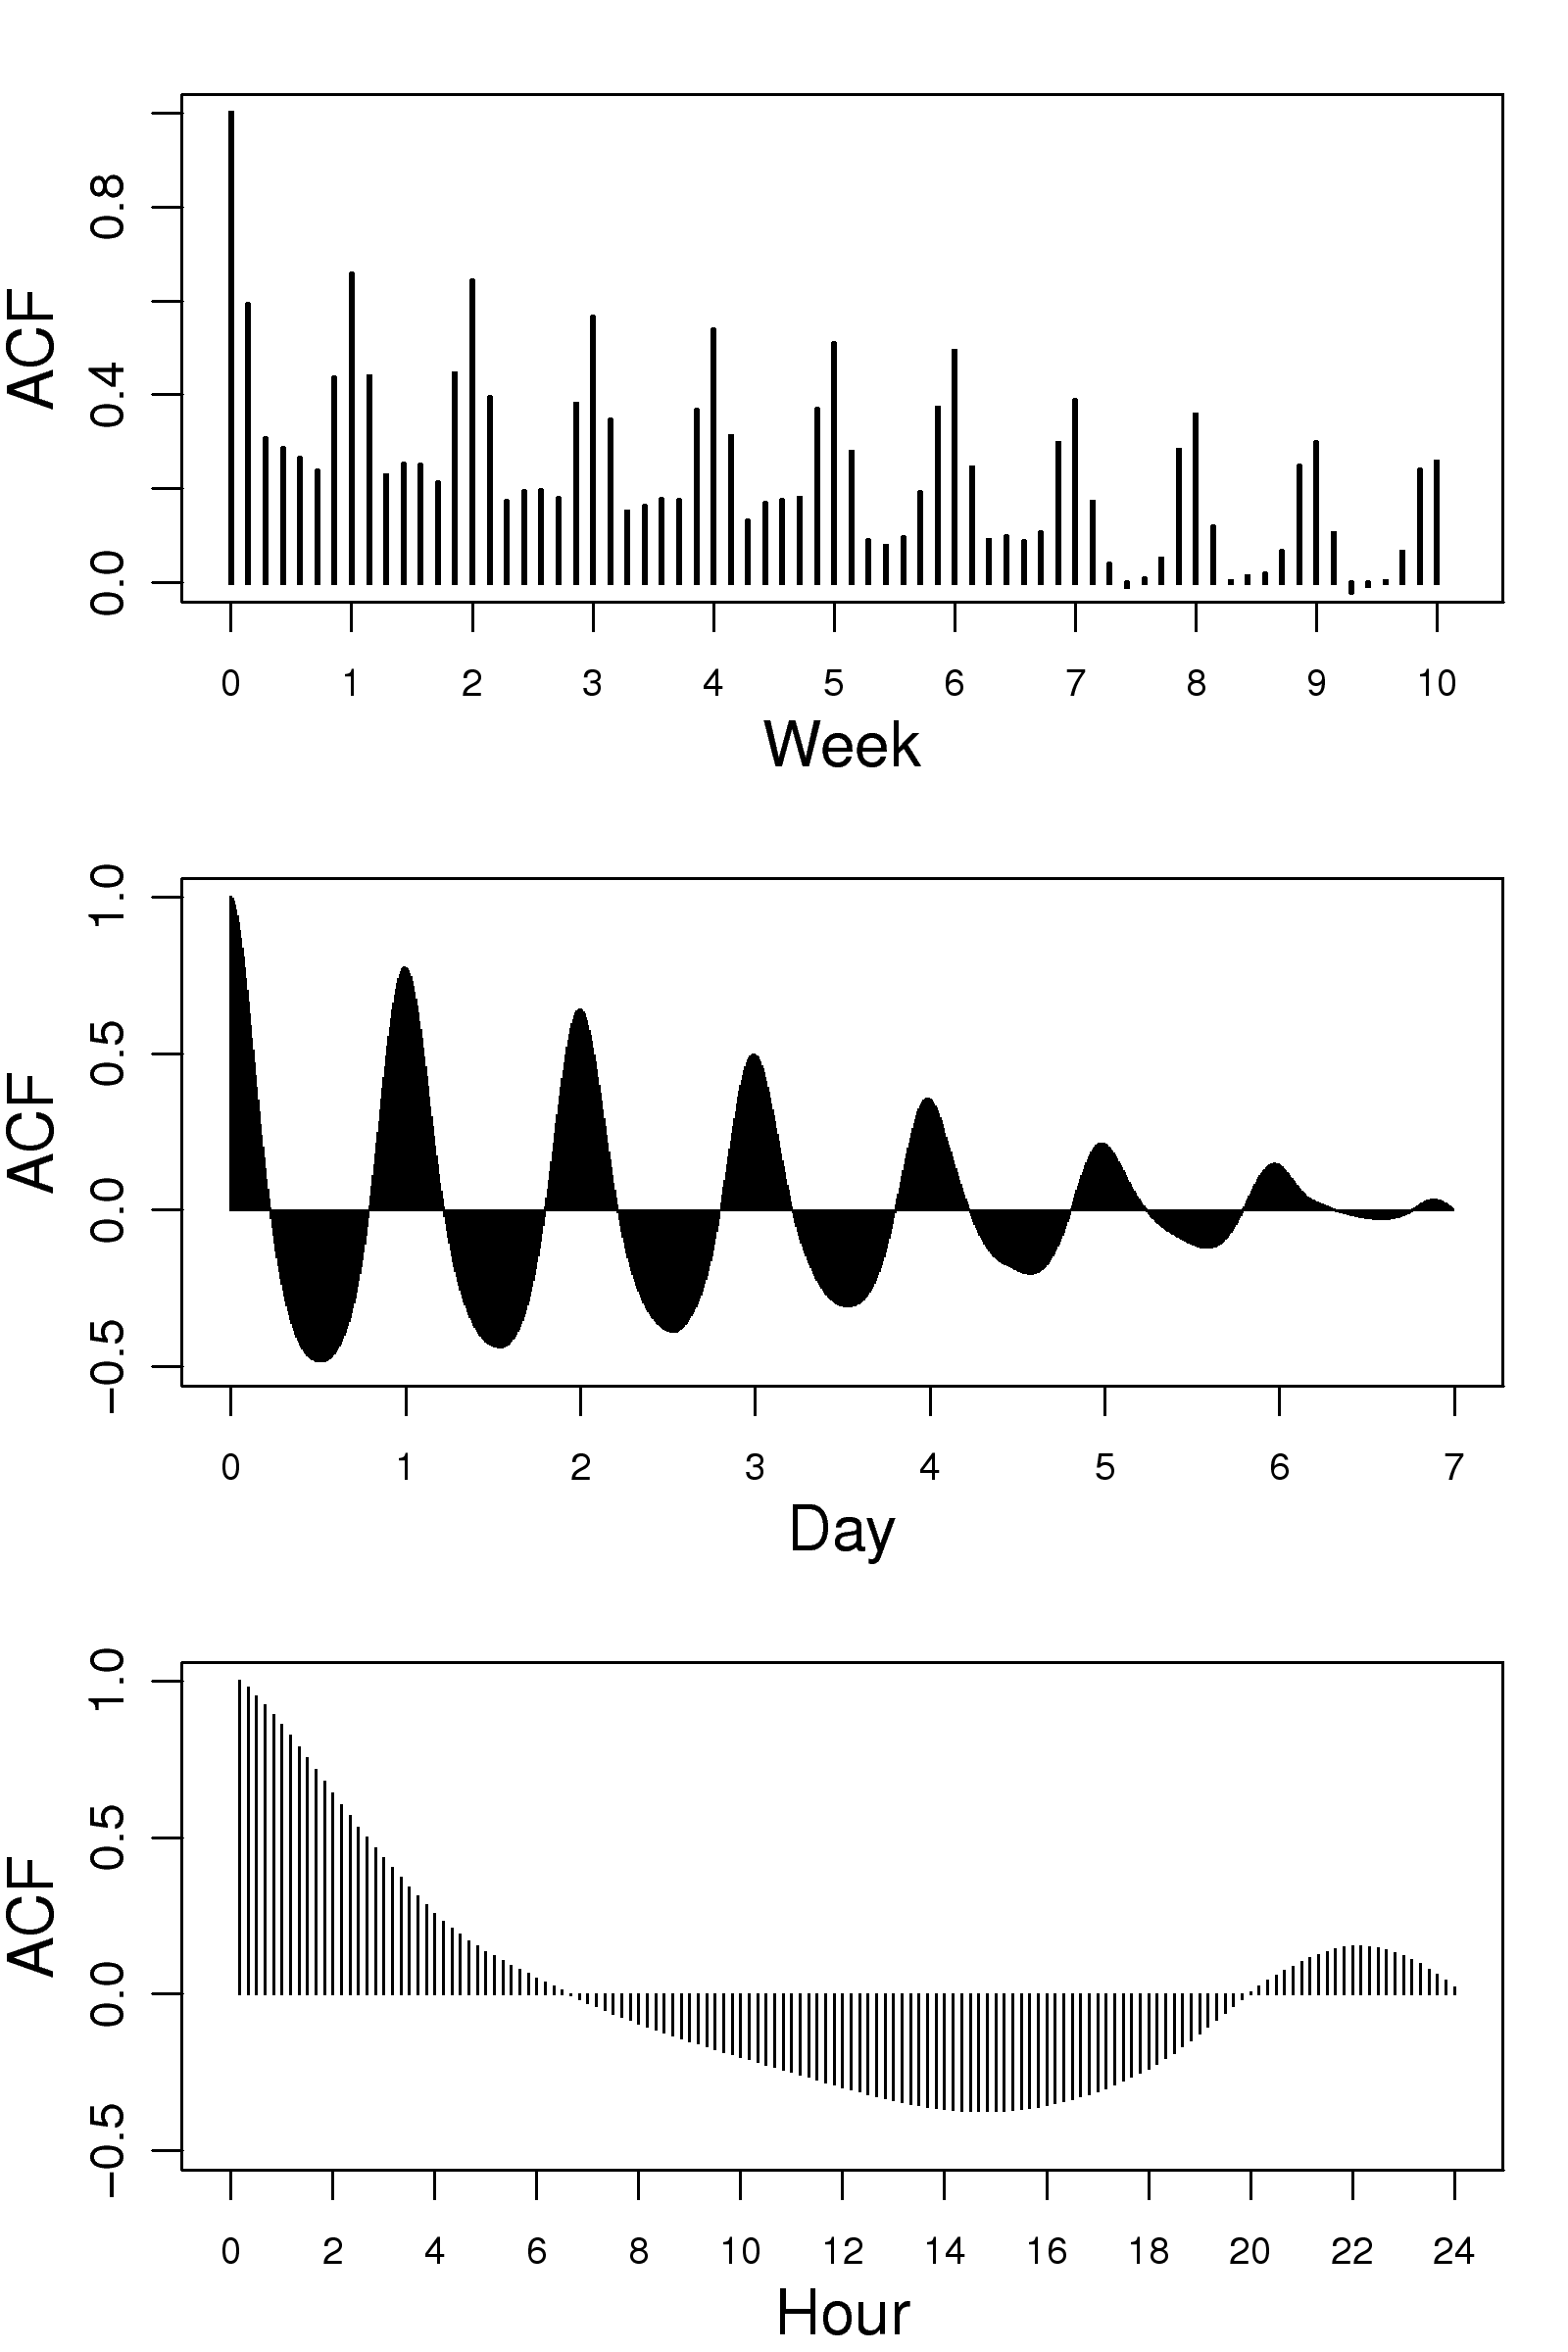
The strong regularity over consecutive weeks and days and the strong variability within a 24-hour period can be further examined by auto-correlation function (ACF) plots on corresponding time scales, as shown in Figure 6. The top graph in the figure exhibits strong weekly regularity, while the middle graph exhibits strong daily regularity in the evolution of the number of avatars. The ACF of the number of avatars over the number of hours in the bottom graph shows that there is no regularity within a 24-hour period; however, the large coefficients with a lag of less than 2 hours indicate the potential for accurately predicting the number of avatars in the next few hours.
Figure 6: The auto-correlation
functions of the avatar number process in different times
scales. The top graph is based on daily averaged numbers; the
middle graph is based on hourly averaged numbers; and the
bottom graph is based on the avatar number observed at each
10 minutes.
4 Sample Uses of The Dataset
We consider two sample studies that examine different aspects of the WoWAH dataset. The first study tries to model and predict the subscription time of game players and the usage time of avatars; and the second uses the WoWAH dataset to evaluate the effectiveness of a server consolidation strategy designed for MMORPGs. We present the studies here in the hope of motivating potential users of the dataset to find other creative uses.
4.1 Player Unsubscription Prediction
In [19], based on the WoWAH dataset, the authors presented a prediction model of online gamers' intentions that takes a player's game hours as input and predicts whether or not the player will decide to continue in the game once his current subscription expires. Predictions about players' non-renewal decisions are important to game operators because the decisions affect the operators' revenue directly. The rationale of the scheme is that, if the intentions of players can be predicted before they actually leave a game, the game operator can take remedial action to prevent the players' departure and improve the game based on feedback provided by those players. The authors developed a scheme to predict a gamer's departure [19]. For hardcore players, the scheme enables game operators to predict players' non-renewal decisions two months prior to expiry of their membership with a compound accuracy of over 80%. In addition, the authors conducted a generalizability analysis, which showed that the scheme is generalizable across different MMORPGs and that it can be applied to both game play and avatar usage predictions.
4.2 Server Consolidation Techniques
With the advent of virtualization technology [20], consolidation of MMORPG servers [13] is now possible, even though various system architectures may be involved. By using an appropriate server consolidation strategy, an operator can reduce investments in hardware (by consolidating different game servers on a physical computer) and energy consumption (by putting idle servers into the sleep mode whenever appropriate), while maintaining user-perceived service quality.
In [12], the authors proposed using a zone-based server consolidation strategy for MMORPGs to reduce the considerable investments in hardware and the energy consumption. Based on the WoWAH dataset, they implemented the proposed zone-based server consolidation algorithm, which reallocates zones among a set of server clusters regularly. The algorithm's impact in terms of the number of servers required and the energy consumption was also evaluated. Moreover, the authors presented a technique to upscale the number of avatars based on the avatars' game play history observed on a single server from the WoWAH dataset. Specifically, they modeled the number of avatars in a realm as a normal distribution with mean 2,640 and standard deviation 1,500 (derived from the data in the Warcraft Census4 and WoW Database5) assuming that the maximum number of avatars per realm was 7,500. After obtaining the number of avatars in each realm (with the above normal distribution), they computed the number of avatars in each zone based on the relative number of avatars in each zone in the WoWAH trace.
5 Conclusion
In this paper, we have presented the WoWAH dataset, a three-year trace of avatars' game play history in World of Warcraft. We believe the trace is of value and could benefit the research community for the following reasons:
World of Warcraft, which currently has 12 million subscribers, has been the most popular MMORPG in the world since 2006 [21].
The dataset comprises avatars' game play records for a three-year period from Jan. 2006 to Jan. 2009. During that time, game designers released two important expansions, namely, The Burning Crusade and Wrath of the Lich King.
The value of the dataset has been demonstrated in studies of user behavior and game server clouds, as mentioned in Section 4.
In addition to the presented sample studies, we believe that game designers and researchers will find further creative uses for the dataset now that it is a public asset of the research community. The dataset is available for free download at http://mmnet.iis.sinica.edu.tw/dl/wowah.
References
[1]
Starcraft 2 Rankings, 2010.
http://www.sc2ranks.com.[2]
C. Chambers, W. chang Feng, S. Sahu, and D. Saha.
Measurement-based characterization of a collection of online games.
IMC'05, pages 1-14, 2005.
[3]
K.-T. Chen, P. Huang, and C.-L. Lei.
How Sensitive are Online Gamers to Network Quality??
Communications of the ACM, 49(11):34-38, Nov 2006.
[4]
K.-T. Chen, P. Huang, and C.-L. Lei.
Effect of network quality on player departure behavior in online games.
IEEE Trans., pages 593-606, 2009.
[5]
K.-T. Chen, P. Huang, G.-S. Wang, C.-Y. Huang, and C.-L. Lei.
On the Sensitivity of Online Game Playing Time to Network QoS.
In Proceedings of IEEE INFOCOM'06, Barcelona, Spain, Apr. 2006.
[6]
V. H. H. Chen and H. B.-L. Duh.
Understanding social interaction in World of Warcraft.
ACE'07, pages 21-24, 2007.
[7]
C. Francis and F. Wu-Chang.
Modeling player session times of on-line games.
In Proceedings of the 2nd workshop on Network and system support
for games, NetGames'03, pages 23-26, 2003.
[8]
I. V. Geel.
MMOG subscriptions with a peak between 1,000,000 and 12,000,000.
http://users.telenet.be/mmodata/Charts/Subs-1.png.[9]
T. Henderson and S. Bhatti.
Modeling user behaviour in networked games.
Proceedings of ACM Multimedia'01, pages 212-220, 2001.
[10]
J. Kim, J. Choi, D. Chang, T. Kwon, Y. Choi, and E. Yuk.
Traffic characteristics of a massively multi-player online role
playing game.
ACM NetGames'05, pages 1-8, 2005.
[11]
M. Kwok and G. Yeung.
Characterization of user behavior in a multi-player online game.
ACE'05, pages 69-74, 2005.
[12]
Y.-T. Lee and K.-T. Chen.
Is Server Consolidation Beneficial to MMORPG? A Case Study of World of Warcraft.
IEEE Cloud'10, 0:435-442, 2010.
[13]
D. A. Menascé.
Virtualization: Concepts, applications, and performance modeling.
In Int. CMG Conference, pages 407-414, 2005.
[14]
MMORPGRealm.
World of Warcraft Statistic in 2010, 2010.
http://www.mmorpgrealm.com/world-of-warcraft-statistic-in-2010/.[15]
B. Nardi.
Collaborative play in World of Warcraft.
LA-WEB'06, page 3, 2006.
[16]
D. Pittman and C. GauthierDickey.
A measurement study of virtual populations in massively multiplayer
online games.
ACM NetGames'07, pages 25-30, 2007.
[17]
P. Svoboda, W. Karner, and M. Rupp.
Traffic analysis and modeling for World of Warcraft.
ICC'07, pages 1612-1617, 2007.
[18]
P.-Y. Tarng, K.-T. Chen, and P. Huang.
An Analysis of WoW Players Game Hours.
In Proceedings of ACM NetGames'08, 2008.
[19]
P.-Y. Tarng, K.-T. Chen, and P. Huang.
On Prophesying Online Gamer Departure.
In Proceedings of ACM NetGames 2009 (poster), 2009.
[20]
VMware.
Virtualization overview.
http://www.vmware.com/pdf/virtualization.pdf.[21]
Voig, Inc.
MMOGData: Charts, subscriptions.
http://mmogdata.voig.com/.[22]
B. S. Woodcock.
Market share by genre.
http://www.mmogchart.com/Chart8.html.[23]
WoWWiki.
Lua.
http://www.wowwiki.com/Lua.[24]
R. Wright.
Expert: 40 percent of World of Warcraft players addicted, 2006.
[25]
J. Wu.
The world of MMORPG: a tale of two regions.
[26]
Z. Z. Eric Wan and X. Xu.
2006 online game report, 2006.
In Pacific Epoch Red Innovation Report Series.
