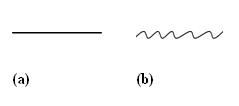
Figure 1: The concept of the employing generalization/specialization as the change of LoD. (a) is the result of generalization of (b).
Keywords: Adaptive Level-of-Detail, Adaptive zooming, Rich/Smart graphics, Scalable Vector Graphics (SVG).
Biography
Yi-Hong Chang has been a research assistant at the Institute of Information Science, Academia Sinica, Taiwan, since Spring 2001, and is the chief developer of the Taiwan Social Map system at the institute. He received his undergraduate and Master degrees, both in Anthropology, from National Taiwan University.
Biography
Tyng-Ruey Chuang is an Associate Research Fellow at the Institute of Information Science, Academia Sinica, Taiwan. His research areas include functional programming, XML and Web technologies, and social implications of information technologies. He received his PhD degree in Computer Science from New York University in 1993 and his undergraduate degree, also in Computer Science, from National Taiwan University in 1984.
Biography
Hao-Chuan Wang has been a research assistant of the Institute of Information Science, Academia Sinica, Taiwan, since Spring 2004. He received his undergraduate degree in Earth Sciences from National Taiwan Normal University in 1999 and his Master degree in Computer Science from National Chengchi University in the summer of 2004.
A script-free SVG document is just data with a fixed internal structure and exhibits only static graphic semantics. If SVG documents are not data but are programs, then one should be able to use SVG to create dynamic graphics, as the documents would be executed for its dynamic semantics. When SVG documents are used with scripting, one can achieve a certain level of dynamic graphics. However, the logics of the dynamic graphics is kept in the script, not expressed in the document itself. This is a drawback, as often one may like to express the graphic semantics entirely within SVG elements. For example, one may want to use only SVG elements to describe graphics that animate, or to express graphics with adaptive Level-of-Detail (LoD). Animation is supported in SVG with a built-in vocabulary, or even by the help of external vocabulary such as SMIL. Currently there is no support of adaptive LoD in SVG, although it is extremely useful in Geographic Information Systems (for adaptive zooming) and fractal geometries (for on-demand resolution-dependent visual presentation).
We show in the paper how to support adaptive LoD in SVG. The SVG DTD is extended by adding attributes to the elements (including visual elements and grouping elements). Information about the adaptation function and the current detail-level can now be kept with the SVG <g> element, which is a focal point to be further explored. When more details are demanded, these attributes are used to generate the next level of details for elements enclosed in the current focal point. The newly produced graphic elements then replace the old ones, and become the new focal points. Currently the adaptation functions are expressed by an ad hoc transformational language, and they are interpreted by an ECMA script. We note that existing XML transformational languages (such as XSLT) and vocabularies (similar to SMIL for animation) can also be used to express adaptation, and they can lead to a script-free but LoD-capable SVG.
1. Introduction
2. Adaptive Level-of-Detail
2.1 Methods of Level-of-Detail
2.2 Augmenting DTD for Adaptive Level-of-Detail
3. Examples
3.1 Algorithmic Adaptation
3.2 Resource Linking
3.3 Level-of-Detail Selection and Filtering
4. Conclusion
Acknowledgements
Bibliography
One of the main characteristics of SVG is vector-based scalable graphics. After loading SVG documents into a browser, users are allowed to "zoom" the graphics for details or an overview. However, this type of zooming does not change the appearance and presentation of the graphics described by the document. It just changes the scale. For example, the "zoom-in" operation will enlarge the graphics which is to change the visible area to the user. Neither extended information nor more details of the graphic will be generated actually. In other words, the concept of level-of-detail is not realized in current SVG zooming metaphor.
In many applications of SVG, the need of zooming with adaptive level-of-detail is evident. In Web-based geographic information systems (GIS), for example, users need to grasp a global understanding of the map at a larger scale with simple and approximate graphical presentation and symbolization. Without appropriate adaptive mechanism, complex presentations with detailed mapping features usually hinder users to derive the global understanding. Similarly, when users target at a specific part of the map, users would expect to percept comprehensive details of that targeted sub-area.
As the previous work of [Cecconi & Galanda, 2002] proposed, two main methods could be applied on the issue of preparing graphics with required Level-of-Detail (LoD). One technique is to pre-generate SVGs with various LoDs, such as maps with different scale levels (e.g., 1:5000, 1:25000). Another technique is to produce SVG documents dynamically at run-time if the required zooming effect can be generated or adapted on-the-fly by appropriate algorithms. In [Cecconi & Galanda, 2002] , a data-driven system for Web cartography incorporating these two techniques has been proposed. Thus the system could select or generate SVGs with required LoD to serve users. In this paper, such mechanism of changing the LoD of visual presentations dynamically is called Adaptive LoD. Nevertheless, knowledge of how to adapt a particular graphic is held by the centralized system in this kind of data-driven approach. In other words, [Cecconi & Galanda, 2002] used a centralized system that did not exchange and distribute SVG documents with associated adaptive functionality
In this paper, we demonstrate an approach to embedding the domain semantics of adaptive LoD into graphics by extending the DTD of SVG [Chang & Chuang, 2003] . We aim to achieve adaptive LoD with the following objectives
The overall goal of this paper is to investigate possible solutions of adding the feature of LoD in SVG. We also propose how to add a set of adaptive LoD vocabularies to the current SVG DTD.
In this chapter, the concept of LoD is explored further. We will describe different methods to attain the effect of adaptive LoD in SVG. A set of vocabularies is proposed as extensions to current SVG specification to fulfill the needs of these methods.
In order to add the feature of LoD into current SVG specification, here we firstly distinguish different methods to achieve the effect of adaptive LoD. The concept of LoD is relating to the concept of generalization and specialization of individual or a group of graphics elements. For example, a large-scale geographic map aimed to show international boundaries is a kind of generalization regarding to small-scale maps showing comprehensive details of official boundaries inside a specified area. Another type of LoD could be the change of visual symbols for the same information source. For example, the line shown in Figure 1 (a) could be thought as the result of a generalization for the graphics shown in Figure 1 (b). In other words, the graphic shown in Figure 1 (b) has a higher LoD than that in Figure 1 (a). The concept of LoD can be applied to many similar situations. For instance, the acronym "LoD" itself can be even thought as the generalized symbolization of the phrase "Level-of-Detail".
Figure 1: The concept of the employing generalization/specialization as the change of LoD. (a) is the result of generalization of (b).
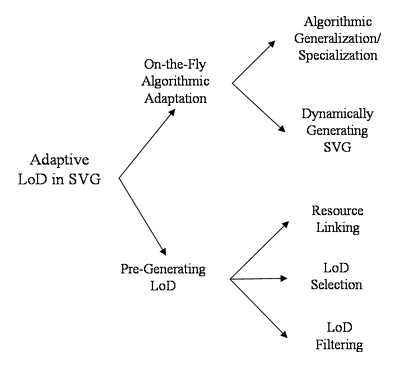
As described in the introduction, two main methods of achieving LoD are pre-generating LoDs and on-the-fly algorithmic adaptation. However, several sub-categories of the two main methods can be distinguished. Depending on the needs of different application domains and contexts, these methods can be employed individually or cooperatively. We propose a taxonomy for adaptive LoD methods in SVG in Figure 2 .
Five major methods are identified in the proposed taxonomy tree. The characteristics of these methods are introduced below. The first two methods belong to the category of algorithmic adaptation. They are
On the other hand, the remaining three methods shown in Figure 2 belong to the category of pre-generating LoD. The common characteristic of these methods is that SVG data with different LoDs are pre-generated. It is evident that these data can be pre-authored manually or pre-generated by the two types of algorithm we just mentioned. Note that generalization/specialization algorithms are applied off-line in this case. Once SVG data with different LoDs are pre-generated, the next task is to use and organize these pre-generated graphics properly to achieve the effect of adaptive LoD. Possible methods are
Note that these methods are not mutual exclusive. In many situations, they have to be used cooperatively to tackle different perspectives of LoD in the domain. For example, in the task of multi-facets geographic mapping, the solutions of adaptive LoD for natural features (e.g., rivers, mountains) and social features (e.g., boundary of official area) are not the same. Therefore, the extended vocabularies for adaptive LoD should be designed to fit the needed of different methods. The objective is to make the designed vocabulary applicable to various situations in a general manner.
We have described a taxonomy for adaptive LoD methods in SVG. We now consider how to describe/embed the semantics of adaptive LoD in the SVG documents by defining a set of extended vocabularies. Our previous works have proposed several approaches of embedding domain semantics into SVG documents
[Chang & Chuang, 2003]
. For this case of incorporating LoD semantics in SVG, we choose to add new attributes to SVG graphics elements for its simplicity. A set of SMIL-like full-fledged vocabularies for adaptive LoD could be developed further as well. The augmented DTD is illustrated below by using <svg> and <g> elements as examples.
<?xml version="1.0" encoding="UTF-8"?>
<!DOCTYPE svg PUBLIC "-//W3C//DTD SVG 1.0//EN"
"http://www.w3.org/TR/2001/REC-SVG-20010904/DTD/svg10.dtd" [
         <!ATTLIST svg
           xmlns:lod CDATA #IMPLIED>
         <!ATTLIST svg
           lod:zoom (true|false) "false">
         <!ATTLIST g
           lod:doLevelUp CDATA #IMPLIED
           lod:doLevelDown CDATA #IMPLIED
           lod:doLevel CDATA #IMPLIED>
         <!ENTITY % defsExt "|lod:pool">
	 <!ELEMENT lod:pool (lod:lodobj)*>
	 <!ELEMENT lod:lodobj ANY>
	 <!ATTLIST lod:pool
                   id ID #REQUIRED
                   action (replace|filter) "replace">
	 <!ATTLIST lod:lodobj
                   sn CDATA #REQUIRED
                   xlink:href CDATA #IMPLIED>
]>
|
Figure 5: Augmenting SVG DTD for Adaptive LoD.
Relating the design of DTD to the taxonomy of adaptive methods, the augmentation is to assure that different methods for adaptive LoD can be described sufficiently and sensibly. For most methods shown in
Figure 2
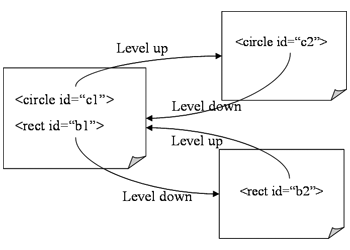
, it would be sufficient to employ the attribute 'doLevel' to express the adaptation definition as its value. However, for the method of resource linking and asymmetrical adaptations, only using one attribute, 'doLevel', would be insufficient. Different adaptation definitions may have to be specified for the needs of adding and reducing the level of detail respectively. For such scenarios, two distinct attributes are used, 'doLevelUp' for describing definitions of adding LoD to the graphics and 'doLevelDown' for the corresponding downward operations.
It is natural to treat the process of adaptation as a type of content transformation. Therefore, the purpose of adaptation definition is to clearly describe the parameters and/or the locations of adaptation engines/services. Two types of adaptation definition are:
doLevel = "adapt()" with its functionality invoked by a call to the function "adapt()".
'doLevelUp', 'doLevelDown' and 'doLevel') would be expressed like doLevelUp="href(URI)". Besides, for the method of LoD selection and filtering, the adaptation definition is in the form of doLevelUp="pselect(LEVEL)". Here the value of LEVEL would refer to the attribute 'sn' associated with the <lodobj> element. (Details can be found in
Figure 5
.)
The 'zoom' attribute associated with the <svg> element indicates whether to enlarge or reduce the size of graphics or not after the process of adaptation. If the value was set as 'true', then the adaptation engine should invoke the zooming function of the SVG renderer to achieve the effects.
It is worth noting that for methods belong to the category of pre-generating LoD, defining new graphics elements in a pre-generated pool of cache would be necessary. For example, for the method of LoD selection, the task is to select and render the graphic with required LoD from a set of pre-generated graphics objects. Links to these pre-generated objects or resources should be described in the document properly. We choose to add these new elements as the child elements of the <defs> element.
Figure 5
shows the DTD defining the two new elements: <pool> and its child element <lodobj>.
For the <pool> element, the attribute 'action' is used to specify how to render graphics in the pool with different LoDs. There are two candidate values for this attribute, 'replace' or 'filter'. If the attribute has the value 'replace', which is the default one, it means that the adaptation results, either at the (k+1)-th level or at the (k-1)-th level, will be used to replace previous graphics at the k-th level. This is also known as the method of LoD selection. However, if the value 'filter' is specified, it indicates that the method of LoD filtering will be applied.
Though we only demonstrate how to augment attributes of <svg> and <g> elements in this case, this type of augmentation can be applied to all graphics elements, such as elements of <path>, <line>, or even <text>. Nevertheless, for most cases, adding attributes to the SVG <g> element would be sufficient.
In this chapter, we present several examples to demonstrate how to use these DTD augmentation techniques to realize various adapitve LoD methods in SVG.
Figure 6
shows the fragment of a SVG document that illustrates algorithmic generalization/specialization. Graphic illustration of the SVG elements are in
Figure 7
. The initial graphics described by the SVG document is shown as Figure
Figure 7
(a). By using the SVG <g> element as the input, the resulting graphics transformed by the adaptation function adaptBox(1) is shown as
Figure 7
(b). The method of adaptive generalization/specialization is employed for this task. When the level of detail increases, the adpatation function is used to specialize the graphic presentation. Similarly, when the level decreases, the mechanism of generalization is used. In this case, the adaptive function is adaptBox() which is a recursive function where the argument '0' inside the function is used as a landmark specifying the inital LoD of the rendered graphics. The other argument 'cache' is an ID reference to a <pool> element in the SVG document. The use of this "pool" element is to offer a cache storage to store backups of the graphics that have been generated by the adaption fucnction. When users request to reduce/increase LoD, the cached graphics elements could be checked and fetched diretly if they are available. In this implementation, the adaptation function is implemented in ECMA script which performs DOM node manipulation. We could also use a link to external services in the form of doLevel="res:href('http://tsm.iis.sinica.edu.tw:8080/adapt/')", or a delegation referring to an XSLT script, instead of the accompanying ECMA script.
...
<svg id="map" lod:zoom="false" width="400px" height="400px" viewBox="0 0 400 400">
  <defs>
      <lod:pool id="cache"/>
  </defs>
  <g id="LoD" lod:doLevel="adaptBox('cache',0)">
      <line x1="40" y1="40" x2="80" y2="40" style="stroke:blue;stroke-width:0.8"/>
      <line x1="80" y1="40" x2="80" y2="80" style="stroke:blue;stroke-width:0.8"/>
      <line x1="80" y1="80" x2="40" y2="80" style="stroke:blue;stroke-width:0.8"/>
      <line x1="40" y1="80" x2="40" y2="40" style="stroke:blue;stroke-width:0.8"/>
  </g>
</svg>
|
Figure 6: SVG document (partial) of the box shown in Figure 7 .
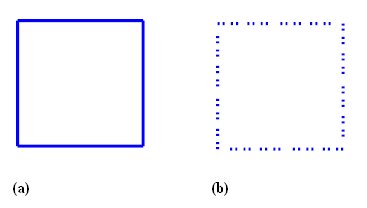
Figure 7: A box. (a) the initial graphic described in the SVG document; (b) the graphic adapted by the function
adaptBox(). (SVG source at alg_generalize.svg).
The next example demonstrates a fractal graphics, the Dragon Curve generated by the algebraic system, L-system
[Weisstein, 1999]
.
Figure 8
shows part of the SVG document.
Figure 9
(a) shows the initial graphic.
Figure 9
(b) shows the result after adaptation by DOM manipulating at run-time. Note that the structure of the SVG document in
Figure 8
is somewhat different to the box example we show in
Figure 6
. In
Figure 8
, we can observe that the static description of the graphics is hidden. Since the pattern of dragon curve can be best described by a well-defined algebraic system (i.e., L-system), but not by SVG's graphics vocabularies in a static manner (i.e., purely with <path> elements), thus it would be more sensible to express this pattern completely by the adaptation function itself. This adaption function fractalInit() plays two roles actually. On the one hand, it is an adaptation function for adaptive LoD; on the other hand, itself describes the fractal graphics, via an algorithmic means.
...
<svg id="map" lod:zoom="false" width="400px" height="400px" viewBox="0 0 400 400">
    <g id="LoD">
        <g id="dragon" lod:doLevel="fractal(8)" onload="fractalInit(evt)"/>
    </g>
</svg>
|
Figure 8: SVG document (partial) of the fractal, Dragon curve shown in Figure 9 .
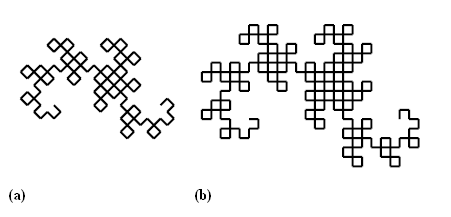
Figure 9: Dragon curve fractal. (a) the initial graphic generated by the function at run-time; (b) after adaptation. (SVG source at alg_fractal.svg).
The method of resource linking is useful and simple to implement. In the fragment of SVG document shown in
Figure 10
, four distinct graphics elements are described and drawn. The rendered results are shown in
Figure 11
. For each distint element, we specify resources for adapting itself in attributes 'doLevelUp' and 'doLevelDown'. Note that if these attributes were not annotated, then that element will not be replaced when changing the LoD. For example, the red circle with id="a" will not be adapted no matter adding or reducing the level of LoD. That is because neither 'doLevelUp' nor 'doLevelDown' were annotated in that element. In this example, the 'zoom' attribute of the <svg> element is given the value 'true'. Therefore, each time we change the LoD, the size of the viewBox will be modified as well.
<svg id="map" lod:zoom="true" width="400px" height="400px" viewBox="0 0 400 400">
  <defs>
      <circle id="b1" lod:doLevelUp="href('#b2')" cx="225" cy="175" r="3" fill="green"/>
      <path id="b2" lod:doLevelUp="href('#b3')" lod:doLevelDown="href('#b1')"
	      d="M215,165 L235,165 L235,185 L215,185 L215,165z"
		  style="fill:none;stroke:green;stroke-width:1px"/>
      <path id="b3" lod:doLevelDown="href('#b2')"
	      d="M215,165 L235,165 L235,185 L215,185 L215,165z"
		  style="fill:none;stroke:green;stroke-width:1px;stroke-dasharray:1 1"/>
      <circle id="c1" lod:doLevelUp="href('#c2')" cx="175" cy="225" r="3" fill="blue"/>
      <path id="c2" lod:doLevelUp="href('#c3')" lod:doLevelDown="href('#c1')"
	      d="M175,215 L167,231 L183,231z"
            style="fill:none;stroke:blue;stroke-width:1px"/>
  ...
  </defs>
  ...
      <g id="LoD">
          <circle id="a" cx="175" cy="175" r="3"
		  style="fill:red;stroke:red;stroke-width:1px"/>
          <use id="b" xlink:href="#b1"/>
          <use id="c" xlink:href="#c1"/>
          <circle id="d" lod:doLevelUp="href('#d2')" cx="225" cy="225" r="3"
		  style="fill:orange;stroke:orange;stroke-width:1px"/>
      </g>
</svg>
|
Figure 10: SVG document (partial) using the method of resource linking. Corresponding grphics are shown in Figure 11 .
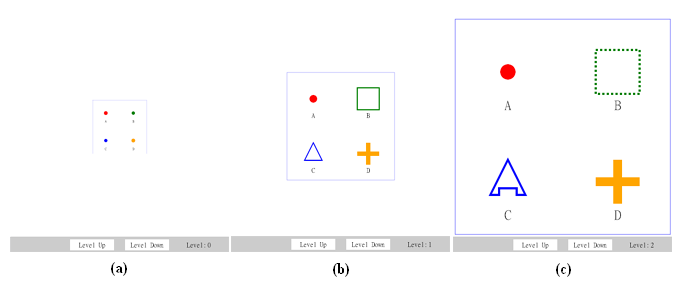
Figure 11: Adaptive LoD via resource linking. (a) 4 disint graphics rendered initially at
level 0; (b) after adaptation atlevel 1; (c) adaptation atlevel 2. (SVG source at reslinking.svg).
LoD selection and filtering could be the most popular methods for tackling LoD issues in geographic mapping as introduced in Section 2.1 . Here we present two examples to demonsrate LoD selection and filtering.
Figure 12
shows an SVG fragment for Lod selection. Corresponding graphics of the SVG fragment are shown in
Figure 13
. The <pool> element is employed in this example as a storage for pre-generated (i.e., authored) graphics elements. These pre-generated graphics are embedded in the container element <lodobj> along with the attribute 'sn' specifying the identifiers of the elements.
Figure 13
(a) shows the initial presentation of this document. The graphics embedded in <lod sn="0"> is selected and rendered initially. After adjusting the level of LoD from 0 to 2, the initial graphics is replaced by another graphics embedded in <lod sn="2">. The result is shown in
Figure 13
(b).
...
<svg id="map" lod:zoom="true" width="400px" height="400px" viewBox="0 0 400 400">
    <defs>
        <lod:pool id="pf">
          <lod:lodobj sn="0">
              <circle id="f1" cx="200" cy="200" r="110" style="fill:none;stroke:blue"/>
          </lodobj>
          <lod:lodobj sn="1">
              <rect id="e2" x="155" y="155" width="90" height="90" fill="none" stroke="green"/>
          </lodobj>
          <lod:lodobj sn="2">
              <circle cx="200" cy="120" r="15" style="fill:none;stroke:red"/>
              <circle cx="200" cy="280" r="15" style="fill:none;stroke:red"/>
              <circle cx="120" cy="200" r="15" style="fill:none;stroke:red"/>
              <circle cx="280" cy="200" r="15" style="fill:none;stroke:red"/>
              <circle cx="142" cy="255" r="15" style="fill:none;stroke:red"/>
              <circle cx="262" cy="255" r="15" style="fill:none;stroke:red"/>
              <circle cx="142" cy="140" r="15" style="fill:none;stroke:red"/>
              <circle cx="262" cy="140" r="15" style="fill:none;stroke:red"/>
          </lodobj>
        </pool>
    </defs>
    ...
    <g id="LoD">
          <g lod:doLevel="pselect('pf',0)" onload="pselectInit(evt,'pf',0)"/>
    </g>
</svg>
|
Figure 12: Using the method of LoD selection. Corresponding grphics are shown in Figure 13 .
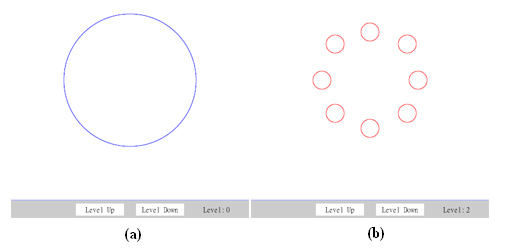
Figure 13: Adaptive LoD via LoD selection. (a) the initial graphics with
sn="0"; (b) after selecting another grahics withsn="2"(SVG source at selection.svg).
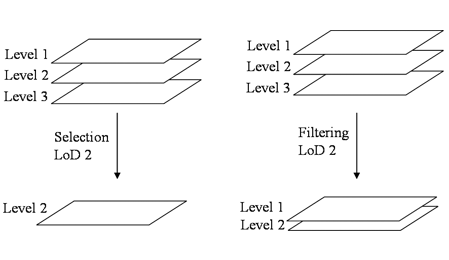
The next example illustrates the method of LoD filtering. Actually, the descriptions of LoD filtering shown in
Figure 14
is almost the same as that of LoD selection shown in
Figure 13
. The only difference is that we annotate the attribute action="filter" in the <pool> element in this case. This annotation enables a different strategy on rendering the graphics with various LoDs. The difference is between rendering only one graphics element (the case of LoD selection) and rendering multiple layers of graphics simultaneously (the case of LoD filtering). In the method of LoD filtering, each <lodobj> element is treated as a graphics layer. And these layers can be mixed altogether to form more comprehensive graphics.
Figure 15
(a) shows the initial graphics before any adaptaion.
Figure 15
(b) shows the scenario after setting the level of detail to 2. It can be observed that graphics elements with sn="0", sn="1" and sn="2" are all fetched and rendered. Comparing this result to the result of LoD selection shown in
Figure 13
(b), the difference is quite evident.
...
<svg id="map" zoom="true" width="400px" height="400px" viewBox="0 0 400 400">
    <defs>
        <lod:pool id="pf" action="filter">
          <lod:lodobj sn="0">
              <circle id="f1" cx="200" cy="200" r="110" style="fill:none;stroke:blue"/>
          </lodobj>
          <lod:lodobj sn="1">
              <rect id="e2" x="155" y="155" width="90" height="90" fill="none" stroke="green"/>
          </lodobj>
          <lod:lodobj sn="2">
              <circle cx="200" cy="120" r="15" style="fill:none;stroke:red"/>
              <circle cx="200" cy="280" r="15" style="fill:none;stroke:red"/>
              <circle cx="120" cy="200" r="15" style="fill:none;stroke:red"/>
              <circle cx="280" cy="200" r="15" style="fill:none;stroke:red"/>
              <circle cx="142" cy="255" r="15" style="fill:none;stroke:red"/>
              <circle cx="262" cy="255" r="15" style="fill:none;stroke:red"/>
              <circle cx="142" cy="140" r="15" style="fill:none;stroke:red"/>
              <circle cx="262" cy="140" r="15" style="fill:none;stroke:red"/>
          </lodobj>
        </pool>
    </defs>
    ...
    <g id="LoD">
          <g lod:doLevel="pselect('pf',0)" onload="pselectInit(evt,'pf',0)"/>
    </g>
</svg>
|
Figure 14: Adding the attribute
action="filter"to the<pool>elementfor the method of LoD filtering. Corresponding grphics are shown in Figure 15 .
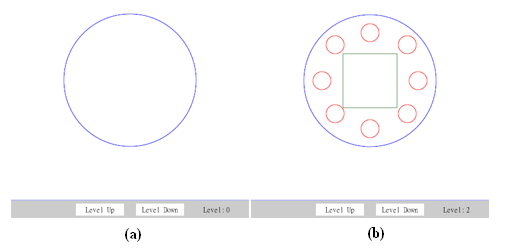
Figure 15: The effect of LoD filtering, similar but different to LoD selection. (a) the initial graphics with
sn="0"; (b) after settingsn="2"(SVG source at filtering.svg).
In this paper, we investigate the isseus of realizing adaptive Level-of-Detail(LoD) in SVG. We present a general model to address the LoD issues in SVG in a sensible way. We observe that the issue of adaptive LoD is still at the beginning but the needs for such a mechanism is evident. In the working draft of SVG 1.2, the funtionality of alternating the content based on display resolutions has been proposed via extending the <switch> element
[SVG 1.2, multiple resolutions]
. However, it seems that the consideration of conditional or alternative content could be part of the conceptual framework of adaptive LoD. The design in SVG 1.2 is closer to the method of LoD selection mentioned preciously in this paper. Just as what we have shown in this paper, there are other methods worthy considering when designing for LoD vocabularies in SVG.
In the future, we expect to incorporate this approach with system-level methods (e.g., the data-driven approach) such as those described in [Cecconi & Galanda, 2002] for further practical applications. In particular, it would be quite beneficial to incorporate the method of adaptive LoD into the Taiwan Social Map system for advancing the usability of multi-facets social and geometric mapping [Chang & Chuang, 2002] .
The work reported here is supported, in part, by the National Science Council of Taiwan (contract no. NSC-93-2625-Z-001-001) and by Anchorpoint Digital Inc. via a subcontract from the Department of Urban Development, Taipei City Government.
XHTML rendition created by gcapaper Web Publisher v2.1, © 2001-3 Schema Software Inc.