We propose the very first non-intrusive measurement methodology for quantifying
the performance of commodity Virtual Reality (VR) systems. Our methodology considers the
VR system under test as a black-box and works with any VR applications.
Multiple performance metrics on timing and positioning accuracy are considered,
and detailed testbed setup and measurement steps are presented. We also apply
our methodology to several VR systems in the market, and carefully analyze the
experiment results. We make several observations: (i) 3D scene complexity
affects the timing accuracy the most, (ii) most VR systems implement the dead
reckoning algorithm, which incurs a non-trivial correction latency after
incorrect predictions, and (iii) there exists an inherent trade-off between two
positioning accuracy metrics: precision and sensitivity.
Keywords: Measurement; Head Mounted Display; Virtual Reality; Quality of Experience; latency; accuracy; sensitivity
1 Introduction
Virtual Reality (VR) renders computer-generated objects to create virtual
environments for users [7], which enables many applications, such as
military, healthcare, and video games, and thus becomes more and more popular.
In fact, market research [3] indicates that the VR's annual market
could grow to $80 billion in 10 years, compared to the current laptop computer market
at $111 billion and game console market at $14 billion. The main
driving force behind such a high growth rate is the commodity
Head-Mounted Displays (HMDs) recently built for desktop and mobile
VR systems, including Sony Morpheus, Microsoft HoloLens, Oculus Rift, and
HTC Vive [1].
VR systems with HMDs were first built in research labs decades
ago [14], using miniature Cathode Ray Tubes (CRTs) for
displaying and mechanical/ultrasonic sensors for head tracking, in order to
change the rendered images when the user moves. Over years, various hardware
components have been enhanced for better VR experience at lower costs. Among
these components, the compact and inexpensive Micro-Electro-Mechanical System
(MEMS) sensors and high-resolution displays, which are also adopted by
smartphones, allow VR developers, such as Oculus [8], to build
commodity HMDs for VR systems. In these HMDs, the cumbersome
mechanical/ultrasonic head-tracking sensors are replaced by MEMS inertial
sensors with accelerometers and gyroscopes. However, these commodity VR
systems suffer from drifting due to integration over potentially biased inertial
sensor readings [15], which may be nontrivial as the sensors are likely
to be inexpensive. This kind of drifting leads to inaccurate
head-tracking results, which in turn cause cybersickness, like nausea,
disorientation, headaches, sweating, and eye strain [4]. Hence,
quantifying the performance of the commodity VR systems is crucial for
faster and wider adoption.
Measuring the performance of the commodity VR systems is no easy task, because
these HMDs are consumer-grade products with limited, if any, hardware and
software accessibility. Moreover, these VR systems consist of multiple
entities, including HMDs, rendering desktops or smartphones, VR applications,
and dead reckoning algorithms. Since these entities all directly affect the
system performance, we propose a system-wide black-box measurement methodology
in this paper. Our methodology is general, because it does not: (i) instrument
the VR systems (e.g., VR applications and HMDs) nor (ii) assume the existence
of a specific (easy to recognize) virtual object. In other words, our
methodology works with off-the-shelf VR systems, which to our best knowledge,
is not possible in prior studies [10,6,13,5].
Furthermore, our measurement methodology quantifies several variations of the
timing and positioningaccuracy metrics, which were not
discussed in the literature. Timing accuracy, like delay, quantifies the temporal gaps between physical and virtual worlds. On the other side, positioning accuracy quantifies the spatial gaps like precision. We apply the methodology to several commodity VR
systems, and analyze the measurement results. Several observations are made
from our experiment results: (i) 3D scene complexity affects the timing
accuracy the most, showing the importance of rendering desktops or smartphones,
(ii) most VR systems (3 out of 4) implement the dead reckoning algorithm, which
shortens the time of reacting to head movements, but incurs a non-trivial
correction latency after incorrect predictions, and (iii) there exists an
inherent trade-off between two positioning accuracy metrics: some VR systems
opt for higher precision, while others opt for higher sensitivity.
2 Related Work
The implications of low-level VR system performance, such as latency, on high-level
user experience have been studied using carefully-designed subjective tests.
For example, Papadakis et al. [9] investigate the relation between
spatial memory performance and latency. Young et al. [16] compare
the performance of two VR systems by asking subjects to perform diverse tasks, such
as sorting and searching, and provide opinion scores. Samaraweera et
al. [12] study whether mobility impaired patients are less vulnerable
to cybersickness due to the latency. These subjective experiments are
complementary to our work that focuses on objective experiments
on commodity VR systems.
There are few existing work proposing methodologies to measure the latency of
VR systems. Papadakis et al. [10] present a system with photodiodes, an
oscilloscope, and a servo-motor to measure the latency of a head-tracking
(inertial) sensor. They manually read the measurement results from the
oscilloscope, which may be error-prone. Steed [13] proposes to create
a virtual pendulum, and configures it to follow a head-tracking sensor that
moves in a sinusoidal pattern. The measured results of the pendulum and
the head-tracking sensor are fit to sinusoidal functions, which are then used to
calculate the latency.
Di Luca [5] proposes to use two photodiodes to capture the position
of the head-tracking sensor based on gradient images. The signals from
photodiodes need to be processed, which may result in additional and unknown
latency, and over-estimated latency. Friston and Steed [6] propose an
automated frame counting approach to measure latency using an easily-recognized
virtual object that follows the movement of a head-tracking sensor. They assume
that this virtual object is never occluded by other objects. Compared to prior
arts [10,13,5,6], our work: (i) considers a wider
spectrum of performance metrics, and (ii) works with off-the-shelf VR applications
in arbitrary scenes.
3 Methodology
Our proposed methodology controls the movements of an HMD, and measure the
differences between the physical and virtual world states using off-the-shelf
VR applications. We describe the design of testbed, performance metrics, measurement procedures,
and post-processing steps in the rest of this section.
3.1 Testbed Setup
The measurement testbed comprises a number of components: (i) a rotating
platform [2] to emulate head (HMD) movements, (ii) an external display that mirrors
the view in the HMD, and (iii) a high-speed camera that captures both the HMD
device and the HMD view. We aim to support both desktop and mobile VR systems.
Desktop VR systems (such as Oculus Rift) have dedicated HMD devices, while
mobile VR systems (such as Samsung Gear VR) directly use smartphones within
cases that work as HMD devices. For brevity, we use HMD devices to refer to
the devices that provide VR view in both desktop and mobile VR systems.
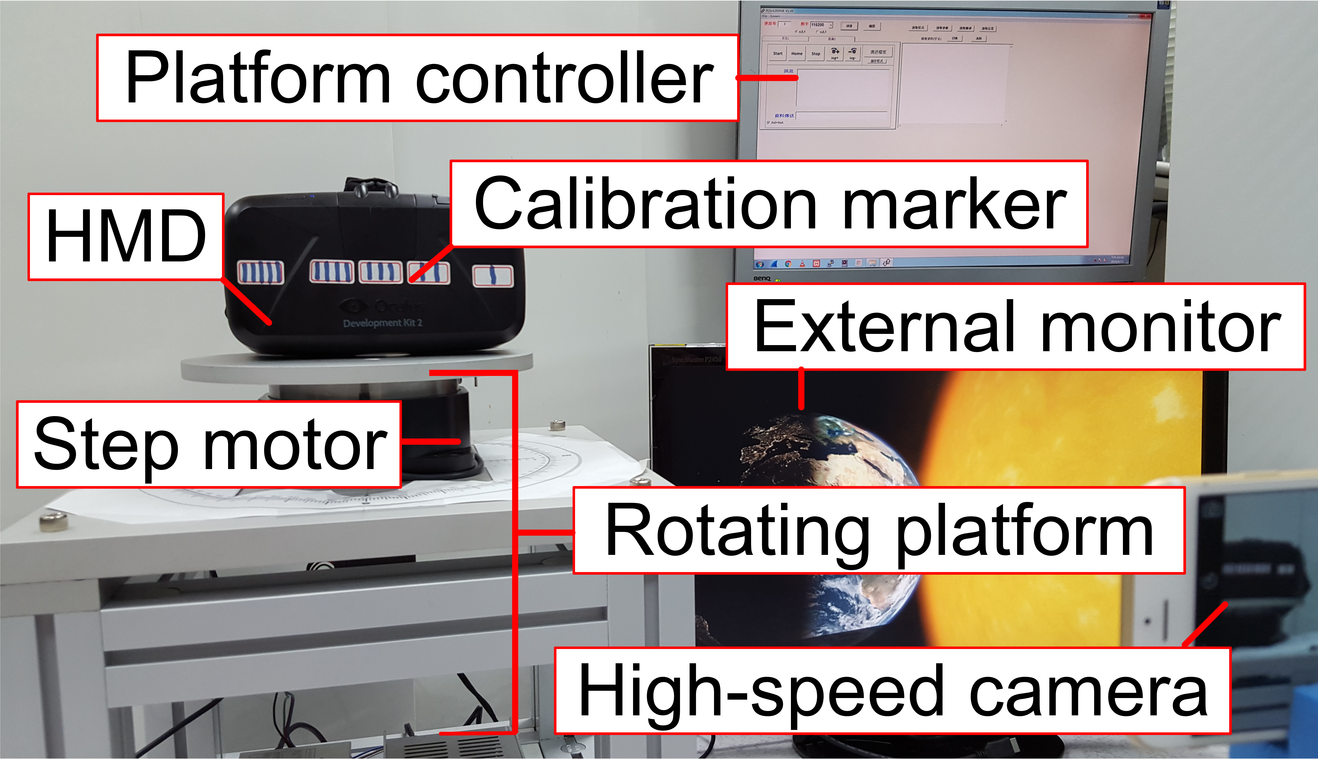
(a) With Oculus Rift
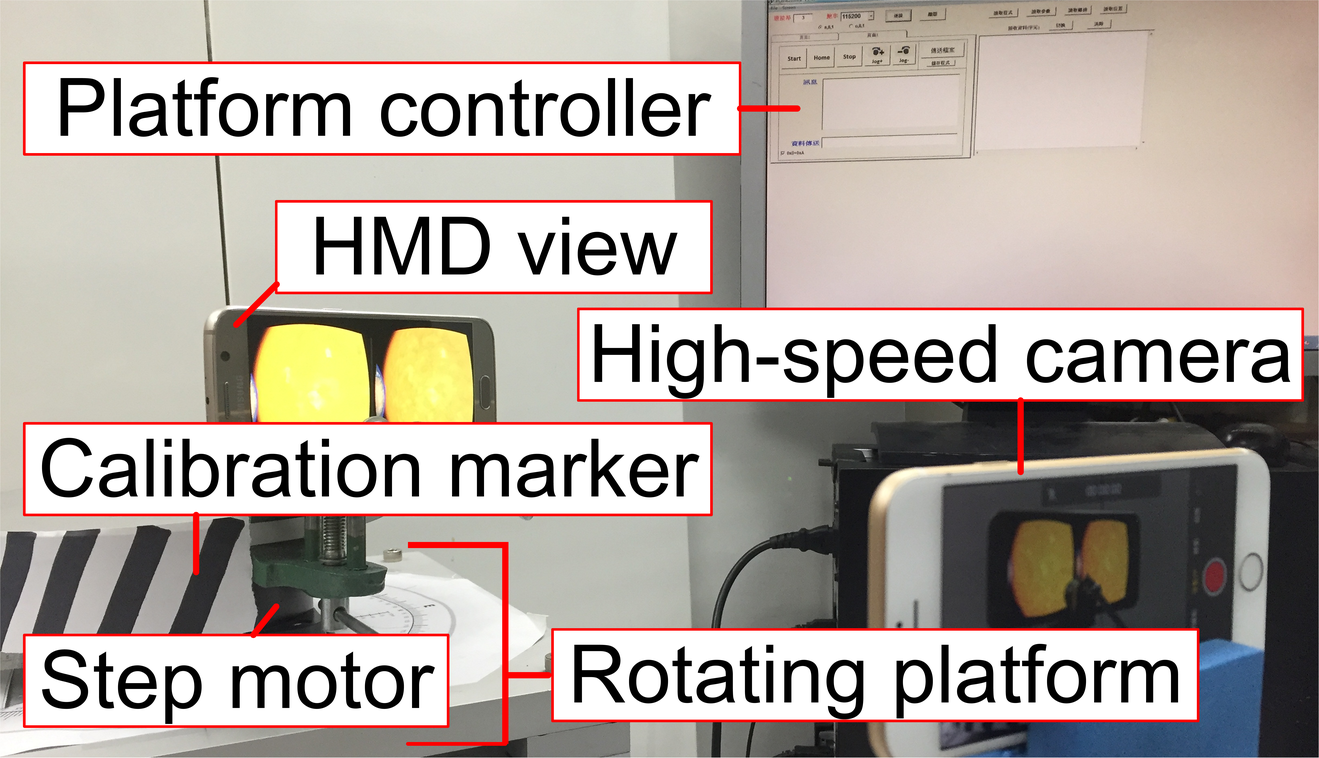
(b) With Google Cardboard
Figure 1: Testbed setup.
Figure 1 shows the testbed for Oculus Rift and Google
Cardboard HMDs. As shown in this figure, the HMD device is mounted on
the rotating platform. For desktop VR systems, we redirect the HMD view to an
external display via an HDMI cable. For mobile VR systems, no external display
is used, because the smartphone (Samsung S6) used in our testbed does not
support any HDMI output. In either cases, the high-speed camera needs to shoot both
the HMD device and the HMD view (either on the external monitor or the
smartphone display). We use Apple iPhone 6 as the high-speed camera, which
supports continuous 240 fps (frame-per-second) video recording.
To emulate the movement of HMDs in action, a rotating platform is used to
mimic various human head motions. The platform comes with a high-quality step
motor, and is fast and accurate even when it is loaded with up to 10 KG
objects. More specifically, the platform can rotate at angular speed from
0.001 rpm (revolutions per minute) to 200 rpm with a stepping resolution of
0.007°.
3.2 Performance Metrics
The basic requirement of a VR system is to track the physical motions
and provide corresponding visual/multimodal feedbacks
as realistic as possible. Hence,
we quantify the performance of the VR systems in two aspects: timing
and positioning accuracy.
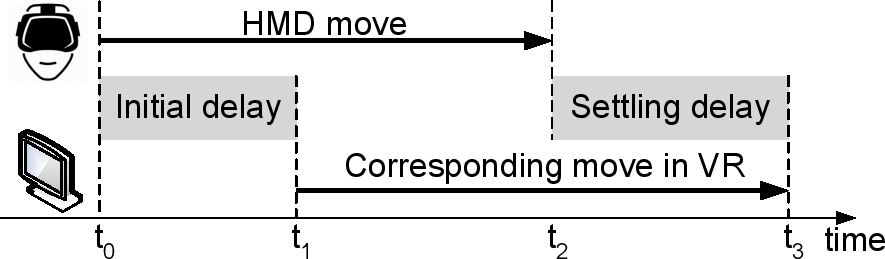
Figure 2: Illustrations of initial and settling delays in VR systems.
(a) Based on the initial reference frame (b) The settled reference frame
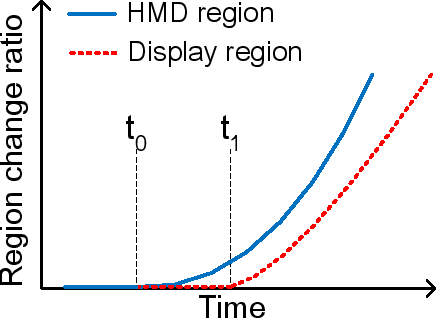
Figure 3: Detection of change points on the region change ratio time series.
Timing accuracy. Timing accuracy is critical
as it is highly related to a variety of cybersickness, such as nausea,
disorientation, and headaches. We define the following two metrics to
quantify timing accuracy, which are also illustrated in
Figure 2.
Initial delay: The time difference between the start of head
motion (t0) and that of the corresponding feedback in the virtual world (t1).
Settling delay: The time difference between the stop of head
motion (t2) and that of the corresponding feedback in the virtual world (t3).
Positioning accuracy:
The spatial inconsistency between physical moves and visual feedback is another major cause of cybersickness.
We accordingly define two metrics as follows.
Precision: The angular positioning consistency between
physical moves and visual feedbacks in the virtual world in terms of degrees.
Sensitivity: The capability of HMD inertial sensors to
perceive subtle motions and subsequently provide feedbacks to users.
3.3 Measurement Procedures
The measurement procedures for the four performance metrics are all similar,
and are presented in the following. First, we select a VR application as the
experiment scenario. Second, we configure the desired motion parameters that
will be performed by the rotating platform, such as (angular) velocity and
rotation angle. Last, we start both the rotating platform and high-speed camera
to record the motion of the HMD and the HMD view.
We recommend repeating each experiment at least 20 rounds
for statistically meaningful results.
Table 1: The Considered Commodity VR Systems
Desktop VR Systems
Mobile VR Systems
Name
3Glasses D2
Oculus Rift DK2
Google Cardboard
Samsung Gear VR
Dim. (mm)
192.5×88×88
181×120.5×91
154.5×88.5×81
201.9×166.4×92.6
Weight (g)
246
440
213
446
FoV (°)
110
100
96
96
Display
2560×1440, 60 Hz
2560×1440, 75 Hz
2560×1440, 60 Hz
CPU
Intel i7-4790 CPU 3.60 GHz
4-core Cortex-A57 2.1 GHz and
4-core Cortex-A53 1.5 GHz
GPU
GeForce GTX 645
Mali-T760 MP8
RAM
32 GB
3 GB
Since we rely on video recordings to monitor the HMD motions and the
corresponding visual feedbacks on HMD view, it is important for the HMD view
needs to be fully observable by the high-speed camera when the rotation starts
and ends. This becomes an issue if the HMD does not support the mirroring of
its view to an external display.
For example, as Samsung S6 does not support external displays, its view would leave the capture range of the high-speed camera when the rotation starts, and thus the corresponding visual feedback on the HMD view cannot be captured.
A possible workaround is to fixate the high-speed camera on the rotating platform, but the vibrations of
the platform lead to blur videos, in our experience. Hence, currently the initial delay is not
measured for mobile VR systems that do not support external monitors.
3.4 Post-processing Steps
Several post-processing steps need to be performed to extract the performance
results. The input to the post-processing steps is the recorded video from the
high-speed camera. Since each experiment consists of multiple repeated rounds
(say N), we leverage the sound made by the rotating platform (i.e., the step
motor) to cut the video recording in N clips. Furthermore, the video clips
are converted to gray scale before the content analysis, which is detailed
below.
First, we need to derive two reference frames from each video
clip. The initial reference frame is derived as the average of
the first K frames1, where the
settled reference frame is derived as the average of the last
K frames in each video clip. For each reference frame, we
define two regions: (i) the HMD region, which comprises the
calibration marks on the HMD or on the upper tray of the rotating
platform (see Figure 1) across video frames. The
purpose of the calibration marks is to add some salient points on the rotating
platform and HMD so that the angular changes of HMDs can be easily
identified; (ii) the display region, which comprises the HMD
view on the
video frame.
Next, for a reference-frame-and-region pair (F, R), we
compute the region change ratio in percentage of the changed
pixels in the region R compared with the reference frame F, where a
pixel is considered changed if the pixel's gray level is significantly
different from that of the same pixel on the reference frame
F2.
Timing accuracy.
We first obtain four time series based on the combinations of two regions and
two reference frames. We then apply the change point detection
algorithm [11] to automatically identify t0 and t2 from
the region change ratios based on the initial reference frame, and
t1 and t3 from those based on the settled reference frame.
The derivations are summarized in Figure 3.
Positioning accuracy.
The precision is computed as the region change ratio of the display
region by comparing the initial and settled reference frames.
The sensitivity is computed as the ratio of sensible rounds
in all the rounds; a round is considered as sensible, if we can find
any difference in the display region between the initial and settled
reference frames.
Figure 4: Initial delay under different scene complexities.
Figure 5: Settling delay under different rotation angles.
Figure 6: Settling delay under different scene complexities.
Figure 7: Precision under different rotation angles.
Figure 8: Sensitivity under different degrees per move.
Figure 9: Trade-off between precision and sensitivity under 3 sample settings.
4 Experiments
4.1 Considered VR Systems
We compare the performance of four commodity VR systems, as illustrated in
Table 1, which are available at the time of writing. 3Glasses D2
(3GD2) and Oculus Rift DK2 (ORDK2) are desktop VR systems connected to an Intel i7 PC
via HDMI and USB cables for rendering 3D scenes. Google Cardboard (GC) and
Samsung Gear VR (SGVR) are mobile VR systems that work with smartphones. GC is
a chassis that holds a smartphone and lenses for low-cost VR experience. In
contrast, SGVR dictates a Samsung smartphone connected via micro USB. We use
Samsung S6 in GC and SGVR for rendering 3D scenes, because it is supported by
both VR systems. Besides, the off-the-shelf VR application used in our experiment is Titans of Space, because it is available for the four VR systems under test and also provides a common ground for further comparisons.
4.2 Experiment Results
We repeat each experiment 20 times with individual VR systems. The two major
parameters are rotation angle (in rad) and velocity (in rad/s) If not otherwise
specified, we set the angle as π/2 and the velocity as π.
Initial delay. We compare the initial delay of desktop VR systems under
different rotation angles from 2 π to 20π rad. We find the initial
delay remains very similar: about 44 ms and 48 ms for 3GD2
and ORDK23. We also compare the initial delay
under different velocities from π/ 8 to π rad/s, and observe no clear
difference.
Figure 4 shows the initial delay under different
scene complexities, which are quantified by compressing each screenshot image
into jpeg at quality level of 85%. We observe that: (i) higher complexity
results in longer initial delay, and (ii) ORDK2 tends to have a slightly longer
initial delay.
Settling delay. We next compare the settling delay of all four VR
systems. Figure 5 reports the settling delay under
different rotation angles. This figure shows that most VR systems (except
ORDK2) suffer from longer settling delay under larger rotation angles. The
unique behavior of ORDK2 may be attributed to the unique kinematic
constraints [8] implemented in it. The implication of velocity on the settling delay is
not clear in our experiments. The VR systems sorted in the descending order of
settling delay are GC (90 ms), SGVR (80 ms), ORDK2 (75 ms), and 3GD2 (60 ms).
Figure 6 gives the settling delay under
different scene complexities. We observe that, similar to initial delay, higher
complexity leads to longer settling delay. Moreover, desktop VR systems
generally result in shorter settling delay than mobile VR systems, which can be attributed
to: (i) less expensive inertial sensors and (ii) lower computational power
of smartphones.
Correction latency. We observe that when the motion of an HMD stops, the wrong estimation of the dead reckoning algorithm at that time would make the HMD view overstep the right position and take additional time to correct. During settling down, the time spent on correcting is defined as correction latency.
Figure 10 gives the fraction of the
correction latency in the settling delay, and 3GD2 always has zero correction latency,
showing that no dead reckoning algorithm is implemented in 3GD2. This figure also reveals that in most VR systems (except 3GD2), especially mobile VR systems, correction latency
represents a nontrivial portion of settling delay. Moreover, we find the
correction latency is quite diverse on different VR systems: from
about 40 ms in ORDK2 to about 80 ms and 90 ms in SGVR and GC. The correction
latency is one of the side effect of the dead reckoning algorithm. We also
conduct rigorous experiments to quantify the benefit of the dead
reckoning algorithm. Due to the space limitation, we only give a high-level
sample observation: thanks to the dead reckoning algorithm, ORDK2 reacts to
head movements sooner and displays the same 3D scenes about 10 ms earlier than
3GD2 on average.
Precision and sensitivity. We vary the rotation angles from 2 π to
20 π rad, and plot the precision of the four VR systems in
Figure 7. This figure depicts that the VR systems sorted by
the precision in the descending order are SGVR, ORDK2, GC, and 3GD2. Such
diversity of precision may be attributed to the design choices, e.g., some
developers may prefer very high precision and filter out small noises (or
movements). To verify this, we next vary the degree per move from 0.01 to 0.5,
and plot the sensitivity of the four VR systems in Figure 8.
This figure confirms our conjecture: VR systems that achieve higher precision,
also suffer from lower sensitivity in general. To better visualize such
trade-off, we select three sample settings on precision and sensitivity as
follows. Hard is 20 π rad and 0.01 degree per move; medium is
5 π and 0.05; and easy is π and 0.5. The results are given
in Figure 9. We make two observations from this
figure. First, all VR systems perform well under the easy setting. Second,
curves closer to the lower-right corner represent more sensitive, but less
precise VR systems. In other words, 3GD2 is the most sensitive VR system, while SGVR
is the most precise one.
Figure 10: Portion of correction latency in settling delay.
5 Conclusion
We presented a measurement methodology to quantify the timing and positioning
accuracy of commodity VR systems. Our methodology considers the VR system under
test as a black-box and works with any VR applications without code instruments
and system modifications. We applied the methodology to four commodity VR
systems to demonstrate its effectiveness. Several interesting observations were
made from our experiments. For example, some VR systems opt for higher
precision at the expense of lower sensitivity, while others prefer higher
sensitivity and lower precision. Our proposed methodology may be leveraged by
VR researchers and developers to better quantify the system-wide performance in
both objective and subjective experiments.
6 Acknowledgements
This work was partially supported by the Ministry of Science and Technology of Taiwan under the grants: 103-2221-E-001-023-MY2 and
102-2221-E-007-062-MY3.
References
[1]
HTC Vive vs Oculus Rift vs PlayStation VR.
http://www.itpro.co.uk/desktop-hardware/25186/htc-vive-vs-oculus-rift-vs-playstation-vr-big-three-set-to-drive-just-13-per.[2]
Rotating platform specification.
http://www.extion.com.tw/c/pdf/1/usc.pdf.[3]
Virtual reality could become an $80b industry: Goldman.
http://www.cnbc.com/2016/01/14/virtual-reality-could-become-an-80b-industry-goldman.html.[4]
S. Davis, K. Nesbitt, and E. Nalivaiko.
A systematic review of cybersickness.
In Proc. of Australasian Conference on Interactive Entertainment
(IE'14), pages 1-9, Newcastle, Australia, December 2014.
[5]
M. Di Luca.
New method to measure end-to-end delay of virtual reality.
Presence, 19(6):569-584, December 2010.
[6]
S. Friston and A. Steed.
Measuring latency in virtual environments.
IEEE Transactions on Visualization and Computer Graphics,
20(4):616-625, April 2014.
[7]
D. Krevelen and R. Poelman.
A survey of augmented reality technologies, applications and
limitations.
The International Journal of Virtual Reality, 9(2):1-20,
January 2010.
[8]
S. LaValle, A. Yershova, M. Katsev, and M. Antonov.
Head tracking for the Oculus Rift.
In Proc. of IEEE International Conference on Robotics and
Automation (ICRA'14), pages 187-194, Hong Kong, China, May 2014.
[9]
G. Papadakis, K. Mania, M. Coxon, and E. Koutroulis.
The effect of tracking delay on awareness states in immersive virtual
environments: An initial exploration.
In Proc. of ACM International Conference on Virtual Reality
Continuum and Its Applications in Industry (VRCAI'11), pages 475-482, Hong
Kong, China, December 2011.
[10]
G. Papadakis, K. Mania, and E. Koutroulis.
A system to measure, control and minimize end-to-end head tracking
latency in immersive simulations.
In Proc. of ACM International Conference on Virtual Reality
Continuum and Its Applications in Industry (VRCAI'11), pages 581-584, Hong
Kong, China, December 2011.
[11]
K. Rebecca and E. Idris.
changepoint: An R package for changepoint analysis.
Journal of Statistical Software, 58(3):1-19, 2014.
[12]
G. Samaraweera, R. Guo, and J. Quarles.
Head tracking latency in virtual environments revisited: Do users
with multiple sclerosis notice latency less?
IEEE Transactions on Visualization and Computer Graphics,
22(5):1630-1636, May 2016.
[13]
A. Steed.
A simple method for estimating the latency of interactive, real-time
graphics simulations.
In Proc. of ACM Symposium on Virtual Reality Software and
Technology (VRST'08), pages 123-129, Bordeaux, France, October 2008.
[14]
I. Sutherland.
A head-mounted three dimensional display.
In Proc. of Fall Joint Computer Conference (AFIPS'68), pages
757-764, San Francisco, CA, December 1968.
[15]
G. Welch and E. Foxlin.
Motion tracking: No silver bullet, but a respectable arsenal.
IEEE Computer Graphics and Applications, 22(6):24-38,
November/December 2002.
[16]
M. Young, G. Gaylor, S. Andrus, and B. Bodenheimer.
A comparison of two cost-differentiated virtual reality systems for
perception and action tasks.
In Proc. of ACM Symposium on Applied Perception (SAP'14), pages
83-90, Vancouver, Canada, August 2014.
Footnotes:
1. We empirically choose K=100 and find that the results are not sensitive to the K values.
2. The threshold for the gray level difference is empirically set to 30
(in the range of 0-255).
3. Figures that carry less information are not shown throughout
this paper, due to the space limitations.
Sheng-Wei Chen (also known as Kuan-Ta Chen) http://www.iis.sinica.edu.tw/~swc
Last Update September 28, 2019
 (a) With Oculus Rift
 (b) With Google Cardboard
 (a) Based on the initial reference frame
  (b) The settled reference frame