The authors would like to thank Wei Tsang Ooi and the anonymous
reviewers
for their constructive comments.
This work was supported in part by Taiwan Information Security Center
(TWISC), National Science Council under the grant NSC98-2219-E-011-001. This
work was supported in part by the Taiwan E-learning and Digital Archives
Program (TELDAP), sponsored by the National Science Council of Taiwan under
grants NSC98-2631-001-011 and NSC98-2631-001-013. It was also supported in
part by the National Science Council of Taiwan under grants
NSC96-2628-E-001-027-MY3 and NSC98-2221-E-001-017.
[1]
H.264/AVC reference software JM 15.1.
http://iphome.hhi.de/suehring/tml/.
[2]
O. Alonso, D. E. Rose, and B. Stewart.
Crowdsourcing for relevance evaluation.
SIGIR Forum, 42(2):9-15, 2008.
[3]
A. Blanc, Y.-K. Liu, and A. Vahdat.
Designing incentives for peer-to-peer routing.
In
Proceedings of IEEE INFOCOM 2005, pages 374-385, March
2005.
[4]
P. Bordia.
Face-to-face versus computer-mediated communication: A synthesis of
the experimental literature.
Journal of Business Communication, 34(1):99-118, 1997.
[5]
D. Brabham.
Crowdsourcing as a model for problem solving: An introduction and
cases.
Convergence, 14(1):75, 2008.
[6]
R. A. Bradley and M. E. Terry.
Rank analysis of incomplete block designs: I. the method of paired
comparisons.
Biometrika, 39(3/4):324-345, 1952.
[7]
K.-T. Chen, C.-Y. Huang, P. Huang, and C.-L. Lei.
Quantifying Skype User Satisfaction.
In
Proceedings of ACM SIGCOMM 2006, Pisa, Itlay, Sep 2006.
[8]
K.-T. Chen, C. C. Tu, and W.-C. Xiao.
OneClick: A Framework for Measuring Network Quality of Experience.
In
Proceedings of IEEE INFOCOM 2009, April 2009.
[9]
S. Choisel and F. Wickelmaier.
Evaluation of multichannel reproduced sound: Scaling auditory
attributes underlying listener preference.
The Journal of the Acoustical Society of America,
121(1):388-400, 2007.
[10]
H. A. David.
The Method of Paired Comparisons.
Oxford University Press, 1988.
[11]
R. Dittrich, R. Hatzinger, and W. Katzenbeisser.
Modelling the effect of subject-specific covariates in paired
comparison studies with an application to university rankings.
Journal of the Royal Statistical Society (Series C): Applied
Statistics, 47(4):511-525, 1998.
[12]
B. Duffy, K. Smith, G. Terhanian, and J. Bremer.
Comparing data from online and face-to-face surveys.
Internation Journal of Market Research, 47(6):615-639, 2005.
[13]
A. Fernandes, E. Kotsovinos, S. Otring, and B. Dragovic.
Pinocchio: Incentives for honest participation in global-scale
distributed trust management.
In
Proceedings of iTrust��2004, pages 63-77, 2003.
[14]
C.-J. Ho, T.-H. Chang, and J. Y.-j. Hsu.
Photoslap: A multi-player online game for semantic annotation.
In
Twenty-Second Conference on Artificial Intelligence
(AAAI-07), Vancouver, British Columbia, July 2007.
[15]
C.-J. Ho and K.-T. Chen.
On formal models for social verification.
In
Proceedings of Human Computation Workshop 2009 (affiliated to
ACM KDD 2009), Paris, France, 2009.
[16]
J. Howe.
The rise of crowdsourcing.
Wired Magazine, 14(6):176-183, 2006.
[17]
Y. Ito and S. Tasaka.
Quantitative assessment of user-level QoS and its mapping.
IEEE Transactions on Multimedia, 7(3):572-584, June 2005.
[18]
ITU-R Recommendation BT.500-11.
Methodology for the subjective assessment of the quality of
television pictures, 2002.
[19]
ITU-R Recommendation P.800.
Methods for subjective determination of transmission quality, 1996.
[20]
ITU-T Recommendation J.247.
Objective perceptual multimedia video quality measurement in the
presence of a full reference, 2008.
[21]
ITU-T Recommendation P.862.
Perceptual evaluation of speech quality (PESQ), an objective method
for end-to-end speech quality assessment of narrow-band telephone networks
and speech codecs, 2001.
[22]
R. Jain.
Quality of experience.
IEEE Multimedia, 11(1):96-97, Jan.-March 2004.
[23]
S. Jain, Y. Chen, and D. C. Parkes.
Designing incentives for online question and answers forums.
In
10th ACM Electronic Commerce Conference (EC'09), 2009.
[24]
R. Jurca and B. Faltings.
An incentive compatible reputation mechanism.
In
Proceedings of IEEE International Conference on E-Commerce
Technology, pages 285-292, June 2003.
[25]
A. Kittur, E. H. Chi, and B. Suh.
Crowdsourcing user studies with mechanical turk.
In
Proceedings of ACM CHI'08, pages 453-456, 2008.
[26]
C. L. Knott and M. S. James.
An alternate approach to developing a total celebrity endorser rating
model using the analytic hierarchy process.
International Transactions in Operational Research,
11(1):87-95, 2004.
[27]
R. D. Luce.
Individual Choice Behavior: A Theoretical Analysis.
Wiley, New York, 1959.
[28]
J. N. S. Matthews and K. P. Morris.
An application of bradley-terry-type models to the measurement of
pain.
Applied Statistics, 44:243-255, 1995.
[29]
N. L. Powers and R. M. Pangborn.
Paired comparison and time-intensity measurements of the sensory
properties of beverages and gelatins containing sucrose or synthetic
sweeteners.
Journal of Food Science, 43(1):41-46, 1978.
[30]
P. Resnick, K. Kuwabara, R. Zeckhauser, and E. Friedman.
Reputation systems.
Commun. ACM, 43(12):45-48, 2000.
[31]
P. Rossi, Z. Gilula, and G. Allenby.
Overcoming scale usage heterogeneity: A bayesian hierarchical
approach.
Journal of the American Statistical Association,
96(453):20-31, 2001.
[32]
T. L. Saaty.
A scaling method for priorities in hierarchical structures.
Journal of Mathematical Psychology, 15(3):234-281, 1977.
[33]
M. V. Selm and N. W. Jankowski.
Conducting online surveys.
Quality and Quantity, 40(3):435-456, 2006.
[34]
A. Sorokin and D. Forsyth.
Utility data annotation with Amazon Mechanical Turk.
In
Computer Vision and Pattern Recognition Workshops (CVPRW
'08), pages 1-8, June 2008.
[35]
S. Tasaka, H. Yoshimi, A. Hirashima, and T. Nunome.
The effectiveness of a QoE-based video output scheme for
audio-video IP transmission.
In
Proceeding of ACM Multimedia 2008, pages 259-268,
Vancouver, Canada, 2008.
[36]
A. Watson and M. A. Sasse.
Measuring perceived quality of speech and video in multimedia
conferencing applications.
In
Proceedings of ACM Multimedia 1998, pages 55-60. ACM, 1998.
[37]
K. B. Wright.
Researching Internet-based populations: Advantages and
disadvantages of online survey research, online questionnaire authoring
software packages, and web survey services.
Journal of Computer-Mediated Communication, 3(10), 2005.
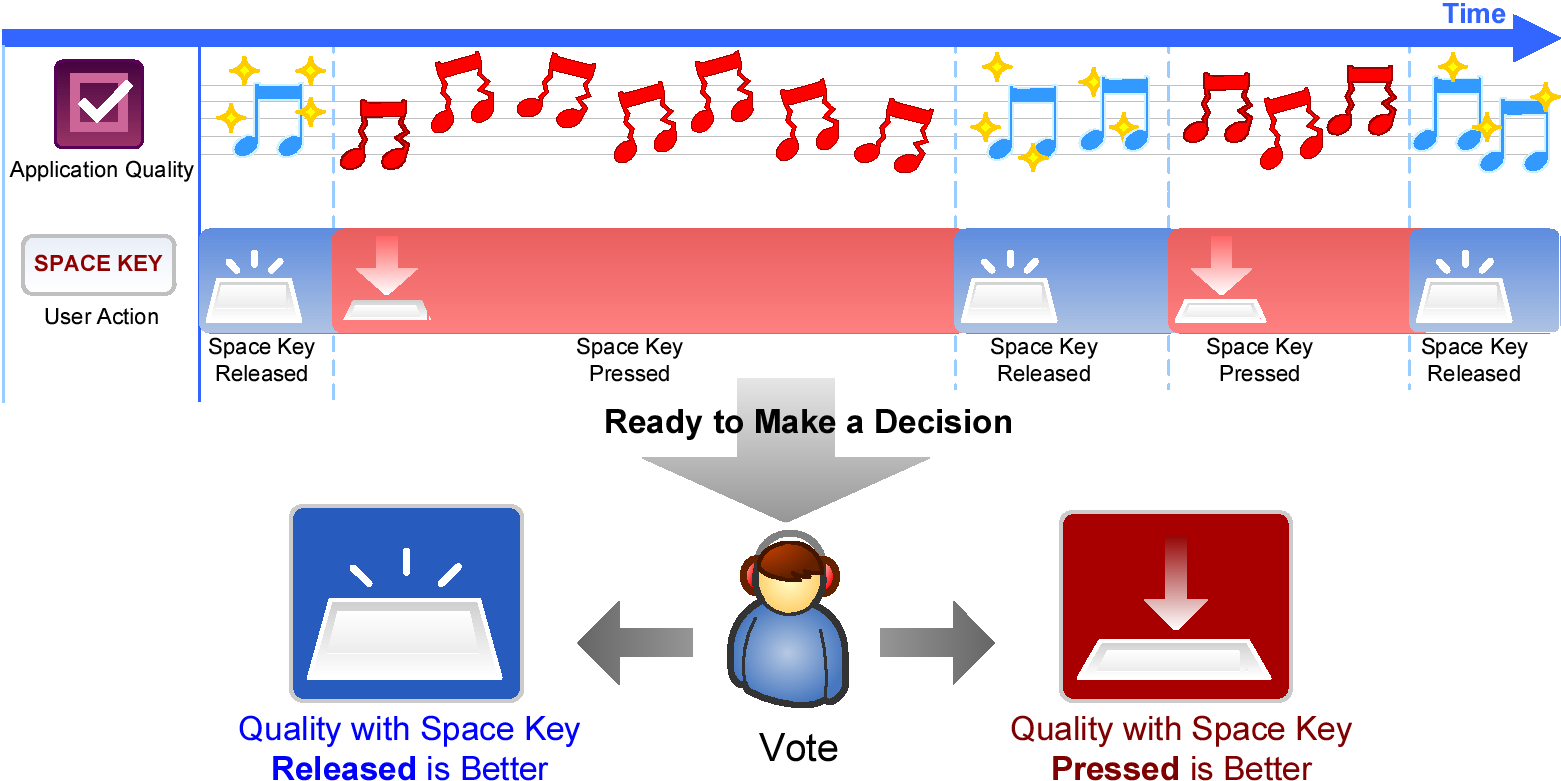
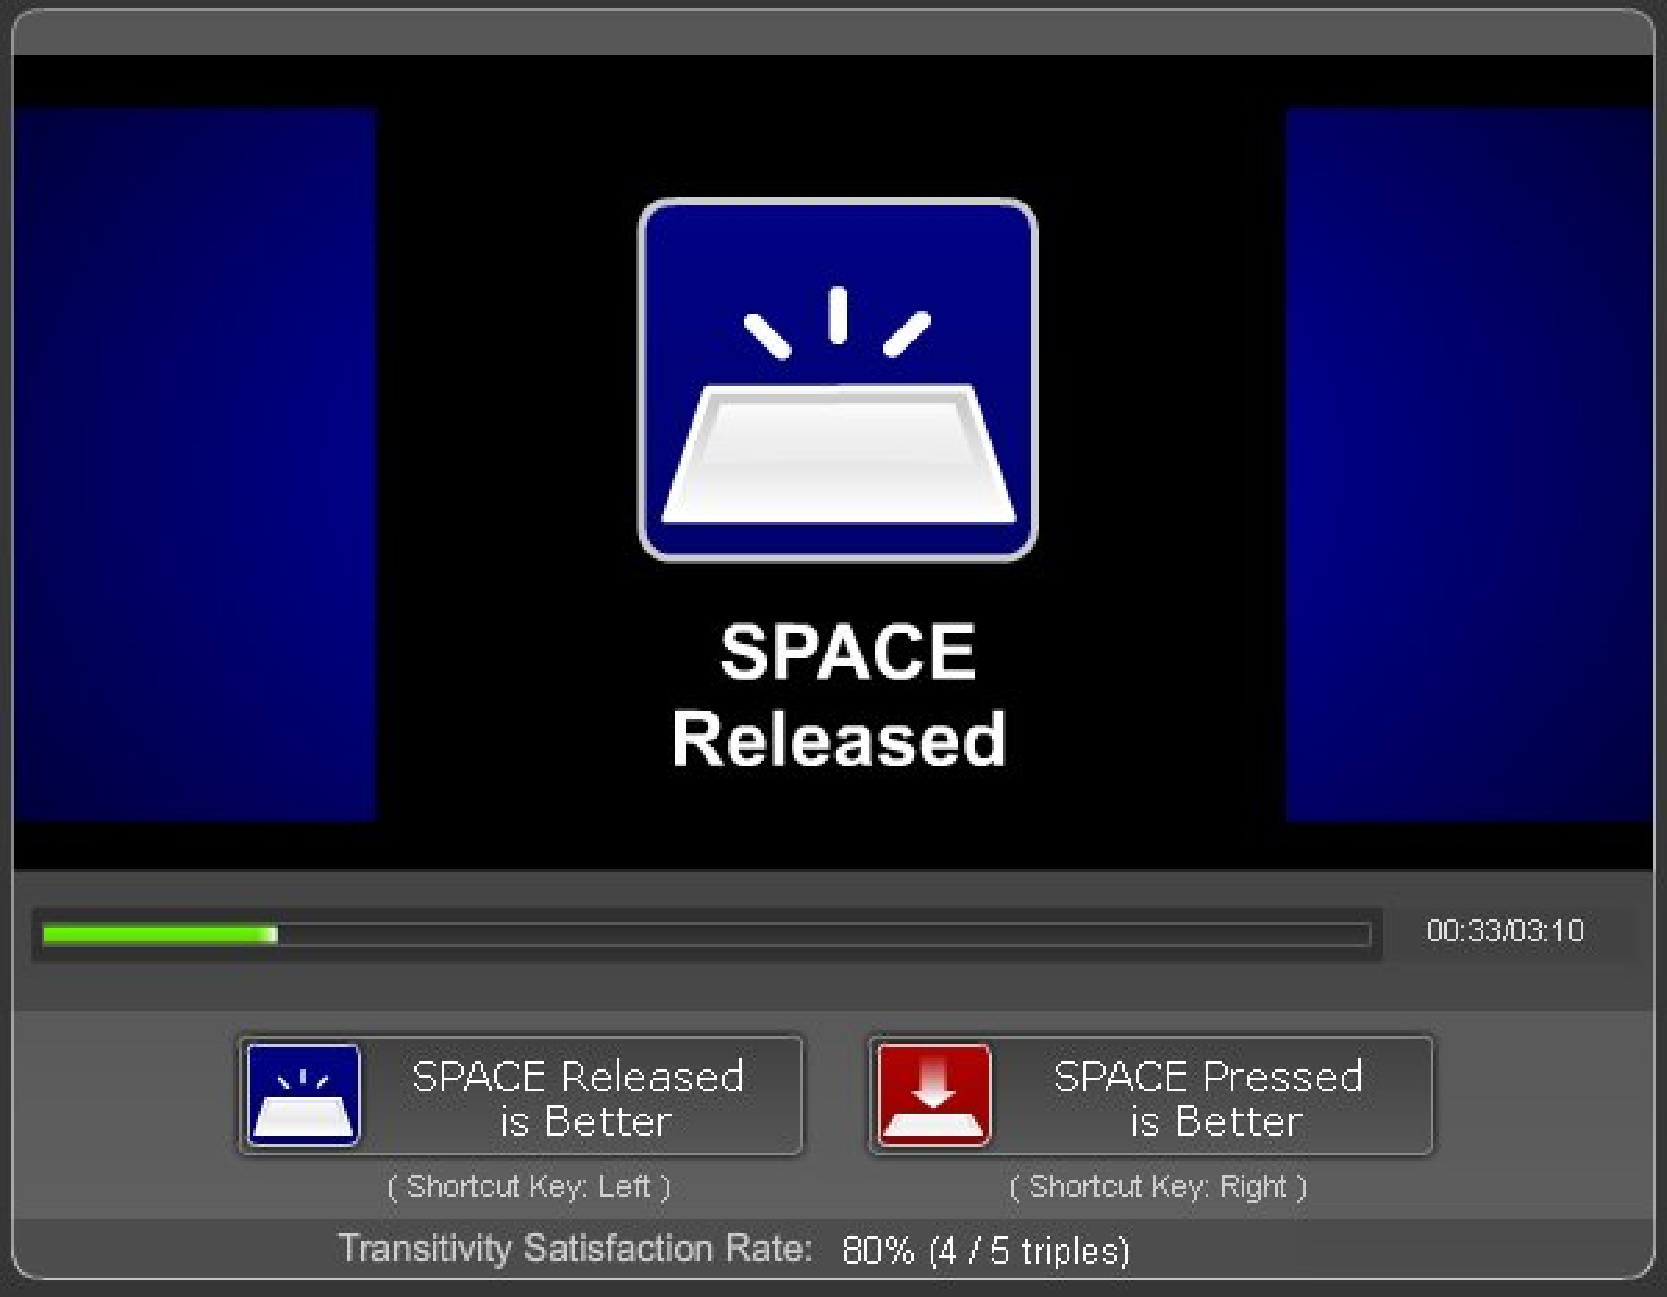 (a) Released state
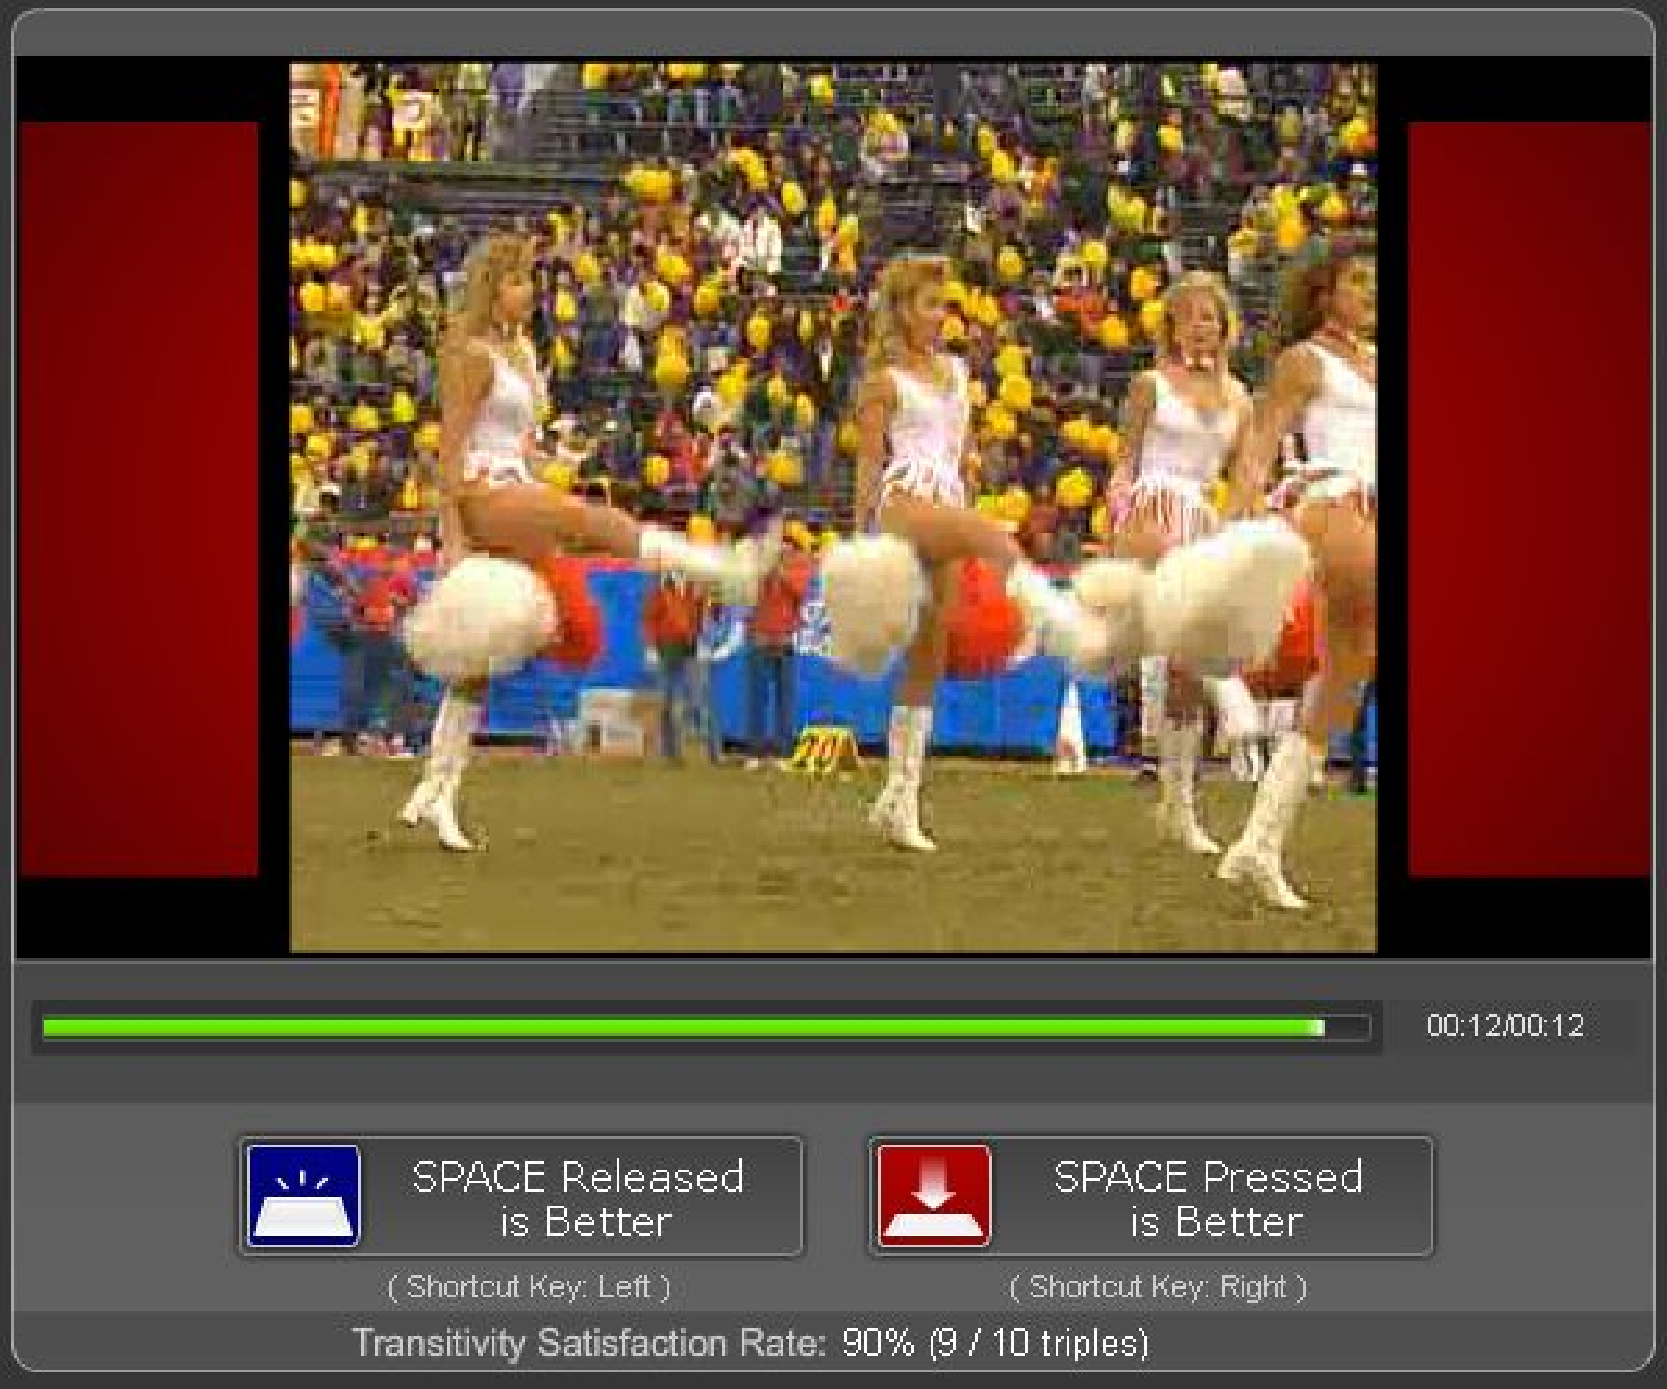
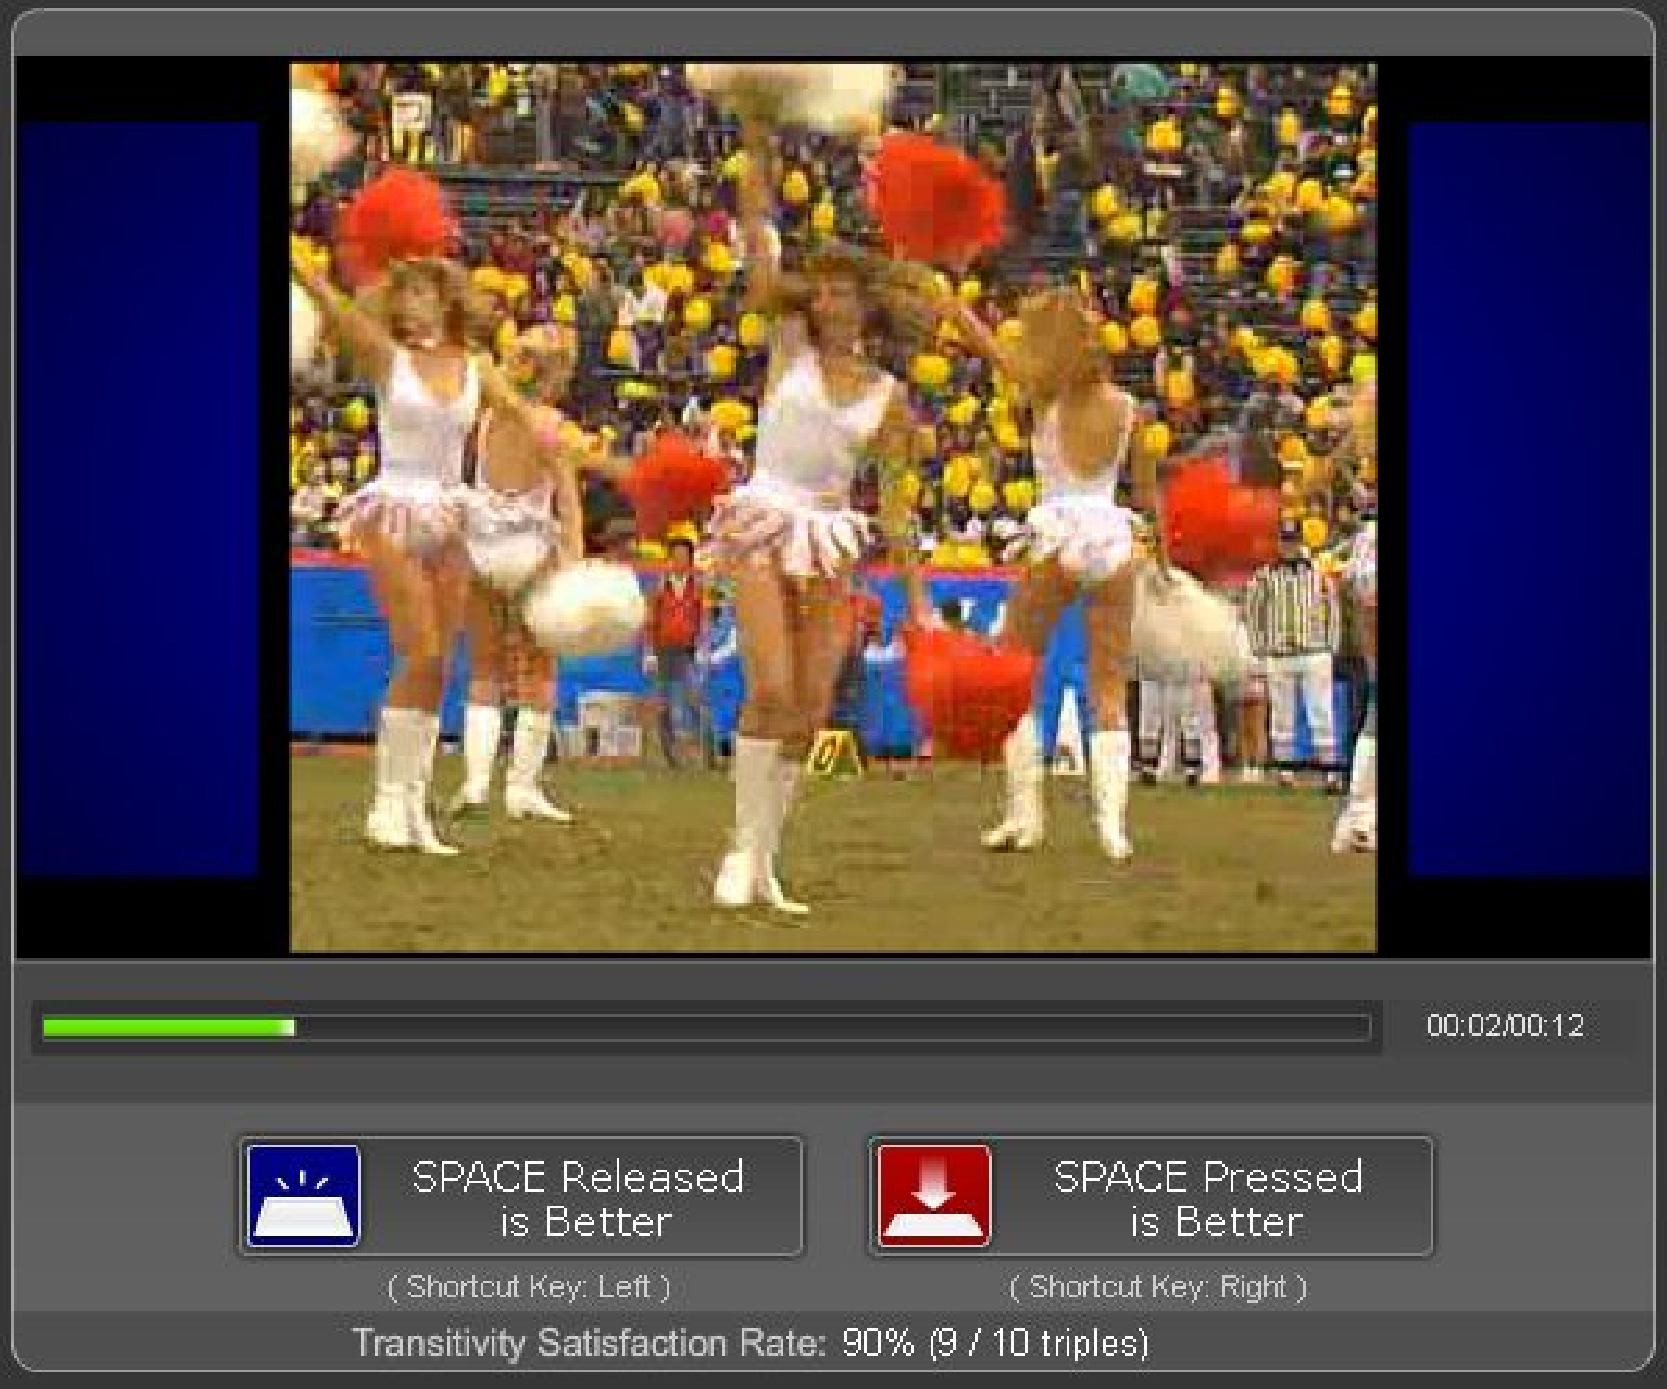
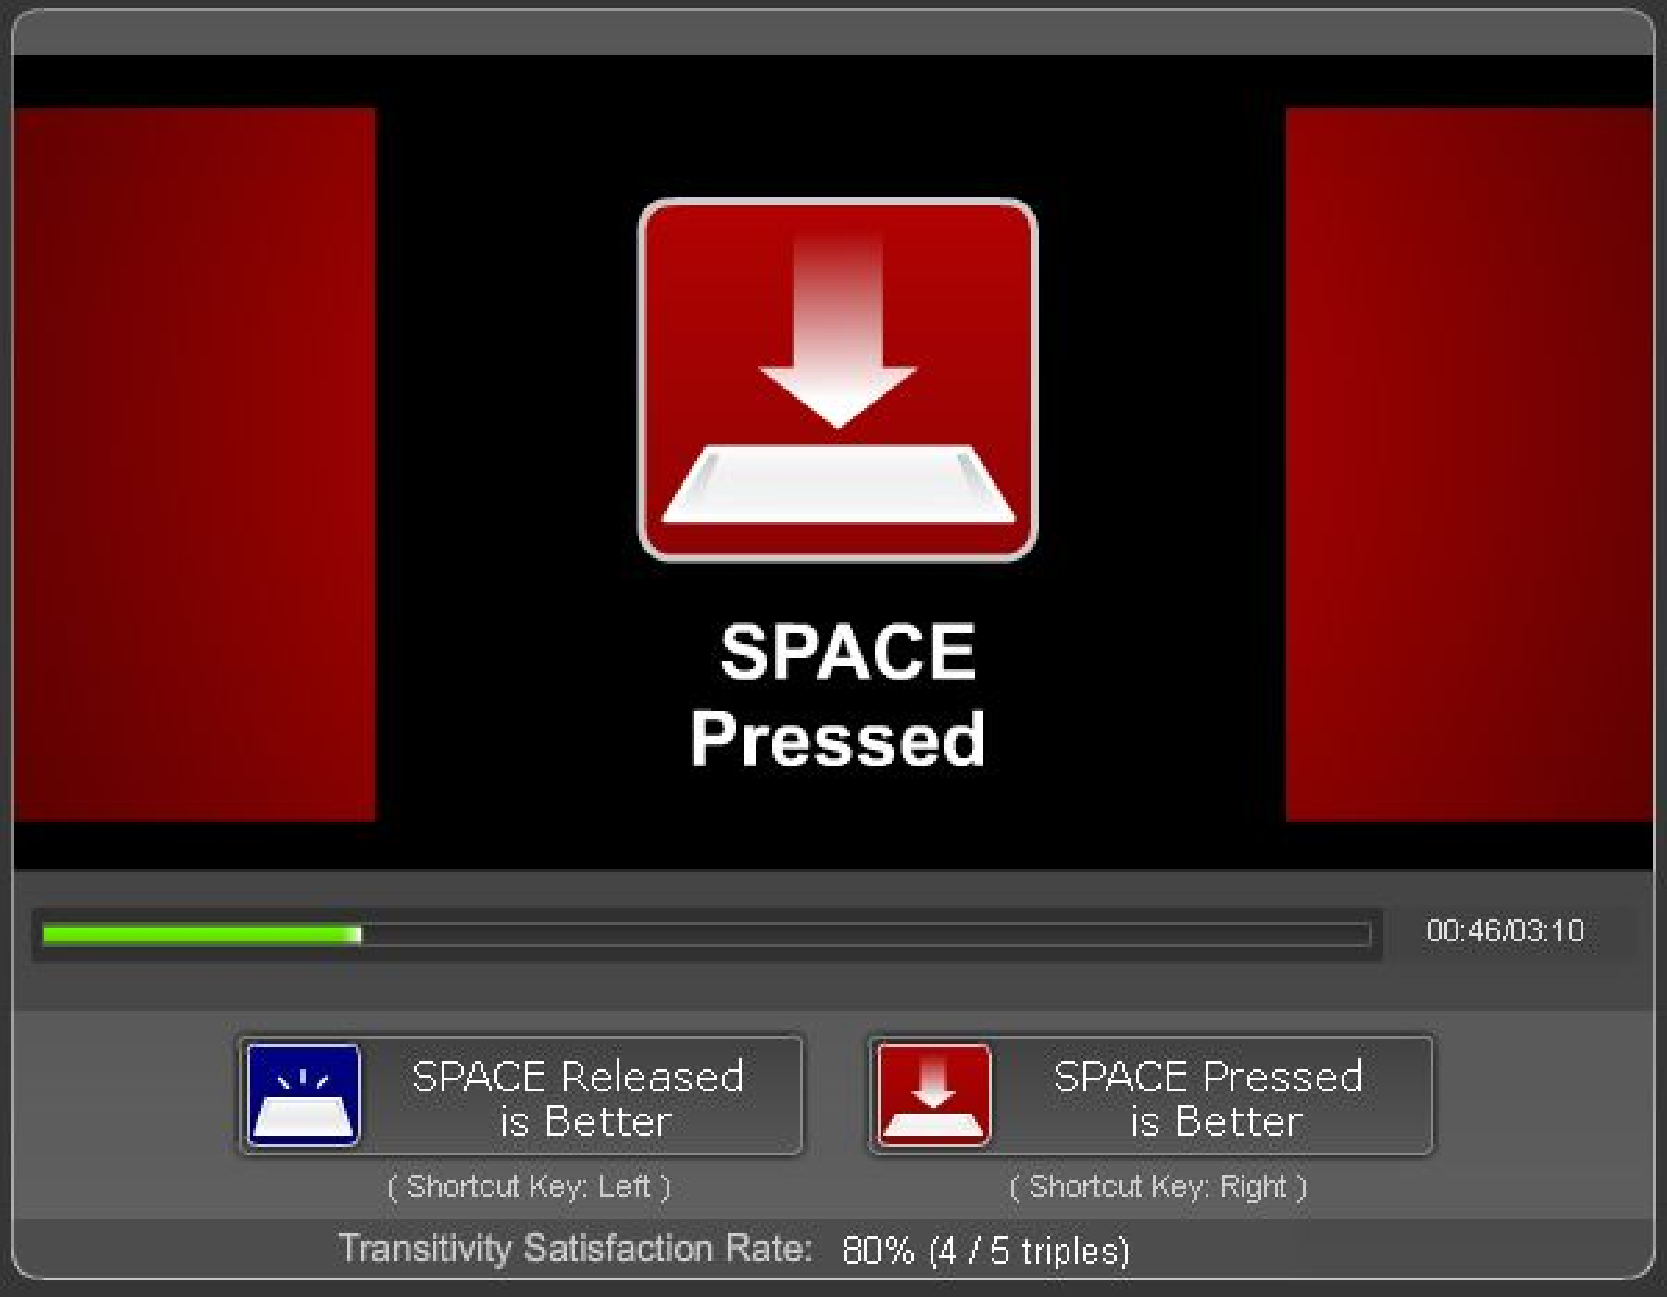 (b) Pressed
state
(b) Pressed
state
 (a) Released state
 (b) Pressed
state
(b) Pressed
state