De-Yu Chen, Hao-Tsung Yang, and Kuan-Ta Chen
Institute of Information Science, Academia Sinica
derek0208@iis.sinica.edu.tw, htyang@iis.sinica.edu.tw, ktchen@iis.sinica.edu.tw
Lag denotes the event when an application fails to respond user inputs in a timely
fashion and is considered one of the most common annoyances that impair online gaming
experience. Despite years of effort devoted by game developers and network designers
trying to overcome lags, gamers still suffer from this annoying phenomenon. It seems to
many gamers that lag is an unavoidable part of online gaming and sometimes they just give
up fighting it.
In this paper, we tackle the lag problem by investigating the root cause of lags for
gamers. We develop a software called Game Experience Monitor (GEM), which monitors the
performance of gamers' computers and the quality of network paths during game play, and
use the collected traces to correlate players' perceived experience to find out the
common cause of lags. Our analysis reveals that, surprisingly, while it is a common
belief that the instability of Internet paths is the major cause of lags, the overloading
of players' computers in fact plays a more decisive role to lag. It is hoped that this
counter-common-belief finding will motivate further research for providing a better
infrastructure for gaming and other real-time interactive applications.
1 Introduction
When a gamer is exploring an archaic dungeon or participating in an intense battle in a
virtual fantasy world provided by an online game, he must be terrified at the occurrence
of "lags," which may largely disrupt the immersive gaming experience. Lag denotes the
event when an application fails to respond user inputs in a timely fashion and is
considered one of the most common annoyances that impair online gaming experience.
Despite years of effort devoted by game developers and network designers trying to
overcome lags, gamers still suffer from this annoying phenomenon. It seems to many gamers
that lag is an unavoidable part of online gaming and sometimes they just give up fighting
it [1].
Lag is a troublesome issue to online games for many reasons. First, there are virtually
unlimited factors that may be responsible for lags. In addition to the network delay
variations [2] in the Internet, overloading of game servers, access
bandwidth competition from neighbors, slow rendering of game scenes due to transient
workloads on users' PCs, among other possibilities, can each cause a certain form of
lags. Therefore, it is very difficult, if not impossible, for players to identify the
root cause of lags when they encounter such annoyances. Players may try any combination
of possible solutions found on the Internet, blame game companies, or learn to live with
lags. In our previous work [1], we conducted a questionnaire survey
regarding three questions: 1) How do players perceive lag? 2) What do players think of
the causes of lag? 3) How do players react to lag? Based on the responses from 229
subjects, we confirmed that players mostly struggle with lag because they are unable to
identify its root cause and that there is a strong demand for an automatic diagnostic
tool that can identify the root cause of lag for gamers.
In this paper, we further tackle the lag problem by investigating the root cause of lags
for gamers. We develop a software called Game Experience Monitor (GEM), which monitors
the performance of gamers' computers and the quality of network paths between gamers'
computers and the game servers during game play, and use the collected traces to
correlate players' perceived experience to find out the common cause of lags during
online game play. By collaborating with Gamania
Inc.1, a top game company in Taiwan, we
collect 5,482 minutes of performance traces from 514 players as well as the players' lag
experience reports. Our analysis reveals that, surprisingly, while it is a common belief
that the instability of Internet paths is the major cause of lags, the overloading of
players' computers (either too much workload in processor, too little available memory,
or GPU is not powerful enough) in fact plays a more decisive role to the occurrences of
lag.
We consider our contributions in this paper 2-fold:
We present a general monitoring platform that resides on players' computers and can
be used to empirically study the relationship between users' gaming experience and system
and network performances.
Based on a set of GEM traces, we find that players' computers, rather than the
commonly blamed Internet unstability, tend to be the major source of lags.
It is hoped that this counter-common-belief finding would motivate further research for
providing a better infrastructure for gaming and other real-time interactive
applications.
The remainder of this paper is organized as follows. Section II
describes related works in the area of evaluating user perceptions of network and system
QoS. In Section III, we recap a previous work of ours which motivates
this study. Section IV introduces our Game Experience monitor. In
Section V, we describes how we collaborate with a game company for the data
collection. A brief summary of the collected data is also provided. Section VI
provided the root cause analysis of lag. Finally, we offer our conclusions of this paper and outline our future work
in Section VII.
2 Related Works
A number of works have focused on game players' perceived quality of online games. In
[3], Quax et al. conducted an experiment where 12 gamers played an
FPS game with each other. A network emulator was used to simulate delay and jitter on the
network connection for a subset of gamers. They concluded that compared to other players,
the network impairment had a negative influence on the affected players' perceived game
quality. They also found that the players could not tolerate delay higher than 60 ms.
Zander et al. conducted a similar experiment in [4]. They concluded that
delay has a larger impact on the players' perceived quality than packet loss. Meanwhile,
they also found that a player's perceived quality is not a sole factor that influence his
decision of whether to leave the server immediately or not.
In [5], Wattimena et al. introduced delay, jitter,
and packet loss simultaneously on different levels and compared their impacts on gamers'
perceived quality. They also came up a regression model that can predict the gamers'
perceived quality by the network conditions. In [6], Claypool et
al. inquired game players about their perceived game playability and picture quality when
the frame rate and frame resolution were controlled. The players' in-game performance
were also measured. The authors concluded that in terms of performance, frame rate has a
larger impact than frame resolution, while in terms of perceived quality, they are
equally important.
This paper differs from previous works from two aspects. First, while the other studies
focused on either network conditions or presentation factors (such as resolution and
frame rate), we evaluate their effects on gamers' perceived quality of online games.
Second, this work is unique in that it is based on an empirical large-scale user traces,
rather than on-site controlled experiments; therefore both the system performance metrics
and users' self-reported perceived quality are more realistic and the research
implications would be more helpful to field applications.
3 Motivating Study
In our previous study [1], we conducted an Internet survey which was motivated to
investigate the following questions:
How do players perceive lag?
What do players think of the causes of lag?
How do players react to lag?
We had received a total of 229 complete responses from game players. Here we briefly
recap the important implications from the survey results. Readers are referred
to [1] for details.
3.1 Perceptions of Lag
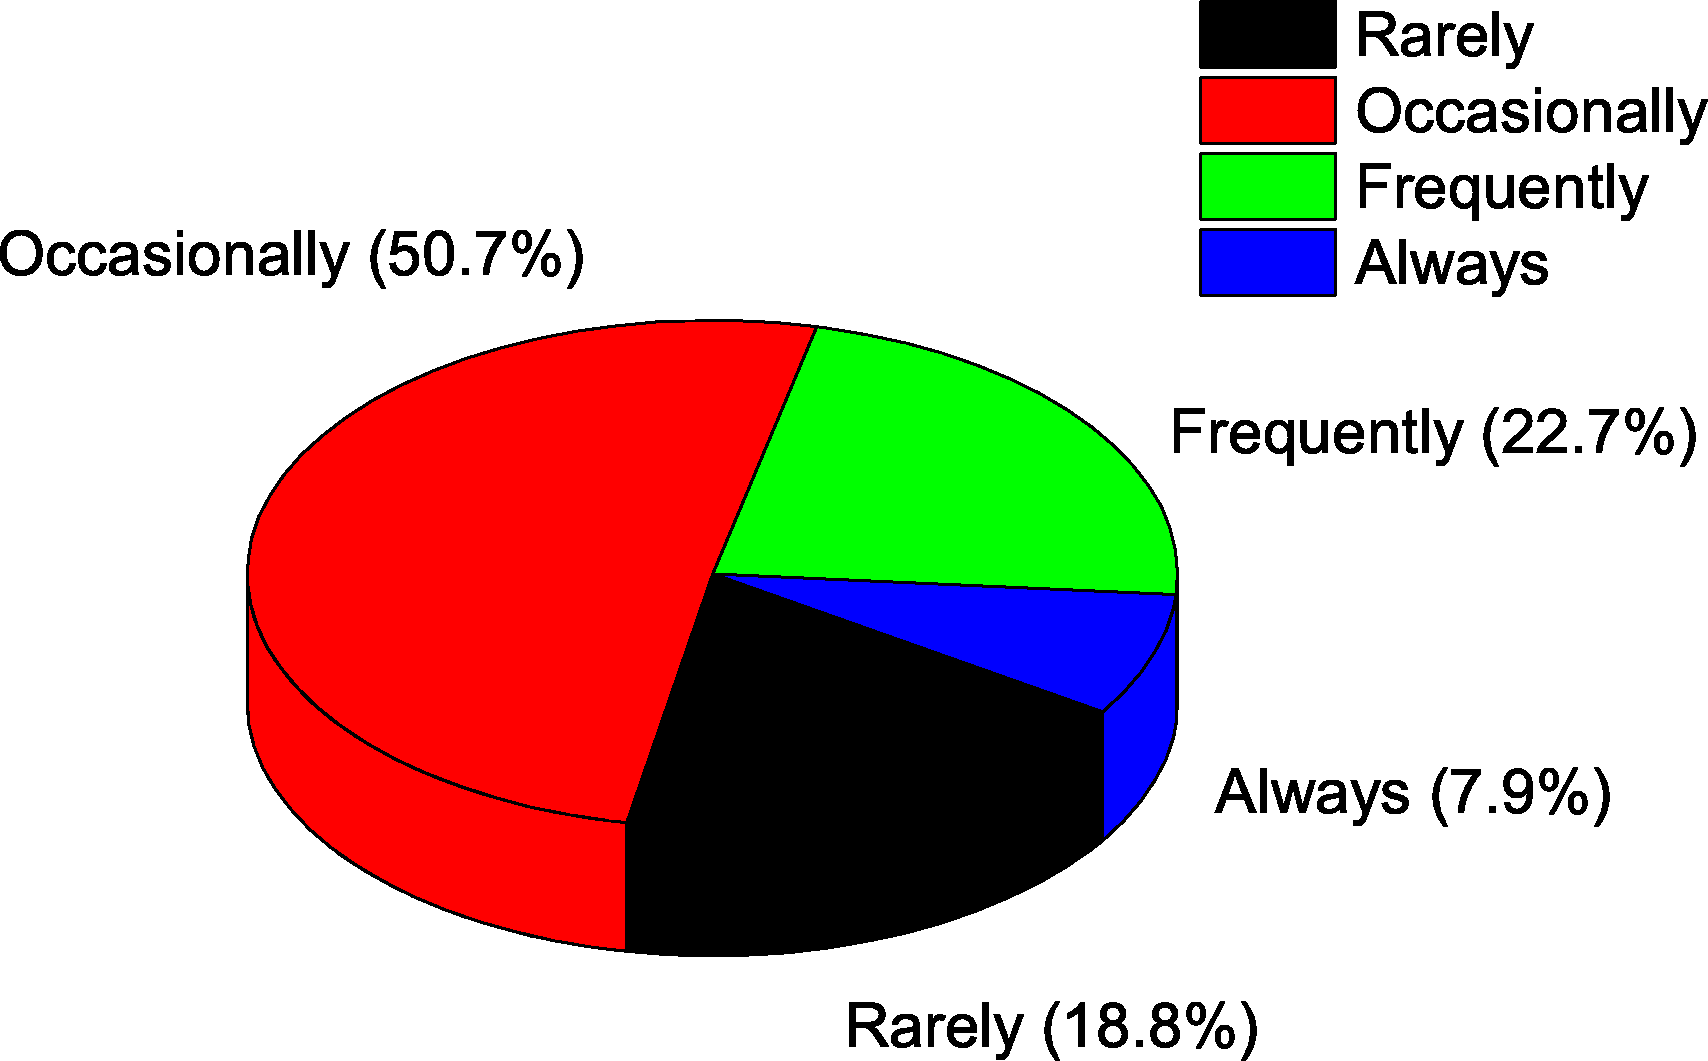
As shown in Figure 1(a), a quarter of players claim that they encounter lag
frequently (22.7%), while half of players encounter lag occasionally (50.7%).
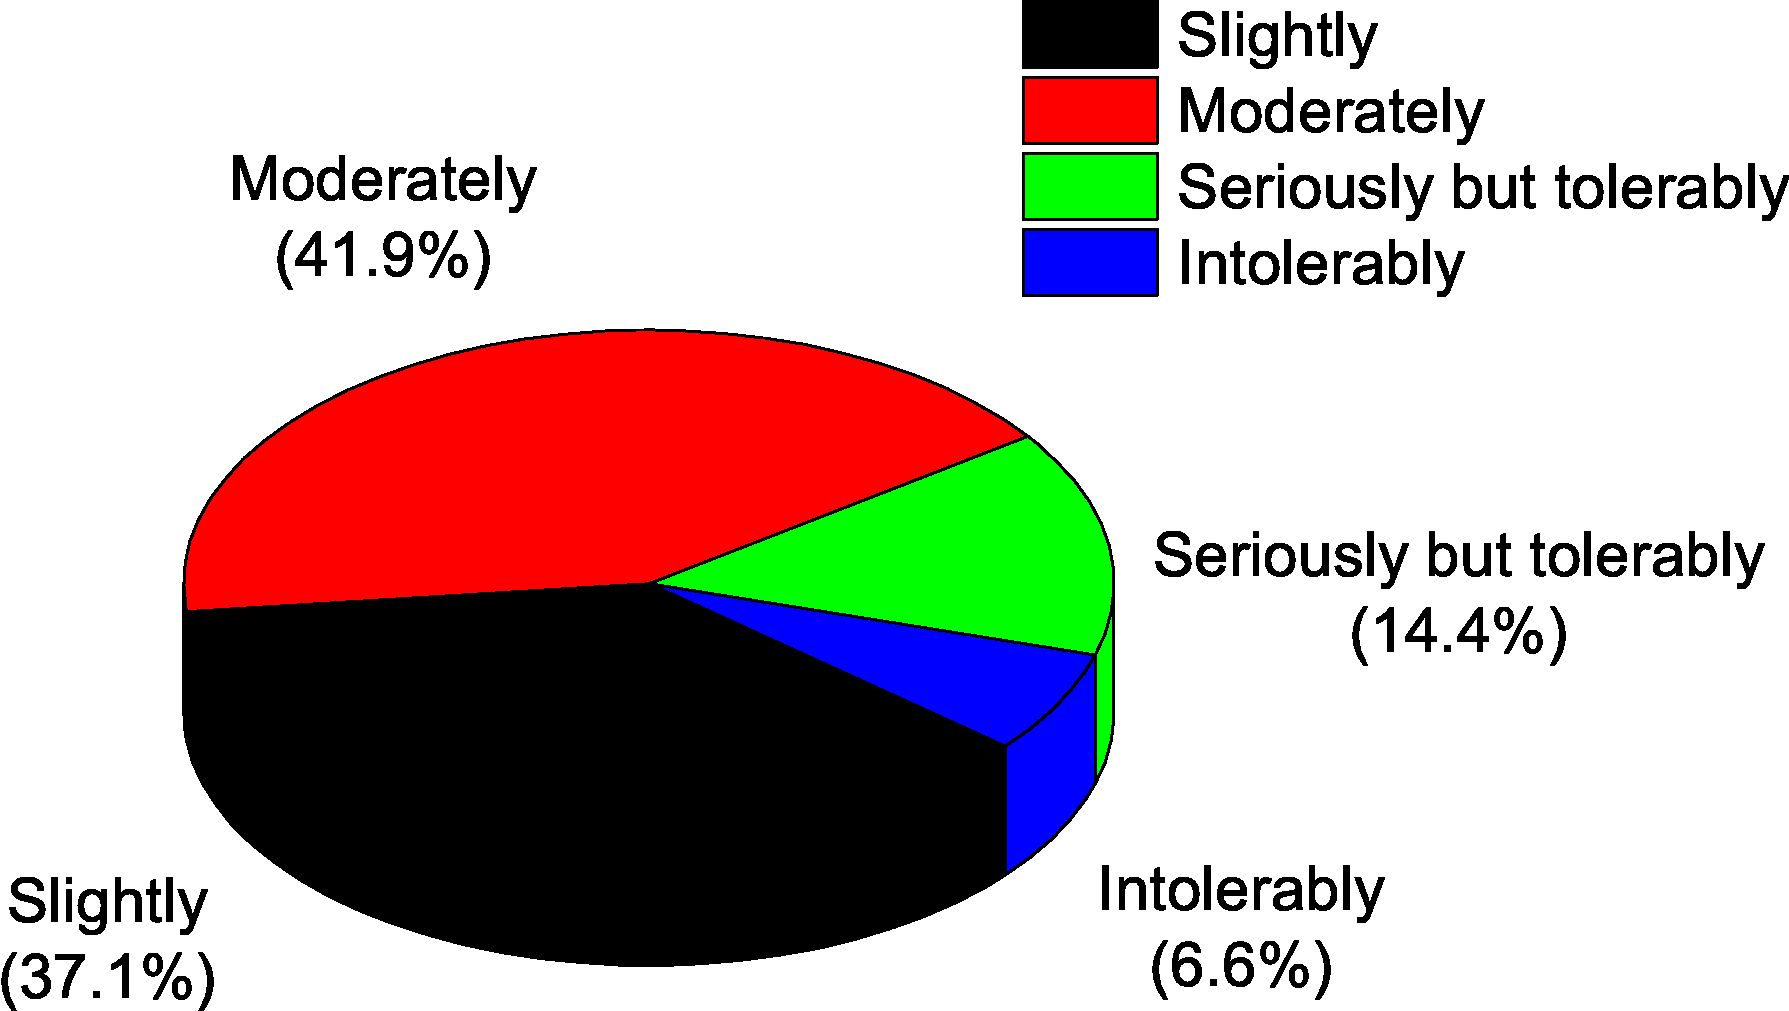
Figure 1(b) shows that only 37% players regard lag as slight, with most
players considering lag as serious (21%) and moderate (41.9%). Furthermore, most lag
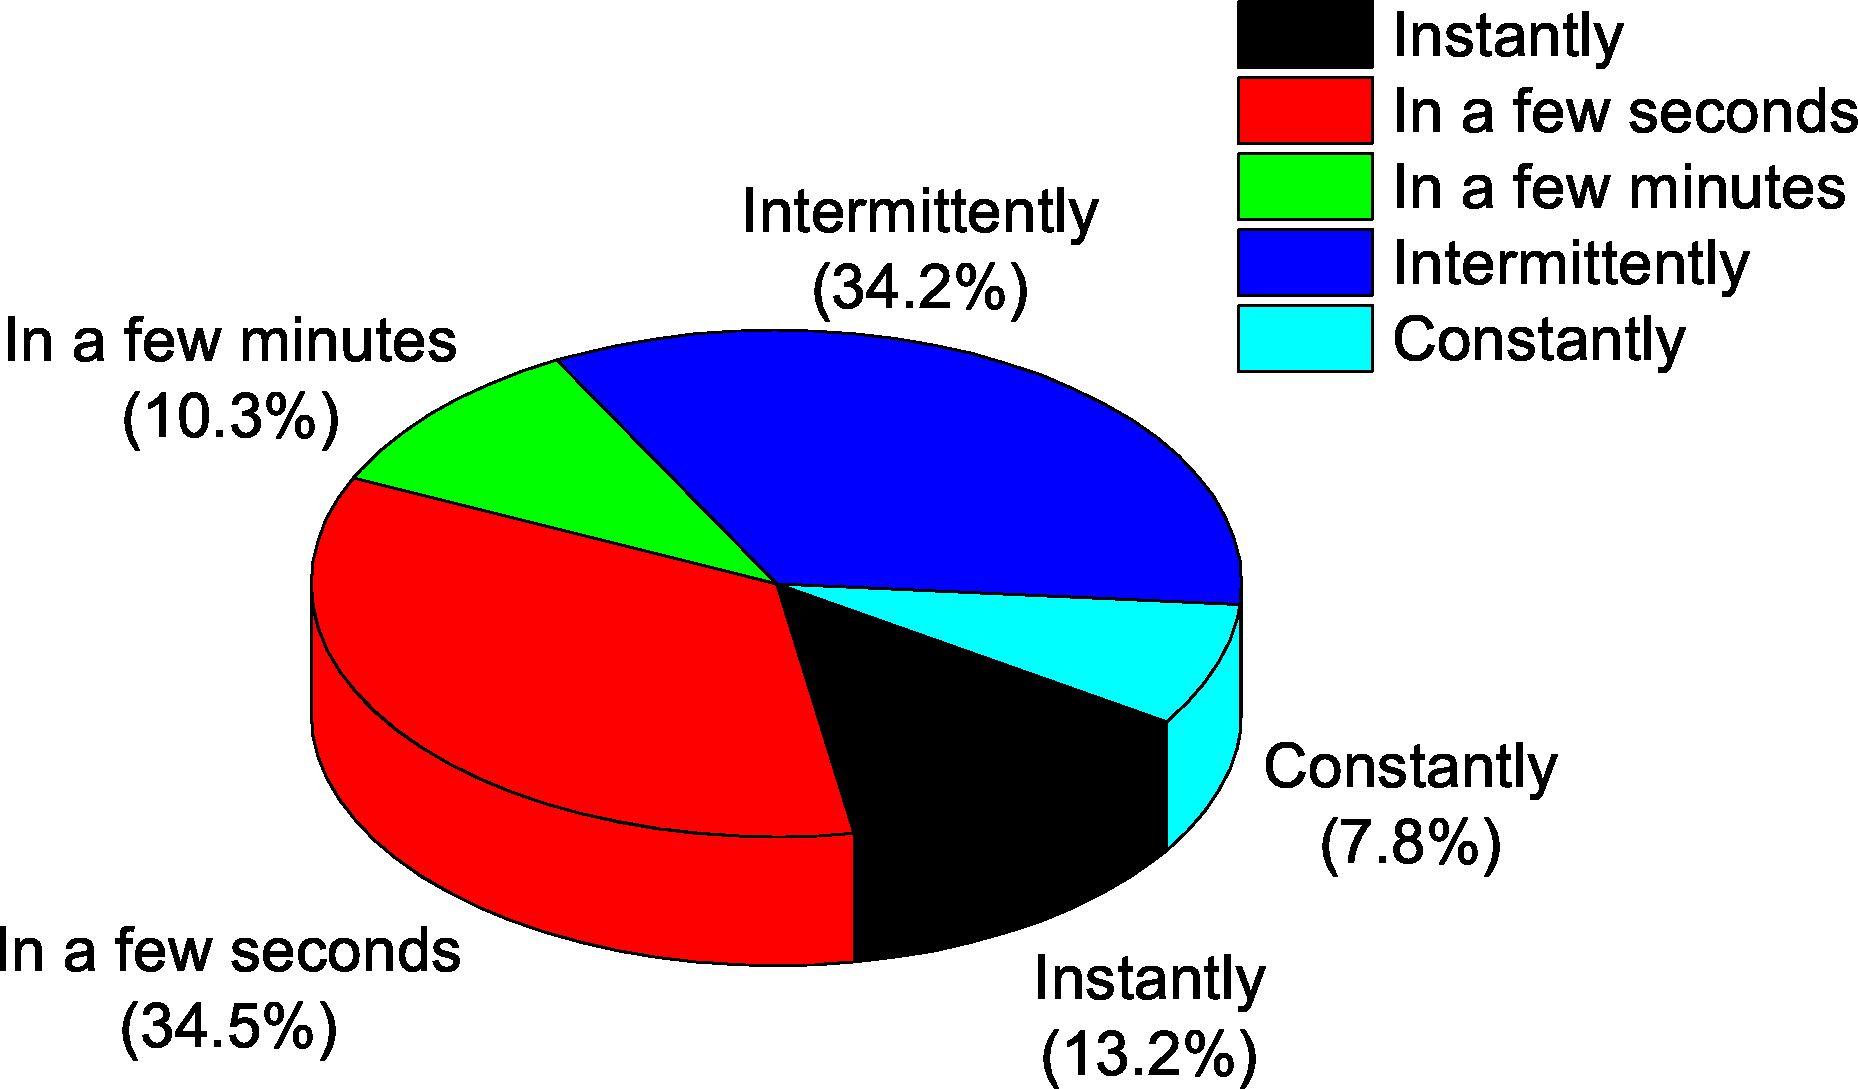
incidents (Figure 1(c)) occur intermittently (34.2%) and lasts for a few
seconds (34.5%).
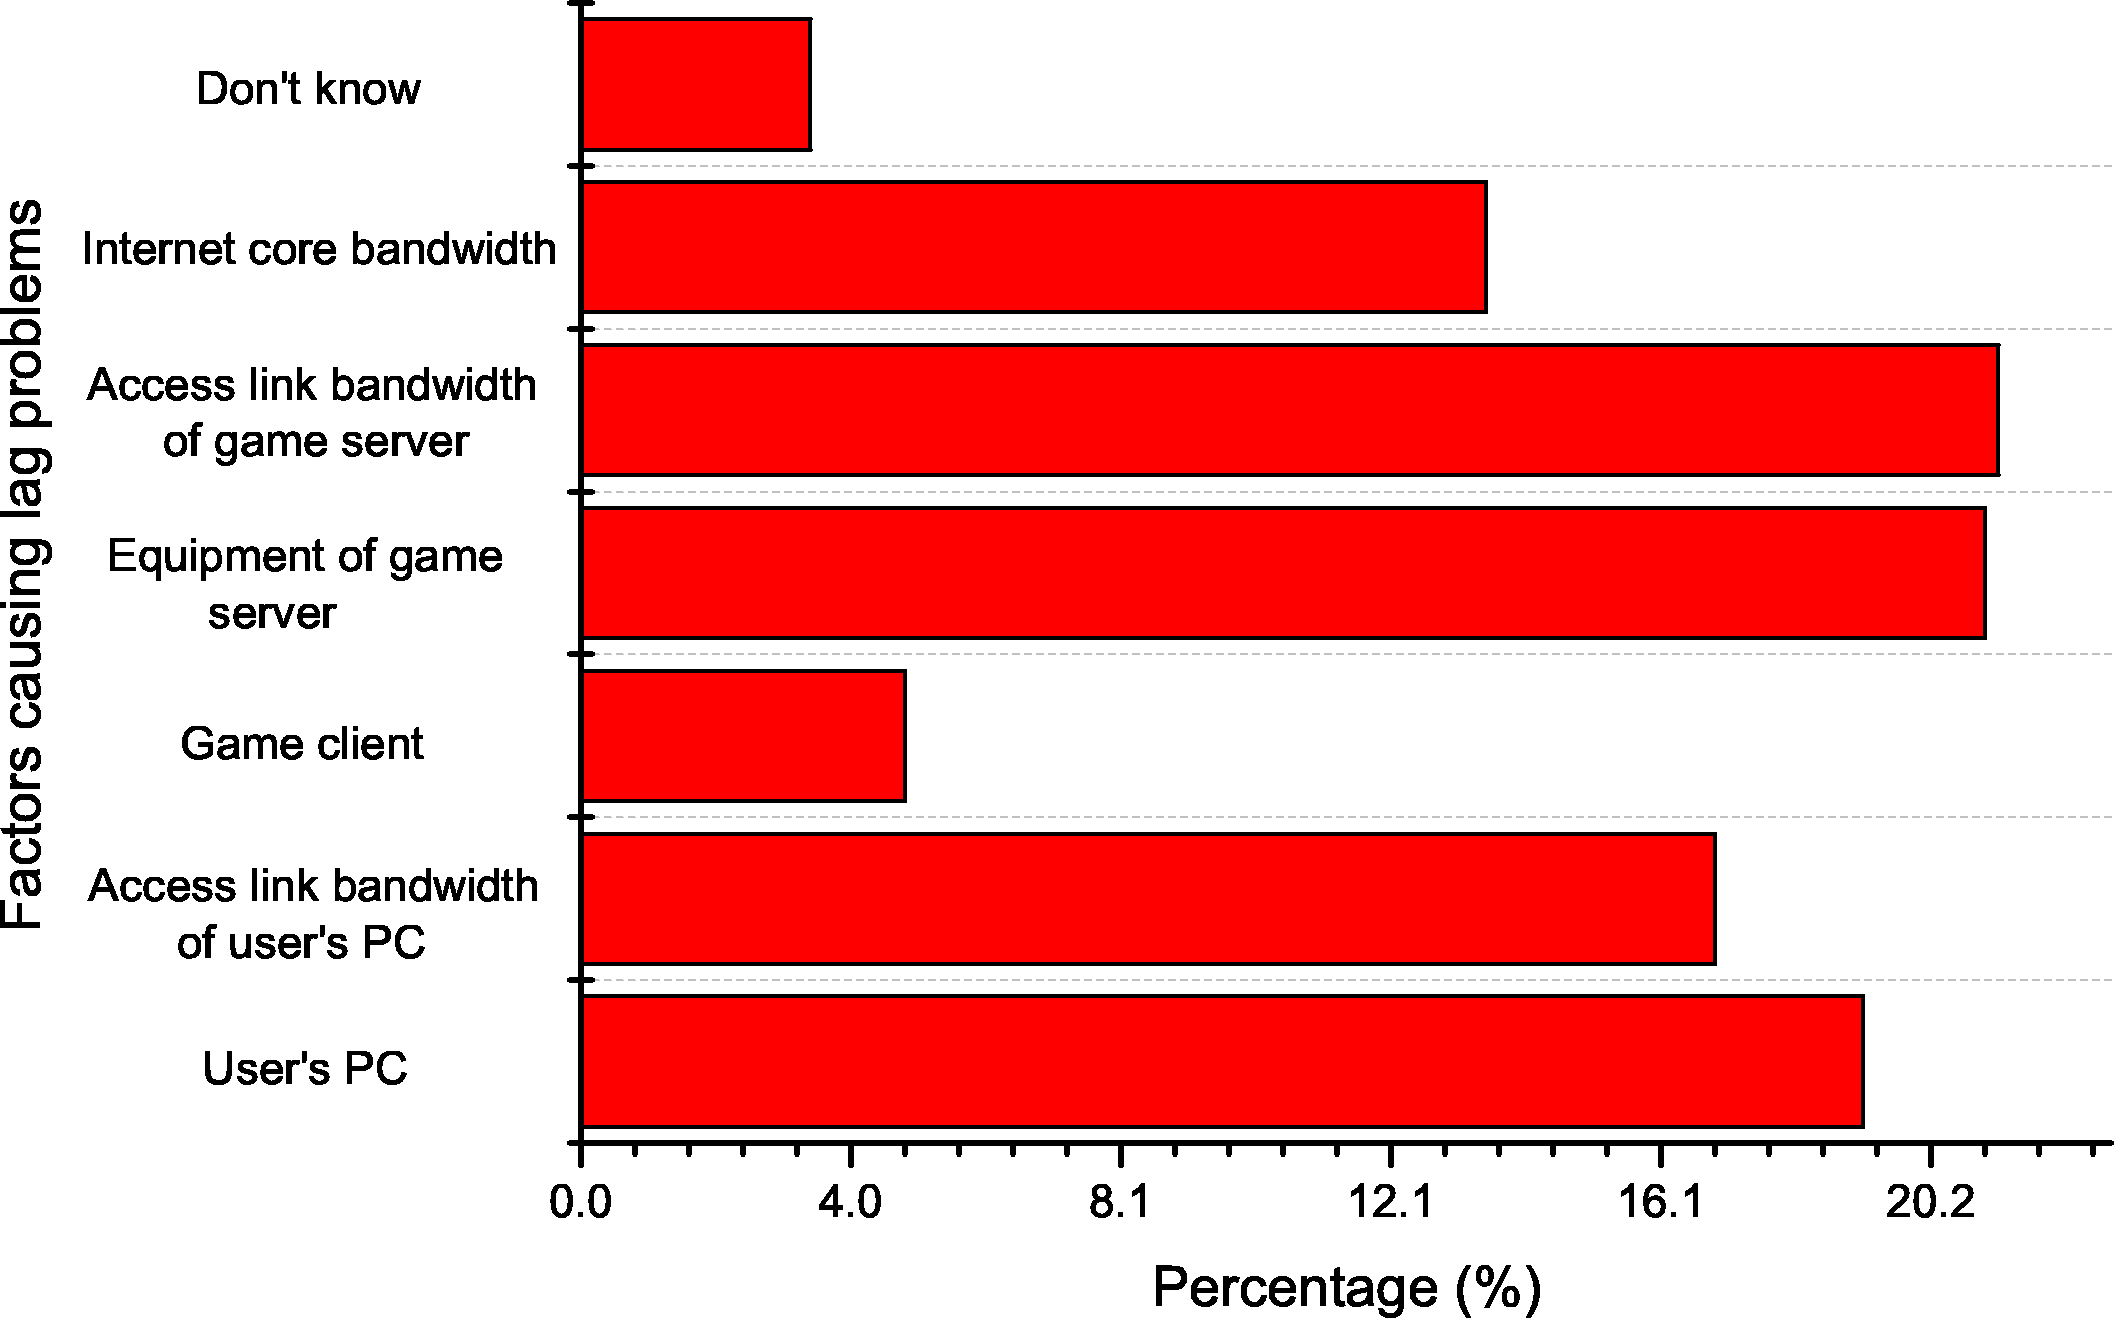
Respondents were also asked to identify the most important factors leading to lag
problems. Figure 1(g) show that most players attribute lag to the access link
bandwidth of game servers (21.2%) and server equipment (21%). Some players also
consider their own PC (19.2%) and the access link bandwidth of their PC (16.9%) as the
cause of lag. Moreover, the results show that most players feel that lag is only
moderately (34.5%) or weakly (32.8%) related to the time of game play, and most
players feel that lag is strongly (34.5%) related to the number of avatars on the
screen.
In sum, we find out that 1) players are highly affected by intermittent lag, 2) players
usually blame the access link bandwidth of game servers and server equipment for lag, and
3) players believe that lag is strongly related to their online game play time and the
number of avatars on the screen.
(a) Frequency of lag
(b) Significance of lag
(c) Duration of lag
(d) Reactions to lag
(e) To what degree does lag affect players' game play?
(f) Where or to whom do players usually complain about their lag problems?
(g) Players' intuition about root causes of lag
(h) Strategies to solve lag
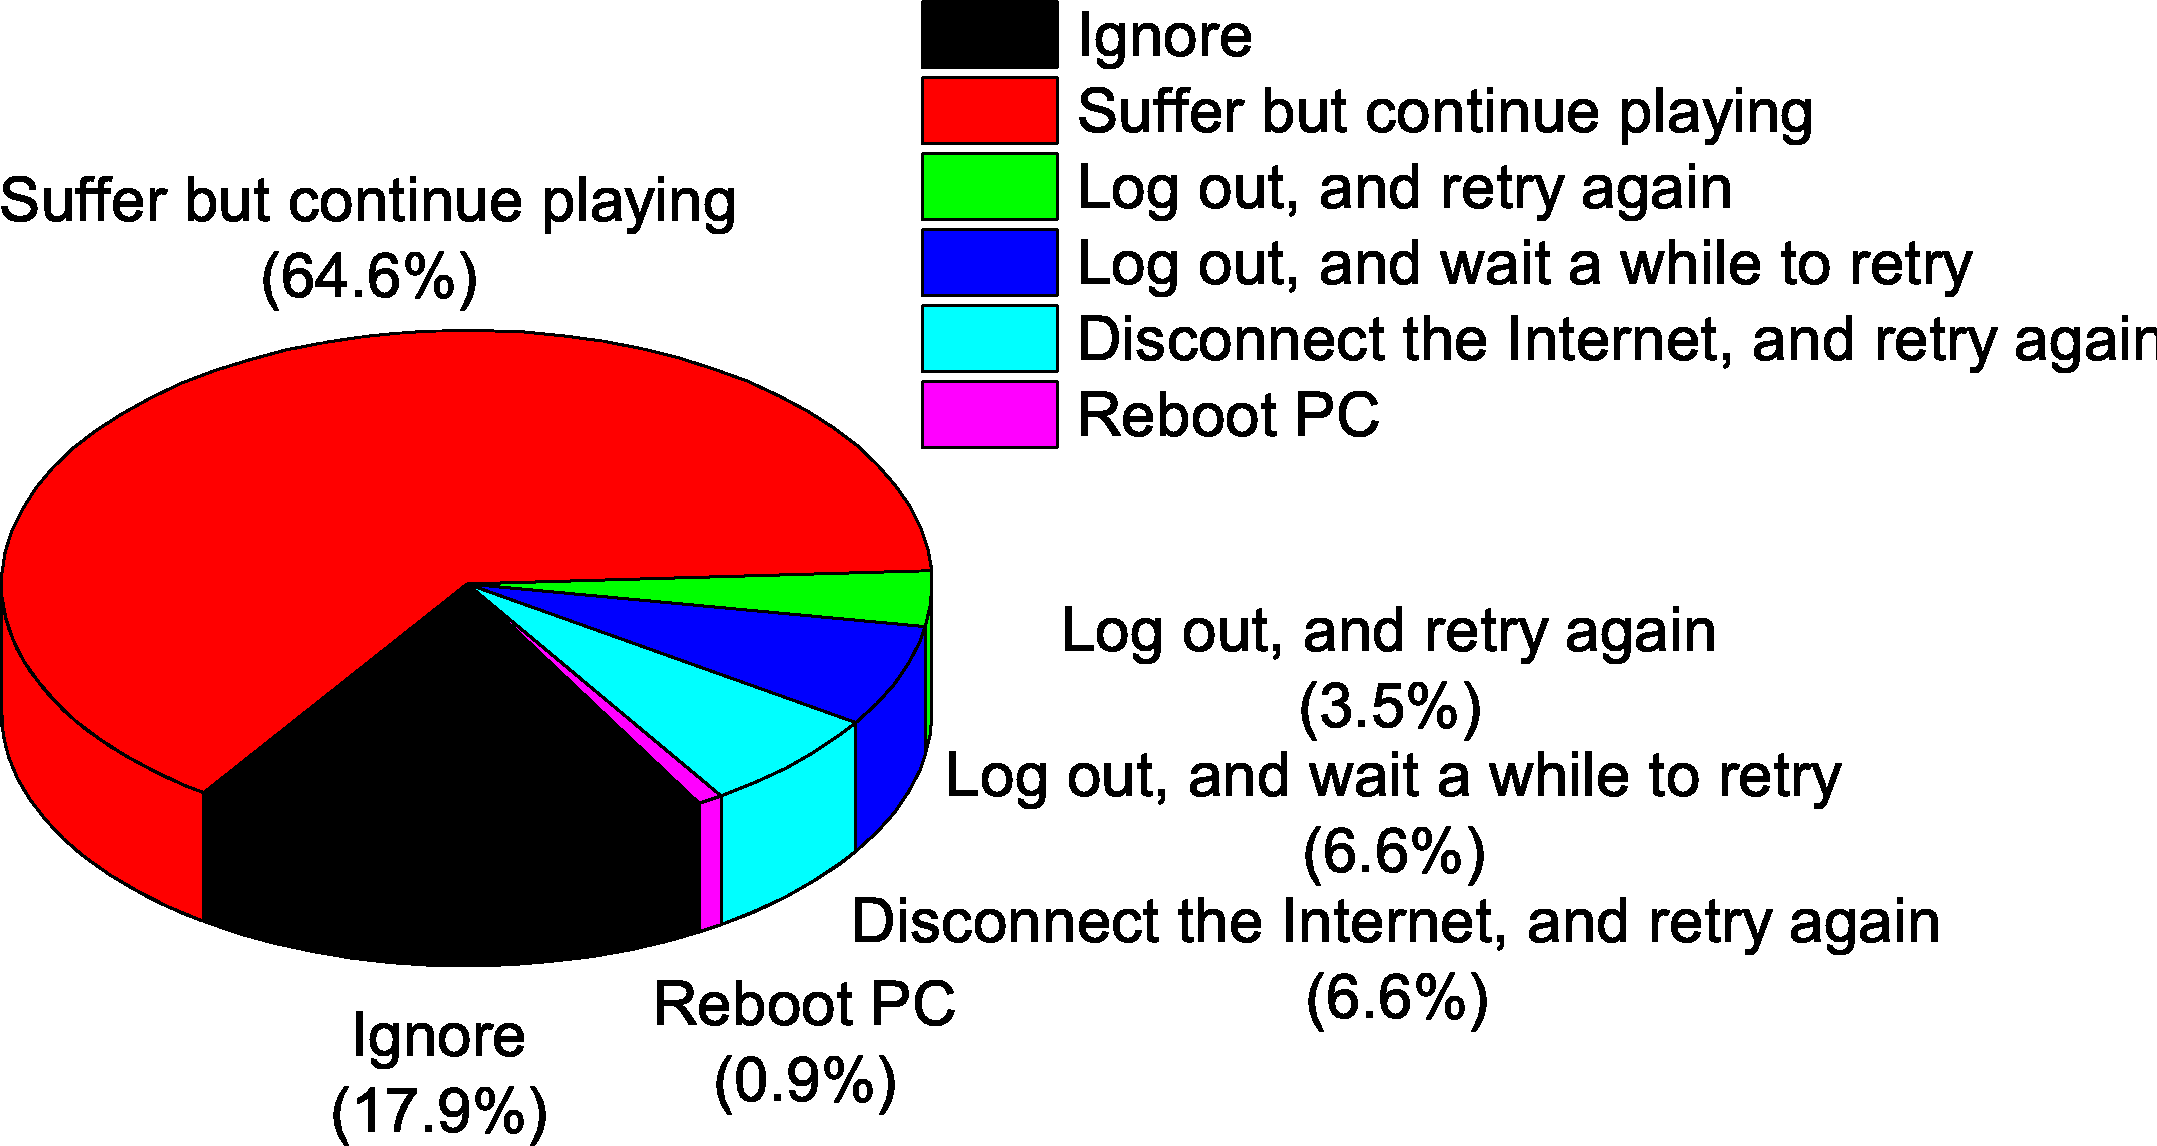
Figure 1: Respondents' perceptions of lag
3.2 Reactions to Lag
As Figure 1(d) shows, when players encounter lag, most of them either suffer
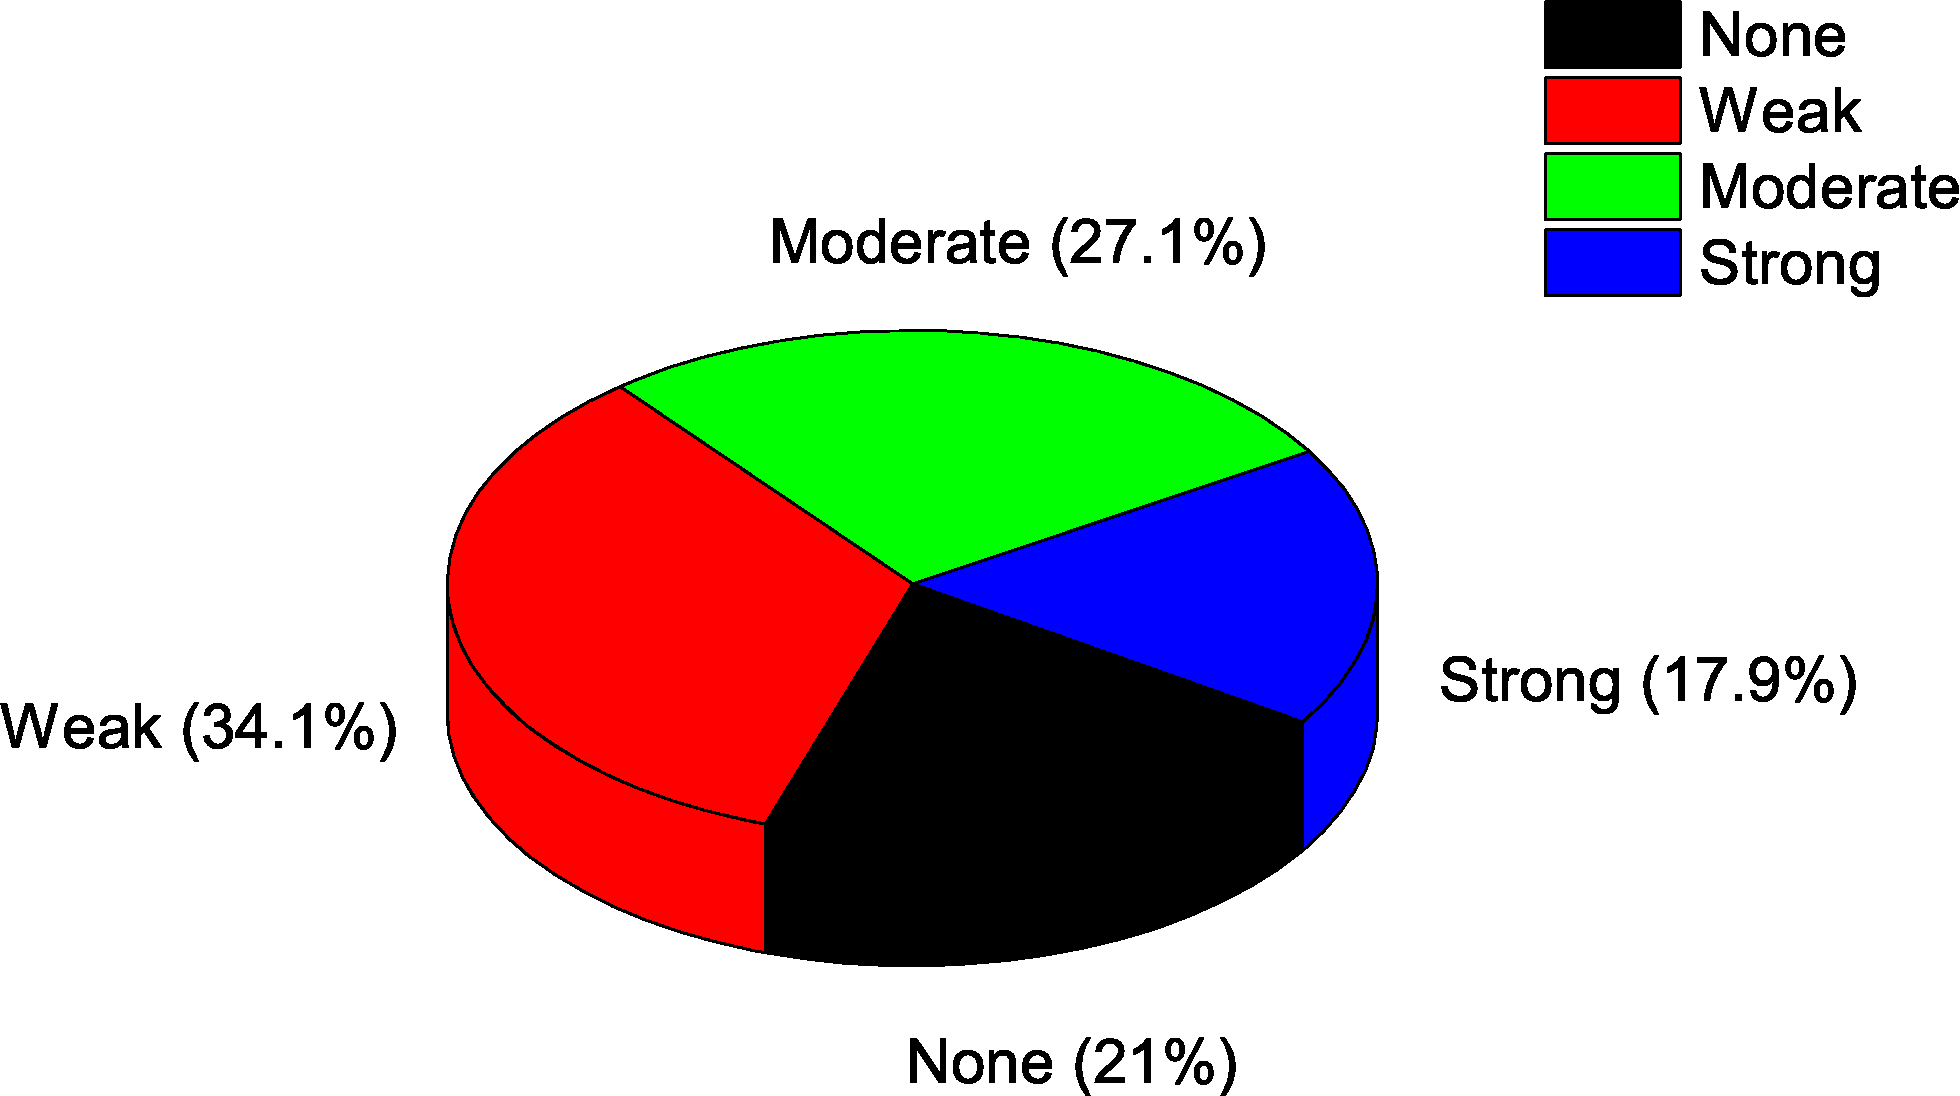
from lag (64.6%) or ignore lag (17.9%). Figure 1(e) illustrates that even
though some players think that lag weakly influences their game play (34.1%), more
players claim that lag has a moderate (27.1%) and strong (17.9%) influence on their
game play. When players are asked about the relationship between lag and a game they
decided to quit, 57.6% of players say that there is a moderate or strong relationship.
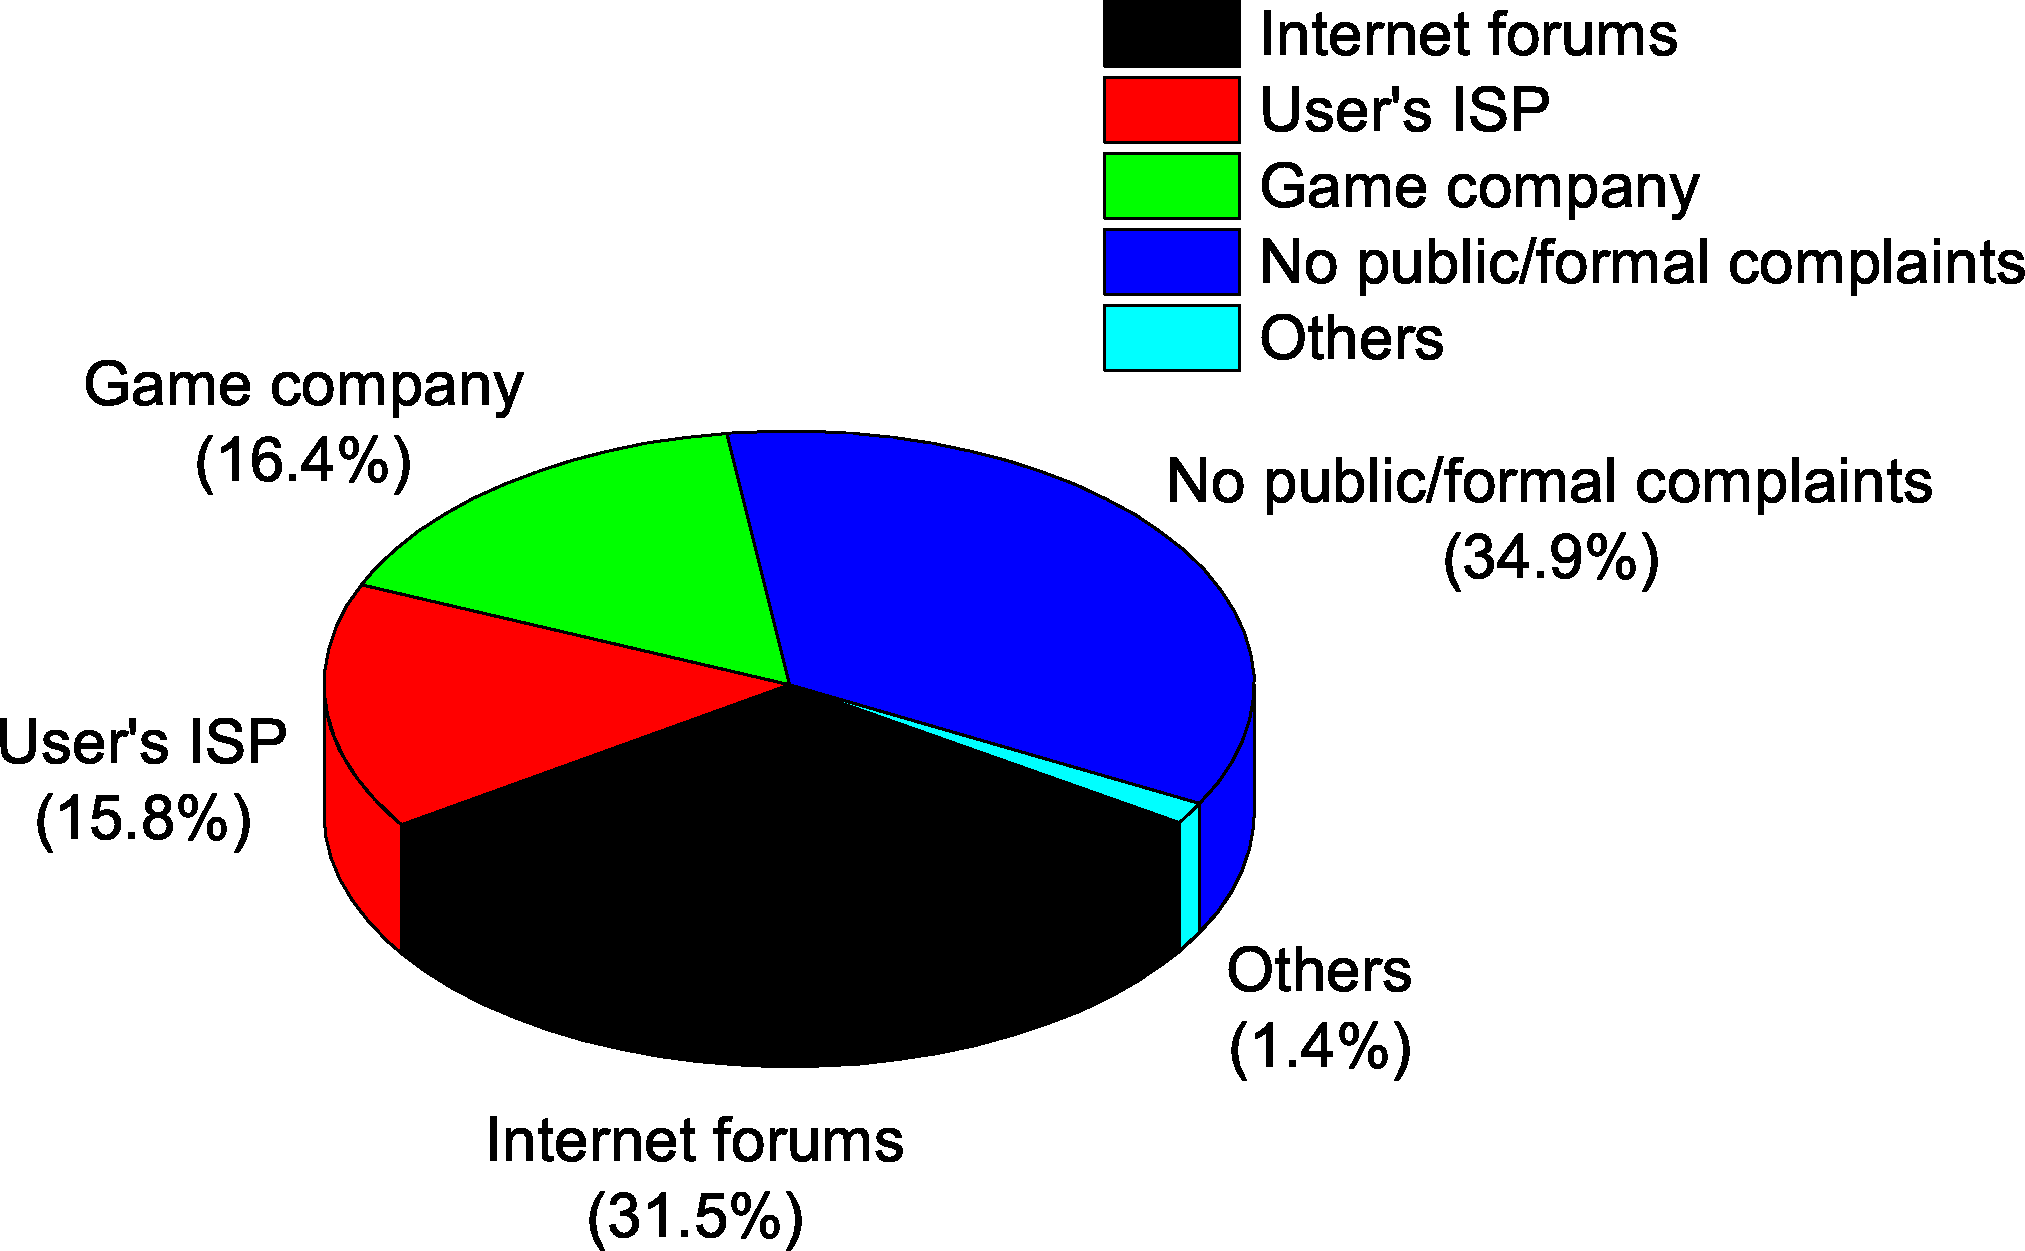
When questions focus on whether players have reported lag to the relevant parties,
Figure 1(f) shows that most players choose to keep silent (34.9%) or complain
about their problems on Internet forums (31.5%). Only a few players contact their ISP
(15.8%) or the game company (16.4%).
From the above results we conclude that 1) players usually tolerate or ignore lag, 2)
players think that lag influences their game play, 3) players blame lag as the reason
they decide to quit online games, and 4) players tend to keep silent or complain on
Internet forums when they encounter lag.
3.3 Solutions to Lag
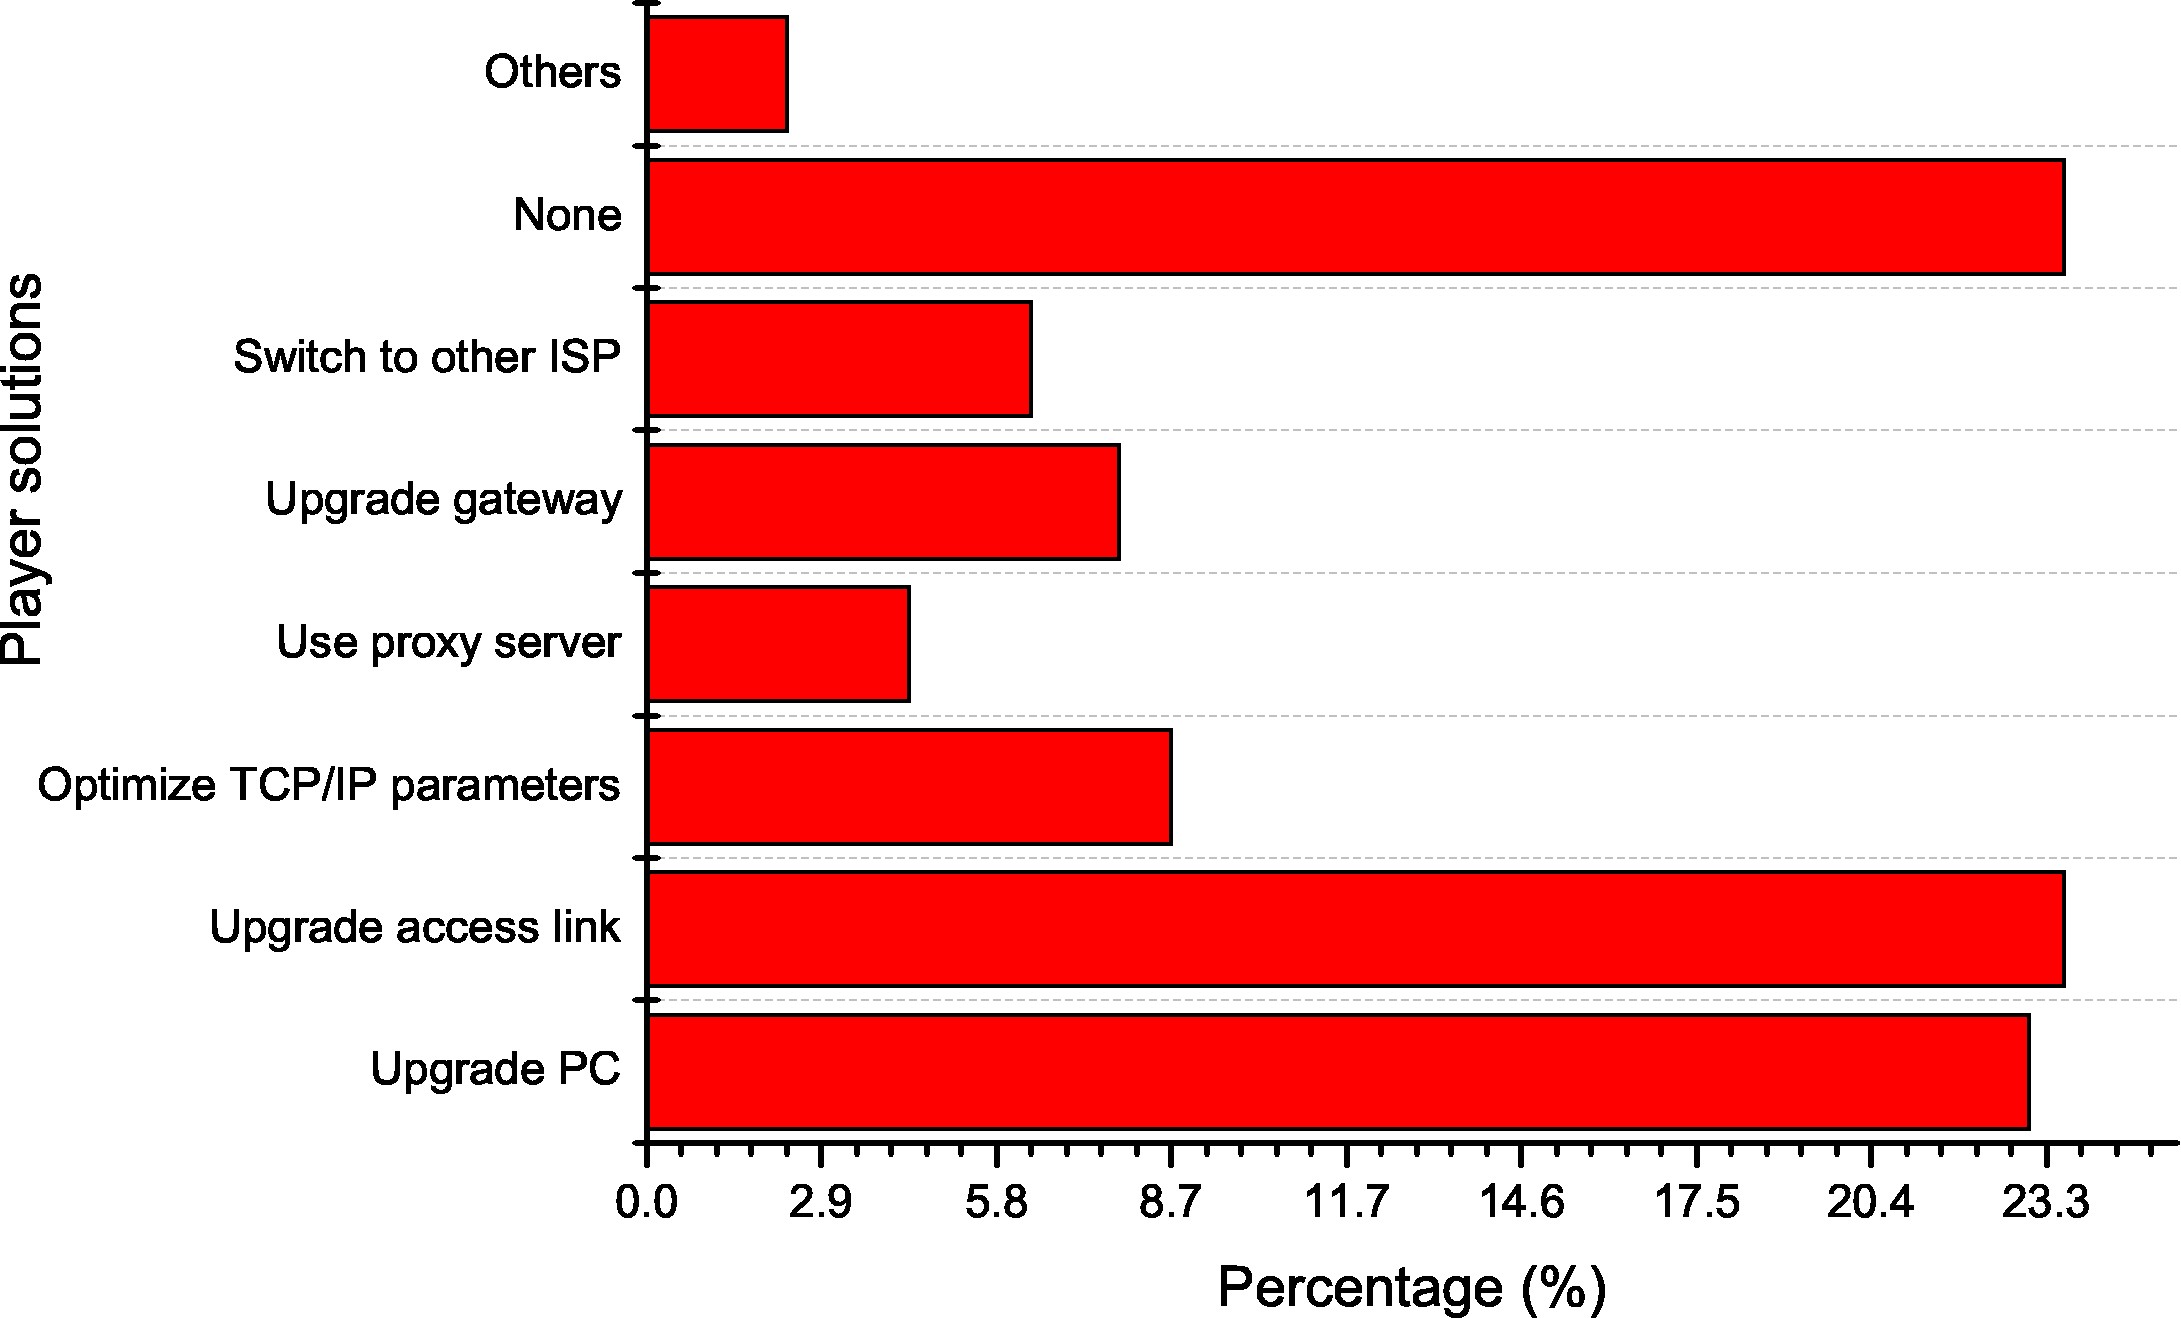
As shown in Figure 1(h), when the respondents are asked which methods they have
adopted to cope with lag, a plurality of respondents (23.6%) never adopt any solution.
Among the rest of them, 23.6% choose to increase their network bandwidth and 23% choose
to upgrade their PC when they encounter lag. Other results shows that only 21.9% of
players use network tools to detect lag.
To understand what kind of tools player demand to fight lag, they are asked whether they
require root cause diagnostic software or lag mitigation software. The results show that
players would like to download and use software that can either diagnose the root cause
of lag (86%) or mitigate lag (93.9%).
Overall, our survey identified two points: 1) Most players have no technical background
in using network tools to identify the root causes of lag, 2) players demand software
tools that can either diagnose the root cause of lag or mitigate lag.
4 Game Experience Monitor
We believe that an ideal way to obtain a better understanding about lag is to directly
look into the players' computers and network and also inquire players' perceived quality
of game whenever lag may occur.
Therefore, we develop a software system which we call the Game Experience Monitor (GEM)
for the data collection purpose. It keeps tracks of the performance and activities of a
gamer's computer and the quality of network path between the gamer's computer and the
game servers during game play. It also provides a user interface for players to report
their perceived gaming experience against lag.
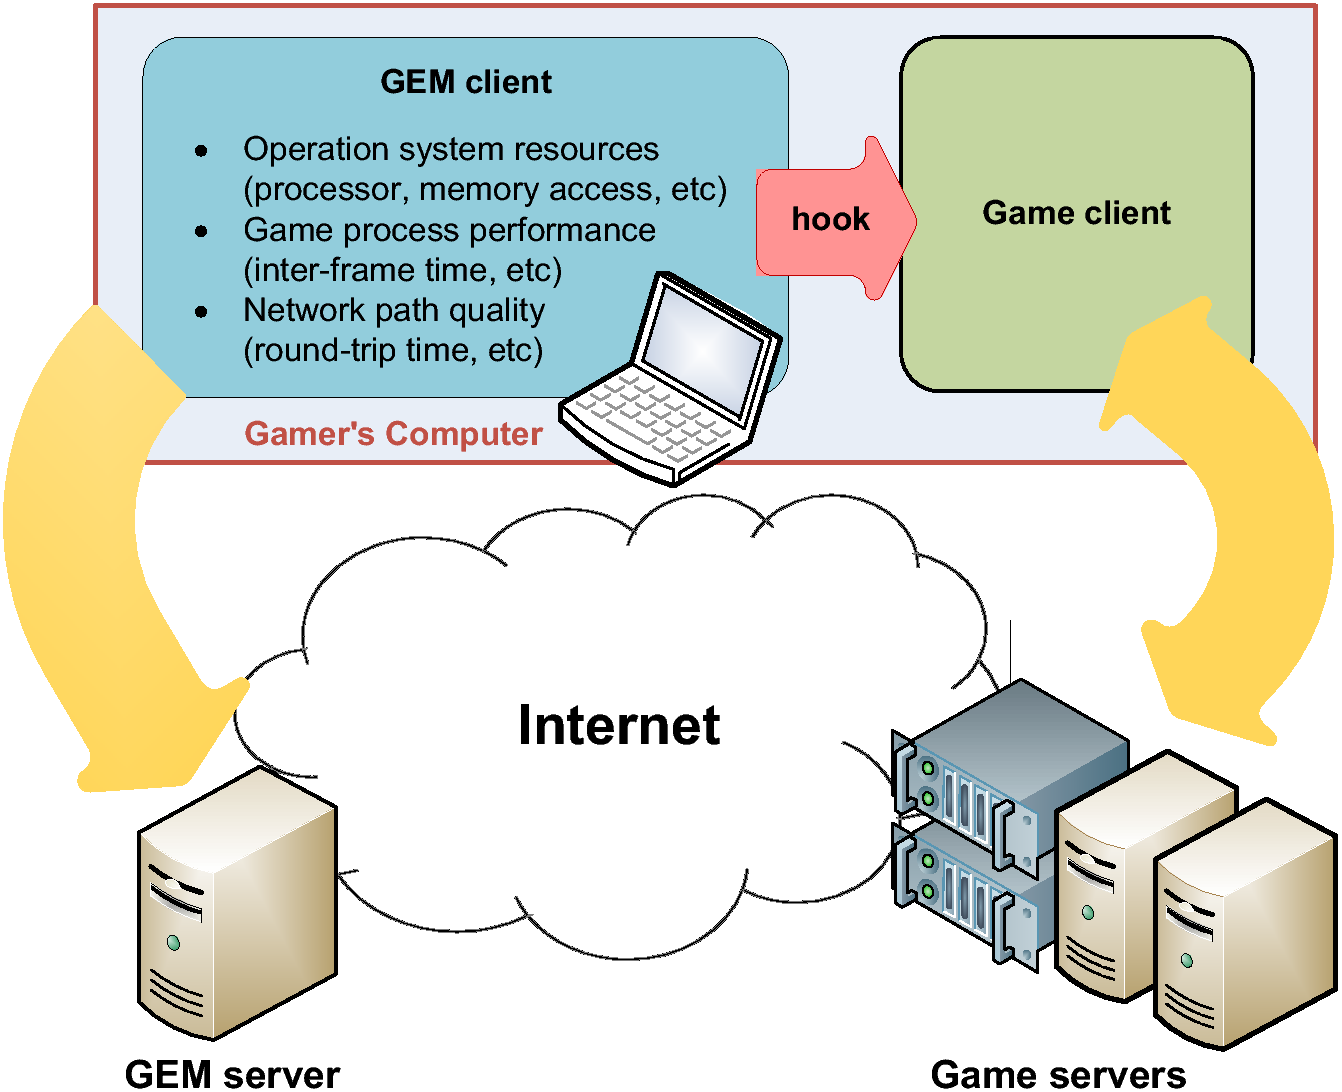
Figure 2: How Game Experience Monitor works.
As Figure 2 illustrates, GEM is designed to be a software which runs on a
player's computer and is invoked only when an online game is launched. GEM monitors the
resources available in the operating system, the performance of the game client process,
and the quality of network path toward the game server. To achieve this goal, GEM hooks
into the game client process using the Windows hook mechanism2 so that it can directly access the kernel
variables that were only internally available inside the game client process. We
summarize the metrics GEM will collect during game play in Table I and
elaborate them below:
Local observations. GEM monitors a wide spectrum of activities and performance
metrics on a gamer's local computer:
Processor utilization: Processor is one of the most important components
to games. Generally, a more powerful processor enables games to run more smoothly;
however, if the processor is busy running other tasks, game performance could drop
significantly. Thus, we record the number of CPU cores on the computer along with the
processor usage over time, such as processor busy time, number of interrupts it handles
per second, etc.
Memory utilization: Memory is another crucial component to gaming
performance, as games often place a large amount of data in memory for fast accesses.
Thus, we keep tracks of memory utilization factors such as the available memory size and
the number of memory accesses during game play.
Game client performance: GEM monitors two performance metrics that we
consider critical to players' gaming experience.
Inter-frame time (ift): Inter-frame time accounts for the time period
between two consecutive frames (game screens). Since games will strive to refresh its
screen in a regular rate (e.g., 50 Hz or higher), a long or unstable inter-frame time
would be a strong indicator that the system is overloaded.
Incoming packet stall time (ipst): The game client needs to communicate with
the game server frequently, and thus how efficiently the client handles network packets
is crucial to gaming performance. When an incoming packet arrives at the gamer's
computer, it will be received by the network interface card driver and then wait in the
queue of the TCP/IP implementation until the game client calls the recv() socket
function to retrieve it. However, in case that the game client process is not active when the
packet arrives, it may not be able to resume its execution immediately if the processor is
busy handling more urgent interrupts or other processes and cause some extra delay before
the packet will be eventually retrieved and handled by the game client. We call such
delay time the incoming packet stall time (ipst). The magnitude of incoming packet stall
time would also be a representative index of whether the player's computer is overloaded for
any reason.
Network observations. Unquestionably the performance of an online game would be
largely affected by the quality of network path between a gamer's computer and the game
servers. Most people regard Internet conditions as the most likely cause of lag
for online gaming; however, we consider that LAN connection quality (especially that of
wireless LANs) might also cause serious performance issues. Thus, GEM monitors the
quality of LAN and WAN (Internet) path separately. For Internet path quality, we simply
infer the round-trip times of packets based on the timestamps and sequence numbers in TCP
packets. For LAN quality, we send out a ping packet with the TTL (time-to-live) set to 1
(hop) every 30 seconds and record the round-trip time.
Table 1: Metrics recorded by the game experience monitor client
Category
Metric
Frequency
Description
n_cores
Once when the program starts
Number of processor cores on the computer
n_processes
1/30 Hz
Number of current processes in the system
processor_time
1 Hz
Percentage of time the processors are busy
privileged_time
1 Hz
Percentage of time the processors spend on privileged instructions
interrupt_time
1 Hz
Percentage of time the processors spend on interrupt handling
dpc_time
1 Hz
Percentage of time the processors spend on servicing dpc requests
rate_interrupts
1 Hz
Number of interrupts the processors receive per second
rate_page_faults
1 Hz
Number of page faults per second
available_bytes
1 Hz
Current available memory in bytes
rate_page_reads
1 Hz
Number of page reads per second
rate_page_writes
1 Hz
Number of page writes per second
rate_pages_input
1 Hz
Number of pages read from disk per second
rate_pages_output
1 Hz
Number of pages written to disk per second
inter_frame_time (ift)
Depends on the frame rate
Inter-frame time (in ms) between each pair of consecutive frames
incoming_packet_
Time period (in ms) between each packet's arrival at the network
stall_time (ipst)
interface and the time the game process receives it
WAN
rtt
Depends on the packet transmission rate
RTT (in ms) of each packet sent to the game server
LAN
lan_rtt
1/30 Hz
RTT (in ms) to the first hop along the route to the game server
5 Data Collection
We collaborated with Gamania Inc., a top game company in Taiwan, to put GEM system into
real use. The game company released a third-person shooting online game called Bubble
Fighter in 2012 and, during the beta test period, all the beta test gamers were invited
to a "computer and network diagnosis program" based on the GEM system. If a gamer
agreed to participate in the program, we instructed him to follow the procedures below:
Download, install, and launch the GEM client.
Run the game client of Bubble Fighter and start to play the game for 10 minutes
as usual. The GEM client will monitor all the system resources and network quality
during the game session.
Once the 10-minute game session is finished, the participant is asked to report his
gaming experience.
The participant's assessment and the GEM traces are uploaded to the GEM server
for offline analysis.
Table 2: A summary of collected GEM traces
Period
2012/12/08-2012/12/10
# participants
514
Uploaded compressed data
400+ MB
Monitored gaming session
5,482 minutes
Recorded network packets
12,615,819 (38.36 pkts/sec)
Intercepted send calls
2,142,193 (6.51/sec)
Intercepted recv calls
2,720,961 (8.27/sec)
Intercepted IDirect3DDevice9::Present calls
15,101,096 (45.91/sec)
Intercepted mouse events
1,963,878 (5.97/sec)
Intercepted keyboard events
1,085,800 (3.30/sec)
In order to encourage participation, gamers who complete the test and successfully upload
data to our data server receive a number of game credits from the game company. During
the beta test from 2012/12/08 to 2012/12/10, 514 gamers have completed the test and
uploaded over 400 MB of compressed data to our server. A total of 5,482 minutes of gaming
session has been monitored, during which 12,615,819 network packets (average 38.36
packets per second) have been recorded. We have intercepted 2,142,193 send calls
(6.51/second), 2,720,961 recv calls (8.27/second), 15,101,096
IDirect3DDevice9::Present calls (45.91/second), 1,963,878 mouse events
(5.97/second), and 1,085,800 keyboard events (3.30/second). Table II
summarizes the data we have collected.
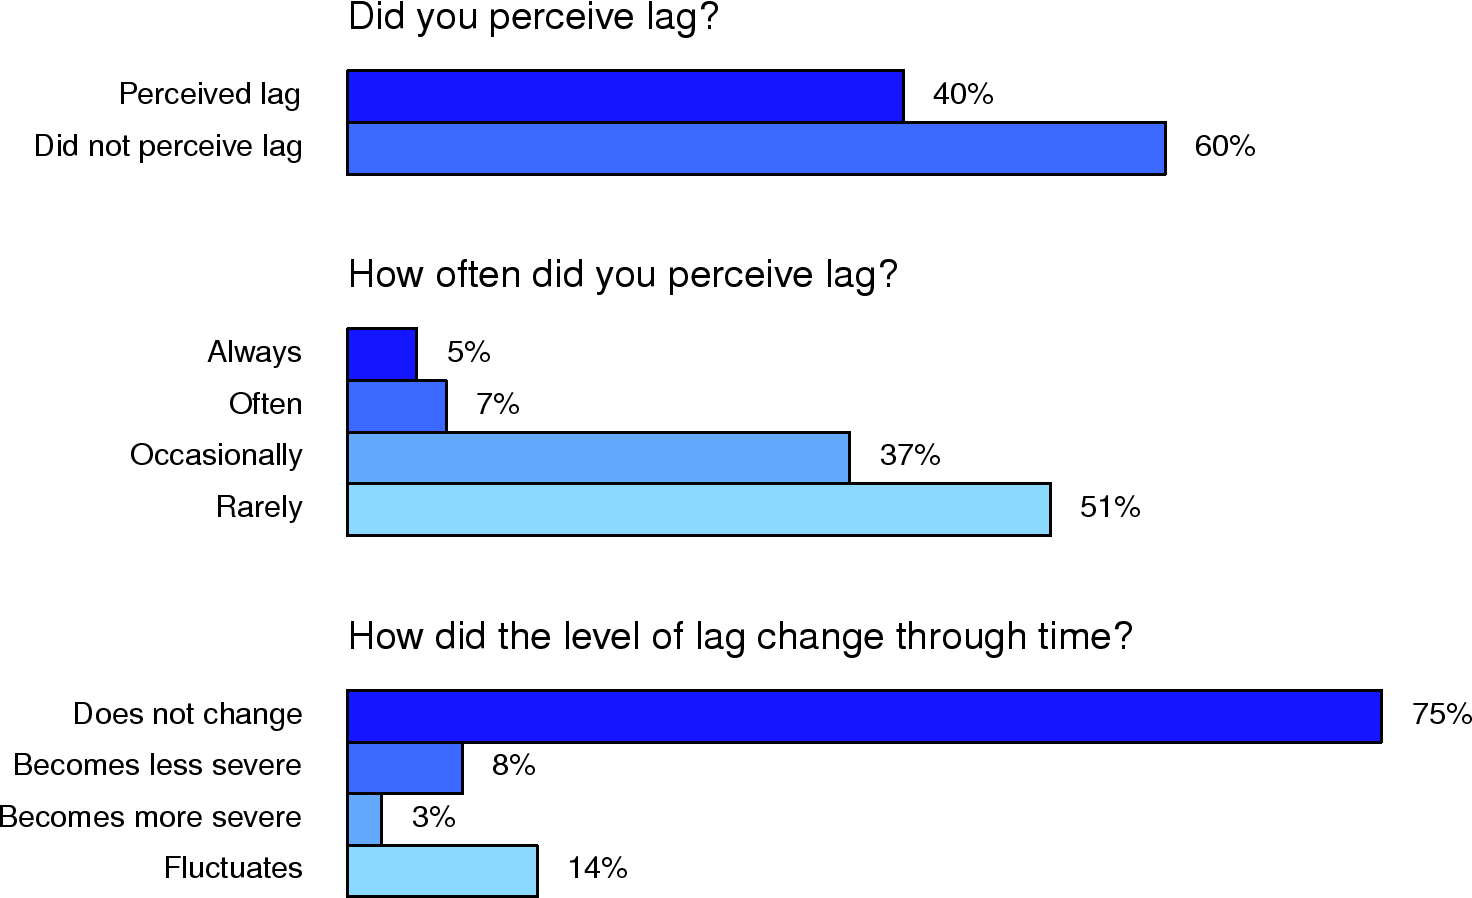
Figure 3: The survey results
5.1 Lag Incident Report
We ask three simple questions regarding the participants' gaming experience during game play:
Did you perceive lag?
How often did you perceive lag?
How did the level of lag change through time?
Figure 3 summarizes the 514 respondents' answers. As the figure shows,
40% of the respondents claim that they encountered lag during the 10-minute gaming
session, and most of them report the lag happened at most occasionally. 75% of the
respondents feel that the levels of lag did not fluctuate throughout the gaming session.
6 Root Cause Analysis of Lag
In this section, we perform a correlational analysis of players' subjective gaming
experience and the objective system metrics collected by GEM in order to identify the
major cause of lag. Since lag consists of many kinds of delay coming from many
places, it is unlikely to find a single dominant cause. To simplify the problem, we first
focus on three possible sources:
Overloading of gamer's computer: We choose the inter-frame-time (ift) to
be the representative index whether a gamer's computer is overloaded or not.
Unstable LAN connectivity: We use the first-hop round-trip time (lan_rtt) to
be the indicator of the quality of LAN connectivity.
Unstable Internet connectivity: We use the round-trip time (rtt) between the
gamer's computer and the game server to be the indicator of the quality of the Internet
path between the two nodes.
Since the GEM traces we collect are sequences of observed data over time and as a result
are hard to be used directly for the purpose of analysis, we compute basic statistics of
each metric, which are referred to as the features of that metric, and use them in our
analysis instead. We use the notation M_V to denote the statistical value
V of the performance metric M. The statistical values we use as
features include mean (mean), maximum (max), minimum (min),
median (median), 99 percentile (99), 95 percentile (95), and
standard deviation (sd). For example, rtt_95 denotes the 95 percentile
of the round-trip times of all packets sent during the monitored gaming session.
6.1 Correlation Analysis
Table 3: Pearson correlation coefficients between performance metrics and lag incidents
mean
median
95
99
max
sd
Cor
0.26
0.17
0.25
0.29
0.22
0.25
p-value
1e-4
1e-4
1e-4
1e-4
1e-4
1e-4
Cor
0.06
0.05
0.05
0.02
0.00
0.03
p-value
0.16
0.28
0.26
0.65
0.91
0.45
Cor
0.02
0.02
0.01
0.04
0.05
0.02
p-value
0.65
0.69
0.81
0.34
0.30
0.70
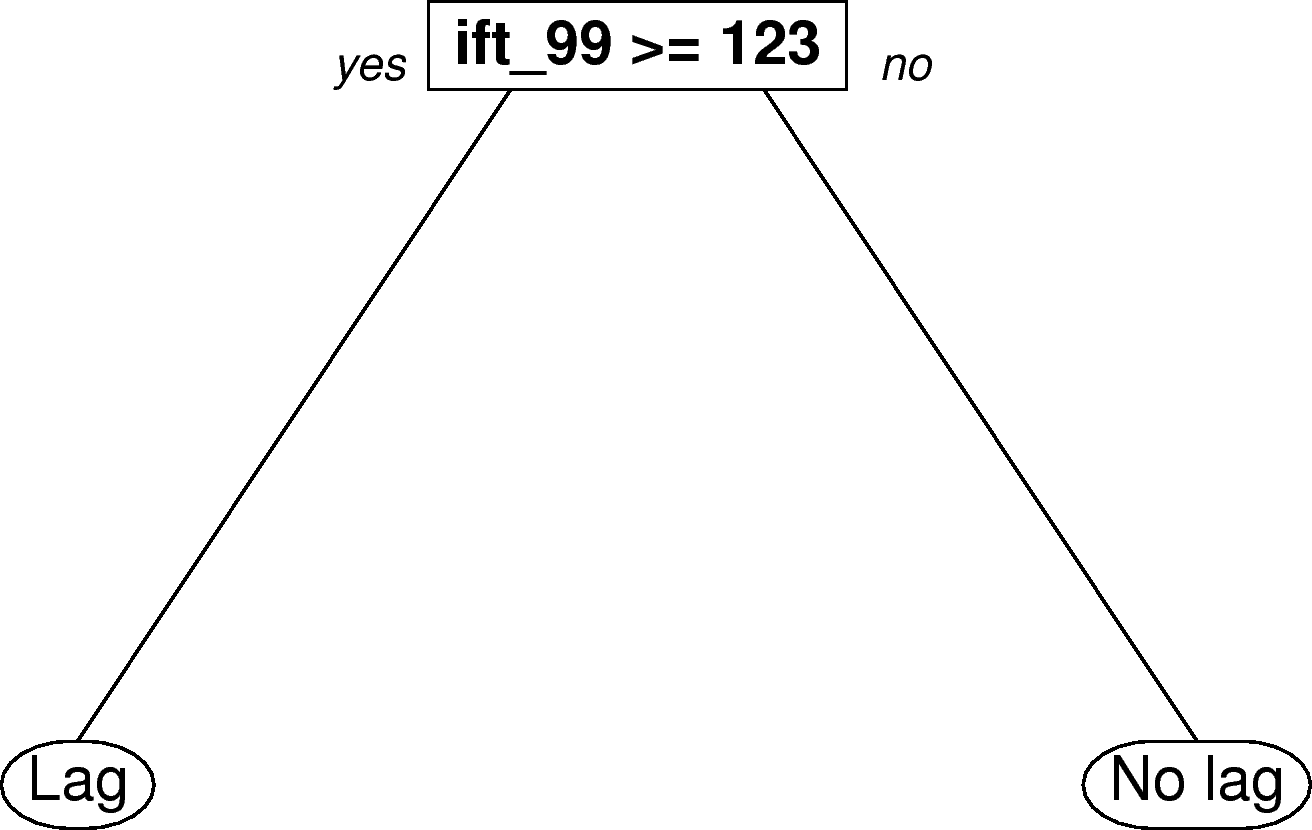
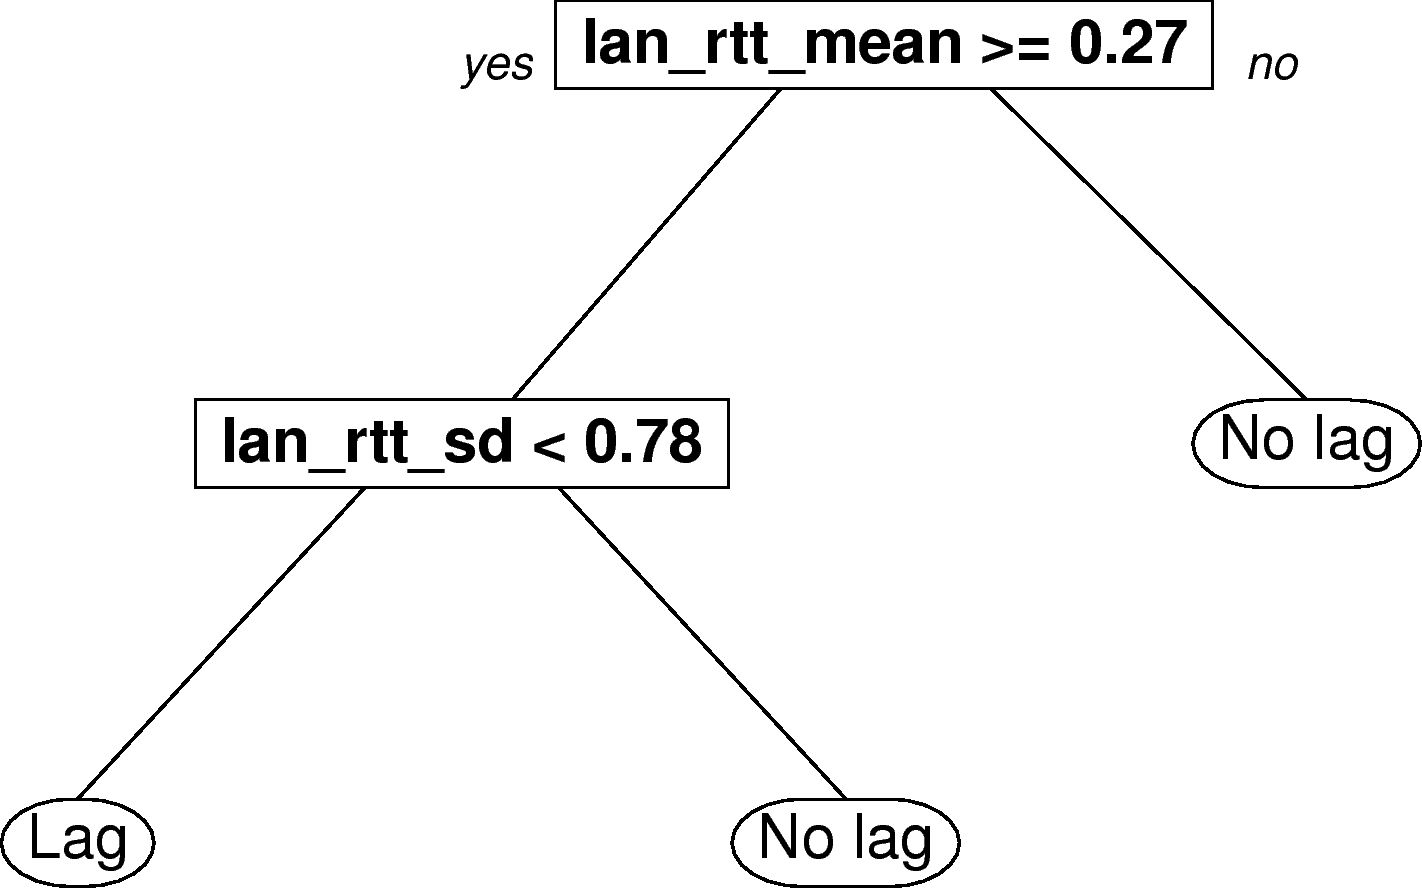
(a) Classification tree of ift(b) Classification tree of rtt(c) Classification tree of lan_rtt
Figure 4: The classification trees of ift, rtt and lan_rtt
If a metric has an significant effect on lag, it is supposed to be highly correlated with gamers' perception of lag. We use Pearson correlation coefficient as our measurement to compare the effects of ift, rtt and lan_rtt on lag. Table III shows the results. The features of ift have correlation coefficients with gamers' perception of lag between 0.17 to 0.29, with ift_99 and ift_mean reach the highest values of 0.29 and 0.26. The p-values are all smaller than 0.0001, which indicates that the results are all significant. The correlation coefficients between the gamers' perception of lag and the features of rtt and lan_rtt are all below 0.1, which indicates that there are no clear correlations. However, the high p-values (none of them are lower than 0.1) also suggest that the results do not have significant meanings. The fact that inter frame time has a higher correlation with the gamers' perception of lag indicates that overloading of gamers' computers is more likely to be a root cause of lag, which is a surprising result since the poor quality of network paths is blamed as the most important factor that impair online gaming experience for years.
6.2 Classification and Regression Trees Modeling
We believe that if a performance metric is a strong cause of lag, it should be able to be
used to predict whether a gamer will perceived lag or not. Therefore, we use the features
of the metrics as predictors to build a Classification and regression trees (CART)
model [7] for each metric using rpart
package3 in R and compare the
prediction accuracies of the resulting classification trees, which are depicted in
Figure 4.
For the prediction accuracies, we do a 10-fold cross-validation for each tree, in which we randomly choose 10% of the total sample as validation data for 10 times, and computes the average of the rates at which the validation data are correctly classified. The cross-validated accuracies for the classification trees of ift, rtt, and lan_rtt are 67.51%, 56.81%, and 59.34%, respectively. The results show that ift outperforms the other two metrics in terms of prediction accuracy, which echoes the results of the correlation analysis in Section VI-A. The consistent results of the two different analyses make us more sure of our conclusion that overloading of gamers' computers is actually the major cause of lag.
7 Conclusion and Future Work
In this paper, we tackle a long-standing question for gamers and game developers:
What is the major cause of lag? To this aim, we developed a software which is
capable of monitoring both the performance of a gamer's computer and the quality of
network path during game play. By collaborating with a top game company in Taiwan, we
have collected 5,482 minutes of performance traces from 514 players as well as their lag
experience reports. We analyze the collected traces via two approaches and conclude that
the root causes of lags are usually coming from gamers' computers due to overloading
and/or insufficient computation power. We hope that this study will balance the
treatment of delay optimization researches as network delay seems to be the overly
emphasized while the delays occurred at the end users' side are usually overlooked.
Acknowledgments
This work would not have been possible without the support from Gamania Digital
Entertainment. The authors are much indebted to our collaborators and supporters at
Gamania, Sirion Lee, Chunhan Huang, Ivy Huang, Karl Hsu, and Albert Liu, among others.
The authors also wish to thank the anonymous referees for their constructive criticisms.
This work was supported in part by the National Science Council under the grant
NSC100-2628-E-001-002-MY3.
References
[1]
P.-H. Tseng, N.-C. Wang, R.-M. Lin, and K.-T. Chen, "On The Battle between Online Gamers and Lags," in Proceedings of IEEE CQR 2011, May 2011.
[2]
K.-T. Chen, P. Huang, and C.-L. Lei, "How Sensitive are Online Gamers to Network Quality??" Communications of the ACM, vol. 49, no. 11, pp.
34-38, Nov 2006.
[3]
P. Quax, P. Monsieurs, W. Lamotte, D. D. Vleeschauwer, and N. Degrande,
"Objective and subjective evaluation of the influence of small amounts of
delay and jitter on a recent first person shooter game," in
Proceedings of ACM NetGames'04, 2004, pp. 152-156.
[4]
S. Zander and G. Armitage, "Empirically measuring the qos sensitivity of
interactive online game players," in Proceedings of the Australian
Telecommunications Networks and Applications Conference 2004. ATNAC, 2004, pp. 511-518.
[5]
A. F. Wattimena, R. E. Kooij, J. M. van Vugt, and O. K. Ahmed, "Predicting the
perceived quality of a first person shooter: the quake iv g-model," in
Proceedings of ACM NetGames'06, 2006.
[6]
M. Claypool, K. Claypool, and F. Damaa, "The effects of frame rate and
resolution on users playing first person shooter games," vol. 6071, 2006,
pp. 607 101-607 101-11. [Online]. Available:
http://dx.doi.org/10.1117/12.648609[7]
L. Breiman, J. H. Friedman, R. A. Olshen, and C. J. Stone, "Classification and
regression trees. wadsworth & brooks," Monterey, CA, 1984.
 (a) Frequency of lag
 (b) Significance of lag
 (c) Duration of lag
 (d) Reactions to lag
 (e) To what degree does lag affect players' game play?
 (f) Where or to whom do players usually complain about their lag problems?
 (g) Players' intuition about root causes of lag
 (h) Strategies to solve lag
 (a) Classification tree of ift
 (b) Classification tree of rtt
 (c) Classification tree of lan_rtt