
Figure 1: A square-shaped boundary with embedded area and circumference information (SVG source at example-1.svg).
Keywords: Mixed-namespace XML processing, Population mapping, Rich/Smart graphics, Scalable Vector Graphics (SVG).
Biography
Yi-Hong Chang has been a research assistant at the Institute of Information Science, Academia Sinica, Taiwan, since Spring 2001, and is the chief developer of the Taiwan Social Map system at the institute. He received his undergraduate and Master degrees, both in Anthropology, from National Taiwan University.
Biography
Tyng-Ruey Chuang is an Associate Research Fellow at the Institute of Information Science, Academia Sinica, Taiwan. His research areas include functional programming, XML and Web technologies, and social implications of information technologies. This is the second time he and Yi-Hong Chang present a paper at the SVG Open conference. He received his PhD degree in Computer Science from New York University in 1993, and his undergraduate degree, also in Computer Science, from National Taiwan University in 1984. He was a visiting researcher at Chalmers University of Technology, Göteborg, Sweden, before returning to Taiwan in 1994.
The extensibility of SVG allows graphics elements to be combined with elements from other domains/namespaces to form SVG documents. We demonstrate in this paper several approaches to extending the DTD of SVG so that domain semantics can be embedded into SVG documents. We are particularly interested in lightweight approaches where
We also argue for the need of an introspective SVG API where intrinsic properties of SVG geometric elements, e.g., the centroid of a polygon, are easily accessible to SVG applications. That is, these intrinsic geometry properties are directly available in SVG DOM and need not be separately computed by user scripts at either the document authoring or rendering time.
1. Motivation
2. Embedding Domain-specific Data in SVG Documents
2.1 Adding New Attributes to SVG Elements
2.2 Extending the Content Models of SVG Elements
2.3 Linking to Domain-specific Data from SVG Elements
3. Putting It Together!
4. An Introspective API for SVG?
5. Related Work
6. Conclusion and Future Work
Footnotes
Acknowledgements
Bibliography
We have been developing Taiwan Social Map [Chang & Chuang, 2002] , a Web-based population mapping system where data from census and other socio-economical datasets is visualized against administration district maps in SVG. Until now, aggregated census data about a district, e.g., local population size and density, is kept in, and computed by, ECMAScript code that accompanying the SVG map. After the SVG document is loaded into an SVG viewer, the associated population data is calculated and displayed upon GUI events (for example, when the mouse is moved inside a district boundary). One drawback of this approach is that the population data is not present in the SVG document itself — it is embedded in ECMAscript — hence difficult to be extracted and re-used by other XML processors.
The extensibility of SVG allows graphics elements to be used with elements from other namespaces [1] . For example, it has been shown that the DTDs of XHTML, MathML, and SVG can be combined into a single profile so that XHTML documents can be authored and rendered with both MathML and SVG elements [XHTML+MathML+SVG] . In this paper we show several lightweight approaches to associating SVG graphics elements (e.g., polygons which represent the boundary of a district) to data from other domains (e.g., census datasets). We emphasis here the importance of producing SVG documents that are renderable by conventional SVG viewers, so that the population maps are easily accessible and usable to the general public. It is just that the SVG documents are now augmented with domain-specific data which can be examined and extracted by users if needed. We could enclose the SVG map in a single XHTML document and use XHTML elements to annotate the domain data (much as what has been described in [XHTML+MathML+SVG] ). However, this is less attractive to us as we really like to use domain-specific vocabulary, not the XHTML vocabulary, for the annotation.
We describe here three approaches to embedding domain-specific data in SVG documents. Each approach is illustrated with a complete SVG document. The advantage and disadvantage of each approach is briefly discussed. In Chapter 3 , the three approaches are combined together to achieve a better result.
Suppose that in our district map each country/town boundary is
expressed by a SVG polygon element. Again, suppose we need to
associate each country/town with its size (the area enclosed
by the polygon) and boundary length (the circumference
of the polygon) in the district map. A straightforward way to
accompany this need is to extend the SVG polygon element type
with two new attributes, area and
circumference, so that such information can be
associated with each polygon element as attribute value.
Figure 1 shows a square-shaped boundary with its area and circumference information embedded in the SVG polygon element. The complete SVG source is listed in Figure 2 . The square has its four coordinates at (10,10), (10,90), (90,90), and (90,10), so it has an area of 6400 and a circumference of 320. When rendered with conventional SVG viewers, the two attributes are ignored and the polygon is displayed as usual.
Figure 1: A square-shaped boundary with embedded area and circumference information (SVG source at example-1.svg).
<?xml version="1.0" encoding="UTF-8"?>
<!DOCTYPE svg PUBLIC "-//W3C//DTD SVG 1.0//EN"
	        "http://www.w3.org/TR/2001/REC-SVG-20010904/DTD/svg10.dtd" [
	<!ATTLIST polygon
                area CDATA #IMPLIED
                circumference CDATA #IMPLIED>
]>

<svg width="100" height="100" viewBox="0 0 100 100"
		xmlns="http://www.w3.org/2000/svg">
  <defs>
	<style type="text/css"><![CDATA[
		polygon { fill: green;
			  stroke: black;
			  stroke-width: 1}
		]]>
	</style>
  </defs>

  <polygon id="_10001001" points="10,10 10,90 90,90 90,10"
                area="6400" circumference="320"/>
</svg>
|
Figure 2: New attributes
areaandcircumferenceare added to element typepolygon.
The advantage of this approach is that the relation between an SVG element and the embedded domain data is very clear: The embedded data appears as the SVG element's attributes. It is also easy to work with: Just add new attribute declarations. The disadvantage, especially when compared with the next two approaches, is that only simple-typed data can be embedded as attribute values. It does not allow the embedding of structure-typed domain information (such as arbitrary XML elements).
While it makes sense to attach area and circumference information to a polygon as attributes, it makes less sense if all country/town-related data, e.g., population size, is associated with every polygon. After all, not all polygons in a district map represent countries or towns. Rather, the boundary, as expressed by an SVG polygon element, is but part of the collective domain data about a country/town. Viewed in this perspective, one shall define a content model for country/town-ship and has the boundary as a child of the county/town element. We will show in Section 2.2 on how to extend SVG content model to incorporate domain data.
On the other hand, as area and circumference are geometry properties possessed by all polygons, why not have these properties computed by an SVG viewer when loading SVG documents? In Figure 2 , the polygon is a square so its area and circumference is easy to calculate. This is not the case for arbitrary polygons. The implementors of an SVG viewer, however, probably are more capable than the general SVG users in computational geometry and are better positioned to these calculations. Furthermore, when rendering an SVG document, the SVG viewer has access to all run-time information about the geometries, hence helps the SVG implementors in these calculations.
In this approach, we take a domain-specific view and use SVG elements only for geometric or visual expressions. An exemplar SVG document is shown in example-2.svg, with its complete source listed below in Figure 3 .
<?xml version="1.0" encoding="UTF-8"?>
<!DOCTYPE svg PUBLIC "-//W3C//DTD SVG 1.0//EN"
                "http://www.w3.org/TR/2001/REC-SVG-20010904/DTD/svg10.dtd" [
	<!ATTLIST svg
                xmlns:m CDATA #IMPLIED>

	<!ENTITY % svgExt "| m:canton">

	<!ELEMENT m:canton (m:name*, m:statistics, m:boundary)>
	<!ATTLIST m:canton
		id ID #REQUIRED
		bndtype (village | county) #REQUIRED>

	<!ELEMENT m:name EMPTY>
	<!ATTLIST m:name
		lang (chinese | tonyonPinyin) "chinese"
		desc CDATA #REQUIRED>

	<!ELEMENT m:statistics (m:population)>

	<!ELEMENT m:population EMPTY>
	<!ATTLIST m:population
		count CDATA #REQUIRED>

	<!ELEMENT m:boundary ((g | path| polygon | polyline |
		rect | circle | ellipse | line)*, m:geometricInfo)>

	<!ELEMENT m:geometricInfo EMPTY>
	<!ATTLIST m:geometricInfo
		area CDATA #IMPLIED
		circumference CDATA #IMPLIED>
]>

<svg width="100" height="100" viewBox="0 0 100 100"
		xmlns="http://www.w3.org/2000/svg"
		xmlns:m="http://example.tsm.iis.sinica.edu.tw">
	<defs>
		<style type="text/css"><![CDATA[
			polygon { fill: green;
				  stroke: black;
				  stroke-width: 1}
			]]>
		</style>
	</defs>

	<m:canton id="_10001001" bndtype="village">
		<m:name lang="tonyonPinyin" desc="myvillage"/>
		<m:statistics>
			<m:population count="100"/>
		</m:statistics>
		<m:boundary>
		    <polygon id="_pg01" points="10,10 10,90 90,90 90,10"/>
		    <m:geometricInfo area="6400" circumference="320"/>
		</m:boundary>
	</m:canton>
</svg>
|
Figure 3: Domain vocabulary is introduced into SVG using a new namespace prefix (
m) and the associated element types (canton,name, etc.).
As shown in
Figure 3
,
we extend the content model of element type svg
by setting the parameter entity svgExt
[2]
to "| m:canton", hence allowing canton elements
to appear as the children of an svg element.
Element type canton is from the namespace
m that defines the domain-specific vocabulary.
A canton element has as its children all the domain data
related to a district: name, statistics, boundary, etc.
The boundary is expressed by SVG geometric elements with the boundary's
area and circumference specified separately by a succeeding
geometricInfo element.
Though elegant, a major drawback of this approach is that the resulting SVG documents will be recognized only in part by most SVG viewers: The canton element is entirely ignored by the viewer and the polygon element within will not be rendered. (Just load the SVG source in example-2.svg into your favorite SVG viewers to see if you will get a blank screen.) The advantage is that one can use a entire new set of domain vocabulary in SVG. The relationship between SVG geometric elements and their semantic annotations is also clear. It is not too difficult to strip out all the enclosing domain-specific tags to reveal the SVG core, hence produce a renderable SVG document as the result.
The idea is to have all domain-specific data,
like information about a canton, reside inside SVG defs elements.
An SVG geometry representing a canton boundary
will then refer to the canton using XLink attributes
[XLink]
.
Compared with the approach in
Section 2.2
,
this approach has the advantage that the resulting SVG document
can be rendered with no problem by conventional SVG viewers.
The new SVG source can be found in example-3.svg.
It is also listed in
Figure 4
in full.
Load the SVG source in
Figure 4
into your favorite SVG viewers to see if you will
get the green square back.
Note that we extend the content model of element type
defs this time,
by setting the parameter entity defsExt
[2]
to "| m:canton", hence allowing canton elements
to appear only inside of SVG defs elements.
<?xml version="1.0" encoding="UTF-8"?>
<!DOCTYPE svg PUBLIC "-//W3C//DTD SVG 1.0//EN"
        	"http://www.w3.org/TR/2001/REC-SVG-20010904/DTD/svg10.dtd" [
	<!ATTLIST svg
		xmlns:m CDATA #IMPLIED>

	<!ENTITY % defsExt "| m:canton">

	<!ELEMENT m:canton (m:name*, m:statistics, m:geometricInfo)>
	<!ATTLIST m:canton
		id ID #REQUIRED
		bndtype (village | county) #REQUIRED>

	<!ELEMENT m:name EMPTY>
	<!ATTLIST m:name
		lang (chinese | tonyonPinyin) "chinese"
		desc CDATA #REQUIRED>

	<!ELEMENT m:statistics (m:population)>

	<!ELEMENT m:population EMPTY>
	<!ATTLIST m:population
		count CDATA #REQUIRED>

	<!ELEMENT m:geometricInfo EMPTY>
	<!ATTLIST m:geometricInfo
		area CDATA #IMPLIED
		circumference CDATA #IMPLIED>

	<!ATTLIST polygon
		xlink:type (simple) #FIXED "simple"
		xlink:title CDATA #IMPLIED
		xlink:actuate (onRequest) #FIXED "onRequest"
		xlink:href CDATA #IMPLIED>
]>

<svg width="100" height="100" viewBox="0 0 100 100"
		xmlns="http://www.w3.org/2000/svg"
		xmlns:m="http://example.tsm.iis.sinica.edu.tw"
		xmlns:xlink="http://www.w3.org/1999/xlink">
	<defs>
		<style type="text/css"><![CDATA[
			polygon { fill: green;
				  stroke: black;
				  stroke-width: 1}
			]]>
		</style>

		<m:canton id="infoOf_10001001" bndtype="village">
			<m:name lang="tonyonPinyin" desc="myvillage"/>
			<m:statistics>
				<m:population count="100"/>
			</m:statistics>
			<m:geometricInfo area="6400" circumference="320"/>
		</m:canton>
	</defs>

	<polygon id="_10001001" points="10,10 10,90 90,90 90,10"
		xlink:href="infoOf_10001001"/>
</svg>
|
Figure 4: Domain vocabulary is used only inside of SVG
defselements. SVG geometric elements use XLink references for semantic linkage.
The three approaches described in
Chapter 2
can be combined to achieve greater effect. We describe here
but an example we are adding to the Taiwan Social Map system.
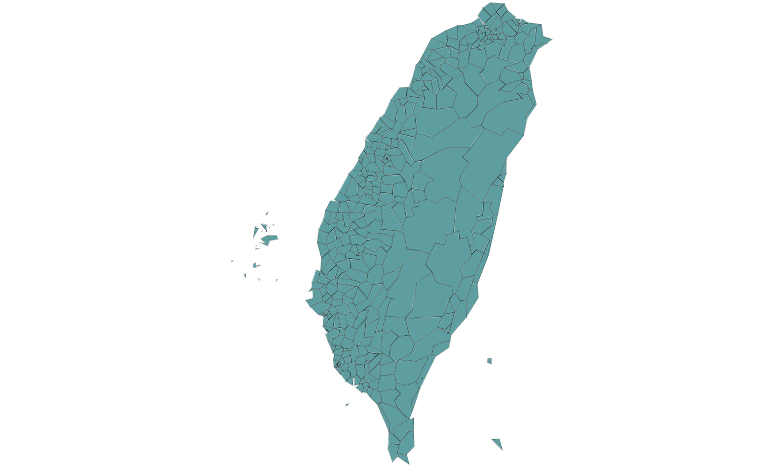
We have prepared from the 2000 census dataset a district map of Taiwan that
includes all the 359 2nd-level administration districts
(i.e., country/town/city). The boundary of each district is expressed
by an SVG path element. Attached to each path element,
however, are three new attributes: centroidX,
centroidY, and xlink:href.
They are used to embed district information into the geometry of
district boundary. The (centroidX, centroidY) pair constitutes
the coordinate of the centroid of the district. The XLink
points to additional district information residing in an SVG defs
element. The district data, in this particular case,
consists of the district name in TongyongPinyin-styled romanization,
the population size and its ethnic decomposition, among others.
A fragment of the SVG source with the relevant parts
is shown in
Figure 5
.
The result of an SVG rendering of the district map
is shown in
Figure 6
.
<?xml version="1.0" encoding="UTF-8"?>
<!DOCTYPE svg PUBLIC "-//W3C//DTD SVG 1.0//EN"
	  "http://www.w3.org/TR/2001/REC-SVG-20010904/DTD/svg10.dtd" [
        ....

	<!ENTITY % defsExt "| tsm:cantons">
	<!ELEMENT tsm:cantons (tsm:canton)*>
	<!ELEMENT tsm:canton (tsm:countyName, tsm:townName,
		  tsm:countyNamePinyin, tsm:townNamePinyin, tsm:area,
		  tsm:population, tsm:statistics)*>
        ....

	<!ELEMENT tsm:statistics (tsm:Han | tsm:Paiwan | tsm:Bunun |
		  tsm:Puyuma | tsm:Amis | tsm:Atayal | tsm:Rukai |
		  tsm:Tsou | tsm:Tau | tsm:Others | tsm:Saisiat)*>

	<!ELEMENT tsm:Han EMPTY>
	<!ATTLIST tsm:Han
	count CDATA #REQUIRED>

	....
	]>

<svg viewBox="0 0 260618 377029" xmlns="http://www.w3.org/2000/svg"
		xmlns:tsm="http://example.tsm.iis.sinica.edu.tw"
		xmlns:xlink="http://www.w3.org/1999/xlink">
	<defs>
		....

		<tsm:canton id="infoOf_1000801">
			<tsm:countyNamePinyin>Nantou County</tsm:countyNamePinyin>
			<tsm:townNamePinyin>Nantou City</tsm:townNamePinyin>
			<tsm:area>71.6008</tsm:area>
			<tsm:population>97469</tsm:population>
			<tsm:statistics desc="Population of Ethnic Groups">
				<tsm:Han count="96921"/>
				<tsm:Paiwan count="45"/>
				<tsm:Bunun count="216"/>
				<tsm:Puyuma count="13"/>
				<tsm:Amis count="113"/>
				<tsm:Atayal count="94"/>
				<tsm:Rukai count="12"/>
				<tsm:Others count="11"/>
				<tsm:Tsou count="27"/>
				<tsm:Tau count="14"/>
				<tsm:Saisiat count="3"/>
			</tsm:statistics>
		</tsm:canton>

		....
	</defs>

		....

	<path centroidX="126307.837425"  centroidY="152741.66092"
                class="normalBoundary"	d="M126434,149343L131895,149725 .... "
                id="_1000801"  xlink:href="#infoOf_1000801"/>

         	....
</svg>
|
Figure 5: The SVG source for the Taiwan district map (showing only fragments, complete SVG source at taiwan.svg).
A district map where the centroid information is embedded with each district will allow easy manipulation of map information. It becomes easy to perform range query, for example. Given a district A and a radius r, one can easily calculate all districts whose centroids are within range r of the centroid of A. Figure 7 contains such a map. In the map, Nantou City of Nantou County (the origin) is shown in red and all districts within 15,000 SVG units of Nantou City are shown in yellow. Based on the proximity information of districts, one can further use the associated XLink references to access, tabulate, and compare domain information of neighboring districts. This is shown in Table 1 , where ethnic populations of neighboring districts are tabulated and compared. These results can be generated off-line using customized XML applications, or be calculated interactively using ECMAscript when the map is loaded into SVG viewers.
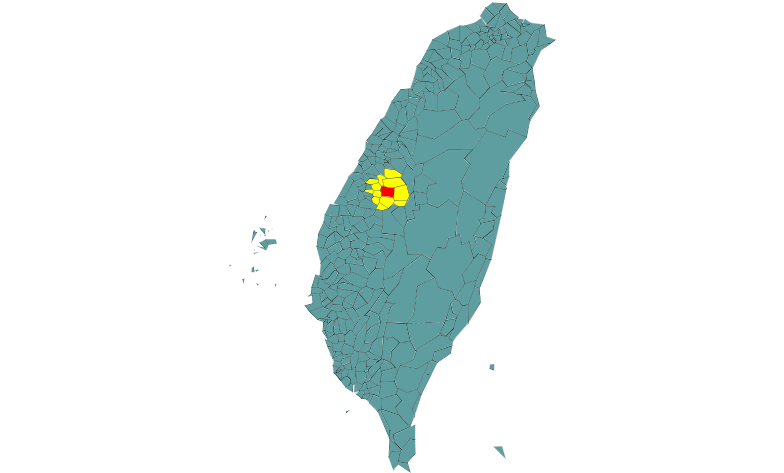
Figure 7: Neighboring districts are located using embedded district centroid information. (SVG source at taiwan-demo.svg).
| Country/ Town/ City | Han | Paiwan | Bunun | Puyuma | Amis | Atayal | Rukai | Saisiat | Tsou | Tau | Others |
|---|---|---|---|---|---|---|---|---|---|---|---|
| Wufong Country | 66430 | 31 | 38 | 5 | 210 | 26 | 20 | 0 | 1 | 2 | 7 |
| Fenyuan Country | 25301 | 6 | 3 | 0 | 26 | 10 | 0 | 0 | 2 | 1 | 0 |
| Yuanlin Town | 118329 | 11 | 10 | 9 | 61 | 14 | 4 | 0 | 10 | 1 | 3 |
| Tianjhong Town | 44321 | 10 | 29 | 2 | 48 | 11 | 0 | 0 | 0 | 0 | 0 |
| Dacun Country | 38776 | 14 | 28 | 0 | 38 | 2 | 0 | 0 | 0 | 0 | 0 |
| Yongjing Country | 37262 | 9 | 1 | 0 | 7 | 3 | 5 | 0 | 4 | 0 | 1 |
| Shetou Country | 42737 | 5 | 7 | 0 | 6 | 8 | 0 | 2 | 2 | 4 | 2 |
| Ershui Country | 16633 | 6 | 17 | 4 | 6 | 3 | 0 | 0 | 0 | 0 | 0 |
| Nantou City | 96921 | 45 | 216 | 13 | 113 | 94 | 12 | 3 | 27 | 14 | 11 |
| Caotun Town | 91449 | 7 | 46 | 7 | 60 | 49 | 20 | 3 | 8 | 7 | 4 |
| Jiji Town | 11384 | 19 | 27 | 1 | 9 | 6 | 4 | 1 | 0 | 0 | 4 |
| Mingjian Country | 39203 | 13 | 29 | 4 | 21 | 18 | 12 | 1 | 5 | 0 | 6 |
| Jhongliao Country | 14240 | 1 | 3 | 1 | 5 | 5 | 1 | 1 | 0 | 1 | 0 |
Table 1
In Section 2.1 , we have argued for the automatic inclusion of certain geometric properties (e.g., the area, circumference, and centroid of a polygon) into SVG document objects at run-time so that they are easily accessible to the users. Easy access to these geometric properties of SVG elements helps users script dynamic SVG applications, as shown in Chapter 3 . The task of computing these geometric properties probably is better left to the geometric library included in the SVG viewer rather than to the usual SVG users.
It seems highly desirable to us to have a standard set of introspective APIs for SVG document objects, so that geometric properties of SVG elements can be queried at run-time. Besides querying individual elements for their properties, the API can also be used to query multiple SVG elements for their relationship. For example, one should be able to use the API to test whether two paths intersect each other and, if so, where. At the present of such an introspective API, one need not statically compute these results when the SVG document is being generated, nor do it dynamically using ECMAscript when the document is being viewed. Such an introspective API for SVG will help reduce many coding effort when generating dynamic SVG graphics.
Our work as reported in this paper clearly is related to mixed-namespace XML document processing, as well as to Web resource description and sharing.
It has been shown that the DTDs of XHTML, MathML, and SVG
can be combined into a single profile so that XHTML documents
can be authored and rendered with both MathML and SVG elements
[XHTML+MathML+SVG]
. The combined
profile can be configured to have svg as the root
element, hence allowing SVG documents to include both XHTML
and MathML elements. To render these SVG documents,
the viewer must understand XHTML and MathML vocabulary.
What we propose in this paper is simpler yet more useful
for our purposes. We attach geometric properties to SVG
elements as new attributes, and use hyperlinks to
point to domain data (always residing in defs elements).
The resulting SVG documents can be rendered by
conventional SVG viewers. Domain semantics is extracted
by following the XLink references, either by run-time scripts
or, in a separate process, by XML processors.
In
[Herman & Dardailler, 2002]
, a RDF-based approach has been
used for textual summarization of structural information in SVG documents.
RDF statements, about the semantic and positional relationship among the
various graphics and text elements in a SVG document, are
contained in the metadata element of the document.
These RDF statements can be be processed, with the help of
the desc elements present in the document, to
generate textual description of the SVG document for
accessibility and summarization purposes. When compared with
this approach, our approach is more restricted in the sense
that the XLink references we used to link SVG elements to
domain elements have a fixed connotation, while a RDF-based
approach allows a richer vocabulary to describe the various
relations. On the other hand, we deal with the linkage of SVG
elements to other domain elements, while in
[Herman & Dardailler, 2002]
they emphasize on SVG
elements (and the relationship among) themselves.
An issue in authoring and processing mixed-namespace SVG documents (or any XML document with a DTD-based vocabulary) is that DTD does not fully support XML Namespaces [XML Namespace] . The domain vocabulary one wishes to use in conjunction with SVG DTD has to be expressed and included into the combined SVG profile in a rather restricted manner (e.g., by using a fixed namespace prefix and a fixed profile inclusion order). This issue is especially evident if the domain vocabulary is expressed in XML Schema. This will not be an issue in SVG 1.2 [SVG 1.2] which plans to use XML Schema [XML Schema] instead of DTD as the schema language.
We have shown in this paper several approaches in embedding domain semantics in SVG. A complete example is presented to illustrate the embedding of domain data in a Taiwan district map, as well as the retrieval of domain data from the map for further processing. We are currently investigating several domain vocabularies, such as GML [GML] and DDI [DDI] , for embedding in SVG. A social map will then be an SVG document with rich GML and DDI information. A new generation of the Taiwan Social Map system that fully incorporates these ideas is currently being developed and we hope to bring it online soon.
See [SVG 1.0] at http://www.w3.org/TR/2001/REC-SVG-20010904/extend.html.
See [SVG 1.0] at http://www.w3.org/TR/2001/REC-SVG-20010904/svgdtd.html#DefinitionsStruct.
We would like to thank our colleague Chin-Lung Chang for his help in preparing Figure 7 and Table 1 at a very crucial time. We thank the referee in pointing out the related RDF-based approach to textual summarization of structural information in SVG documents.
The work reported here is supported, in part, by the National Science Council of Taiwan (contract no. NSC-91-2219-E-001-005), and by the Institute of Applied Science and Engineering Research, Academia Sinica, Taiwan.
XHTML rendition created by gcapaper Web Publisher v2.0, © 2001-3 Schema Software Inc.