Forecasting Online Game Addictiveness

Jing-Kai Lou, Kuan-Ta Chen, Hwai-Jung Hsu, and Chin-Laung Lei

PDF Version | Contact Us

Also see the featured article Mind Reading to Predict the Success of Online Games at IEEE Spectrum.

Abstract

Online gaming has now become an extremely competitive business. As there are so many game titles released every month, gamers have become more difficult to please and fickle in their allegiances. Therefore, it would be beneficial if we could forecast how addictive a game is before publishing it on the market. With the capability of game addictiveness forecasting, developers will be able to continuously adjust the game design and publishers will be able to assess the potential market value of a game in its early development stages.
In this paper, we propose to forecast a game's addictiveness based on players' emotional responses when they are first exploring the game. Based on the account activity traces of 11 commercial games, we develop a forecasting model that predicts a game's addictiveness index according to electromyographic measures of players' two facial muscles. We hope that with our methodology, the game industry could optimize the odds of successful investments and target more accurately the provision of a better entertaining experience.
Addiction, Affective Computing, Electromyography, Facial EMG, Psychology, Quality of Experience

1  Introduction

Online gaming is one of the most popular cyber entertainment activities in the world. Millions of people are addicted to virtual worlds rendered by online games, and billions of dollars of business are generated from such actitivties2. There are seemingly countless game development venders competing in this market segment who continuously invest in the development of games with more fun gameplay and more attractive storylines. As an inevitable consequence, online gaming has now become extremely competitive with so many game titles released every month that compete for attention and loyalty of increasingly fickle customer-players. It is not uncommon that a game developed over several years may in the end only be popular for a few months after its release, and then quickly forgotten with its players moving on to newer game titles, long before the game's investment could ever be paid off.
In general, game publishers profit from an online game from two major sources: subscription fees (usually a flat monthly fee) and virtual item sells [1]. Since an online game's revenue is associated with the size of its player population, how to attract and retain players to a game are among the most important challenges to game publishers. To attract new players to a game involves various non-technical or even non-game factors, such as the marketing strategies, release timing (e.g., a summer vacation launch), and cultural references (e.g., Oriental or Occidental). On the other hand, to retain players after they join a game is primarily dependent on the game design and content. Players stay in a game if they can continuously have fun in the game, which is decided collectively by a myriad of factors. Some of the factors are measurable, such as the game server and software reliability, frequency of lags [2], and number of cheating incidents [3], while others are unmeasurable, such as the artistic design, sense of achievement provided [4,[5], and even in-game atmosphere created by the combination of all the visual and audible elements [6]. To clarify further discussion, we define the capability that a game retains players once they join the game as the addictiveness of the game, as it quantifies how probable the game can make a player addicted to it.
Challenge. To evaluate an online game's addictiveness before introducing it to the market is extremely difficult. In the industry, the state-of-practice approach is to base this assessment on designers' intuition, experience, and the feedback from a focus group, which tends to be limited and biased. And whereas psychologically inspired methods, such as [7,[8], have been proposed, such approaches involve significant subjective evaluations and require further support with objective evidence.
Conjecture. Intuitively, players prefer entertaining games rather than boring ones [9,[10]. During gameplay, a gamer experiences a variety of emotions, such as joy, tension, excitement, which may be represented as the degree of entertainment he perceives. This intuition leads us to ask: "Is the emotion a gamer arises when playing a game associated to the game's addictiveness?"
cs_muscle.png (a) Corugattor supercilli muscle    zm_muscle.png (b) Zygomaticus major muscle
Figure 1: Common facial muscle groups used for emotion measurements. Figure courtesy of Wikipedia (http://en.wikipedia.
org/wiki/Facial_electromyography).
Proposal. In psychophysiology, biological signals such as the heart rate, blood pressure, and electrical potentials of muscles can be used to estimate the emotional and mental states of human beings. We find that the facial electromyography (EMG) approach [11], which measures the activity of certain facial muscles, is particularly useful for inferring players' emotions during gameplay [12]. We use the EMG potentials measured at 1) the corrugator supercilii muscle, which is located at the medial end of the eyebrow and beneath the forehead, and 2) the zygomaticus major muscle, which starts at the cheekbone and extends to the corners of the mouth, as illustrated in Figure 1. The EMG potentials measured at these two muscle groups are known to be associated with humans' positive and negative emotions, respectively [11,[12]. We will employ the facial EMG approach to assess players' emotions and investigate if the emotions during gameplay can be an indicator of a game's addictiveness.
Contribution. In this paper, we propose to forecast a game's addictiveness based on players' emotional responses when they are first exploring the game. To verify our proposal, we first quantify the addictiveness of 11 real-life games based on their account usage traces, conduct a user study which involves 84 subjects and 155 hours of emotion traces, and then analyze whether the games' addictiveness is predictable based on the players' emotions during gameplay. Our results indicate that such forecasting is feasible. More specifically, our prediction model can forecast a game's addictiveness with a reasonable accuracy given the positive and negative emotion measures from a small focus group.
Our contributions in this paper are two-fold:
  1. We propose an addictiveness index to quantify how addictive a game is. The index is independent of a game's population and usage patterns, and thus generally applicable to all types of games.
  2. We develop a regression model that takes the facial EMG measurements of players as the input and outputs for the addictiveness of a game.
The remainder of this paper is organized as follows. Section II provides a review of related works, and then we discuss how to quantify a game's addictiveness based on its account activity records in Section III. Next, we present our methodology for measuring the players' emotions that arise during gameplay in Section IV. In Section V, we develop a model that predicts a game's addictiveness based on facial EMG measure. Finally, we conclude this paper in Section VI.

2  Related works

2.1  Game Play Behavior Analysis

Lee et al. collected a dataset which comprises the activity of 91,065 World of Warcraft avatars, where the trace included the avatars' game play times and a number of attributes, such as their race, profession, current level, and in-game locations [13]. Based on this rich dataset, Tarng et al. proposed a methodology to predict whether a player will permanently leave a game in the near future or not [14]. Pittman et al. also analyzed the avatar behavior in World of Warcraft, such as how their population changes over time, how they are distributed in the virtual world, and the churn rate of players. The authors later applied the same analysis to another famous online game, Warhammer Online [15].
In [16], Chambers et al. analyzed a server trace of over 550 online games to investigate system issues that included whether the server workload is predictable and whether the infrastructure can be shared amongst games and other interactive applications. In a later analysis of a long-term server trace of EVE Online [17], the same authors investigated the relationship between the game population and new game features. They also made an observation that the later a player joins the game, the higher the probability that the player would quit sooner.

2.2  Facial EMG Measurement

Facial EMG measurement has been adopted in various studies to measure players' emotion during game play. For example, Ravaja et al. studied how gamers' emotions vary in response to certain in-game events [4,[5], with their results confirming that players' positive emotions are highly related to the achievements acquired, while the negative emotions are correlated with wounds and death experienced in the game [5]. In [18], Lee et al. assessed whether all computer games are equally friendly to the cloud gaming architecture by quantifying the amount of frustration experienced due to the inevitable latency in cloud gaming. To formalize players' emotional states, Mandryk et al. [10] developed a fuzzy logic model to transform physiological signals into five emotional states relevant to computer game play: boredom, challenge, excitement, frustration, and fun. In addition, Nacke et al. studied players' emotions during game play with a variety of settings [9,[6,[19]. They examined how the background music and sound effects influence the gaming experience [6]. The results indicate that music generally affects the gaming experience in a positive way, but the timing it starts and stops is critical. They also investigated how the game difficulty level and players' skill affect players' emotion [9], and reported that the measured players' emotional states can faithfully represent the gaming experience in real time.

3  Quantifying Game Addictiveness

In this section, we propose an index to quantify the addictiveness of online games. We start by introducing the dataset we use and then discuss why quantifying game addictiveness is challenging. We conclude this section by formalizing and demonstrating our proposed addictiveness index using the real-life games in our dataset.

3.1  Dataset Description

Table 1: Summary of the games from the Gamania dataset
Game PublishTrace # Accounts User
Year Period Rating
ACT1 2009 240 days 500K+ 8.6
ACT2 2009730 days 100K+ 8.9
ACT3 2009 773 days500K+ 8.9
ACT4 2010 609 days1,000K+8.0
FPS1 2009 732 days1,000K+ 8.2
FPS2 2010 556 days100K+ 7.4
RPG1 2009 385 days100K+ 7.5
RPG2 2009 323 days100K+ 8.0
RPG3 2010 486 days100K+ 7.5
RPG4 2010 732 days50K+ 8.3
RPG5 2010 820 days50K+ 8.3
Collaborating with Gamania Digital Entertainment3, a top three game company in Taiwan, we obtained the account activity records (AAR) of 11 online games operated by the company. The format of an AAR record is simple: Each record comprises a player account and the start and end time of each game session. The 11 games include 5 role-playing games (RPG), 4 action (ACT) games, and 2 first-person shooter (FPS) games. The games have different release dates and trace periods, with the trace period ranging from 240 days to 820 days. The number of accounts observed in the AAR of different games varies significantly; that is, while more than 4 million accounts are registered for the most popular game, only 50 thousand accounts are associated with the least popular one. The information about the 11 games are summarized in Table I, where the actual game titles are anonymized because of the confidentiality agreement with Gamania. In the table, we also provide the average user rating (on a 1-10 scale) from the company's internal focus group studies. We can observe that there is no clear relationship between the game genre (ACT, FPS, and RPG), number of accounts, and user rating.
ratio_of_presence_c5.png (a) RPG1 ratio_of_presence_div.png (b) RPG2 ratio_of_presence_mkz.png (c) FPS2
Figure 2: The RoP curves of three games in the Gamania dataset. The numbers above the curves denote the presence days (the numerator) and the observation period (the denominator).

3.2  Why Do We Need An Addictiveness Index?

Given a set of AAR records for a game, one can easily compute when and how long a gamer is online playing a game. To facilitate comprehension of the terms in our further discussion, we define the subscription period of a gamer as the time span (in days) of his first and last game sessions, and define the presence days as the total number of days that the gamer enters the game at least once within the subscription period.
We assume that a game is more addictive if its gamers, relatively speaking, tend to play it as much as they can. However, to quantify the phenomenon of addictiveness is not a trivial matter. The players of game A, for example, may tend to play the game incontinently in the first few weeks, but only be online sporadically afterwards. In contrast, the players of game B may not play the game unrestrainedly, but tend to play it regularly for a long time. On average, the players of the games A and B may have similar subscription periods and number of presence days, but it is hard to determine which game is more addictive. From this example, we know that both the subscription period and presence days are in themselves not good indicators of a game's addictiveness.

3.3  A General Addictiveness Index

We define a metric called the ratio of presence (RoP), which combines the subscription period and presence days by dividing the former into the latter. For example, if a player subscribes to a game for 100 days and logs in the game only on 20 days, the player's RoP would be 20/100=0.2. As RoP quantifies a gamer's degree of participation in the unit of days throughout the subscription period, it should more or less reflect his loyalty to the game. We depict the average subscription period, presence days, and RoP of each of the 11 games in Figure 3. From the graph, it looks like the RoP over the subscription period is not sufficiently comprehensive to capture the addictiveness of a game. For example, the RoPs of ACT1, RPG1, RPG2, RPG3, and RPG5 are all beyond 0.45. On the other hand, FPS1, which has the longest subscription period and presence days, yields an RoP smaller than 0.2. This seems unreasonable because a long subscription period and a large number of presence days both suggest the addictiveness of a game.
rop.png
Figure 3: The average subscription period, presence days of the studied games. The number to the right of each bar stands for the ratio of presence (RoP) of each game.
To pursue a more comprehensive index, we generalize the RoP index to include an "observation period" parameter as
RoP(OP)= Presence dayswithin OP

OP
,
(1)
where OP stands for the length of the observation period in days. Note that the observation period always starts from the day a player first joins the game. For example, assuming that Alex first joins a game on January 1st, 2012 and comes back on the 2nd, 3rd, 5th, 7th, 8th, and 9th in January, then Alex's RoP(1) is 1, RoP(5) is 4/5=0.8, and RoP(10) is 7/10=0.7.
According to Equation 1, RoP is a non-decreasing function as the presence days will never increase faster than the length of the observation period. In practice, the RoP declines fast over time, since most players cannot enter a game every day even if they like the game very much. We consider that the decline rate of RoP, rather than the RoP itself, represents how addictive a game is. The rationale for this is that different games may lead to different session structures. For instance, gamers tend to play a few battles, each of which lasts less than an hour, in FPS games for a long period, say, years. On the other hand, an MMORPG encourages gamers to stick to the virtual world continuously for weeks or months, but it may no longer be that attractive after players have conquered the most interesting quests in the game. The situation is like an endurance race vs. an explosive race, which cannot be directly comparable simply by the racers' pace. Thus, by focusing on the decline rate of RoP(OP), we judge the addictiveness of a game by the difference in the players' participation density over time, which is independent of the player population, session structure, and game life cycles, and thus making the index comparable across games.
Figure 2 shows the averaged RoP functions over different observation periods (OP) of three games in our dataset, where OP ranges from 1 to 100 days4. We find that since the RoP curves follow a power-law relationship with OP, they can be modeled by
RoP(OP) ≈ a·OPβ + b,
(2)
where a and b are constants, and β represents the decline rate of the RoP curve. Since our RoP curves decline over time, β must be negative with a smaller β corresponding to a more quickly declining RoP curve.
Figure 2 shows the RoP curves of the games (denoted by the green cross marks) and their approximated curves (denoted by the red lines) derived using the ordinal linear regression (Equation 2). According to Figure 3, we can see that the players of RPG1 and RPG2 have similar subscription periods, presence days, and overall RoPs (0.45 and 0.47). However, as shown in Figure 2(a) and Figure 2(c), the RoP curve of RPG2 declines faster than that of RPG1, which indicates that the players of RPG2 tend to play the game less actively over time. This phenomenon is well captured by our addictiveness index β. The β of RPG1 and RPG2 are -0.38 and -0.50 respectively, which suggests that RPG1 is more addictive than RPG2.
We summarize the addictiveness index β and the R2 from the linear regression modeling of all the 11 games in Table II. The R2 column indicates that all the RoP curves can be modeled using the power-law function (Equation 2) extremely well.
Table 2: The addictiveness index β of the games
Game β R2Game β R2
ACT1 −0.44 1.00 RPG1 −0.38 0.98
ACT2 −0.491.00 RPG2 −0.500.98
ACT3 −0.37 1.00 RPG3 −0.500.99
ACT4 −0.43 1.00 RPG4−0.581.00
FPS1 −0.45 0.99 RPG5 −0.430.99
FPS2 −0.65 0.99

3.4  Addictiveness Index Explored

Figure 4 illustrates the relationship between β and three relevant factors: 1) The average session count, as the average number of sessions made by each gamer throughout his subscription period; 2) the average online time, as the average total game play time of each gamer; and 3) the average user rating from a focus group. We can see that β is positively correlated with the three factors with a moderate to strong coefficient 0.68, 0.66, and 0.35, respectively. This observation establishes that β is not only reasonably related to a variety of measures about players' involvement to a game, but also provides a general, population- and genre-independent approach to quantify the addictiveness of online games.
beta_vs_others.png
Figure 4: The relationships between β and four relevant factors.

4  Measuring Player Emotion

emg_cs_vs_zm.png
Figure 5: The relationship between the subjects' average negative emotion (CS) and positive emotion (ZM) during gameplay.
In this section, we present our methodology for measuring players' emotion when they are first playing the games under investigation. We first describe our experiment setup and then discuss our approach for quantifying the strength of players' positive and negative emotions.
To monitor players' emotional states during gameplay, we setup an environment for facial EMG measurements. Our devices included the PowerLab system, BioAmp signal amplifier, and LabChart. After a subject sat down at a computer, we attached two pairs of electrodes at the corugator supercilli and zygomaticus major muscle groups on the subject's face (c.f. Figure 1). Each subject was asked to play 1 to 3 games that the subject had never experienced. This requirement is important so that we can assess the subjects' first-time experience with the games. We require each game session to be continuous without any interruptions and no shorter than 45 minutes, which did not include pre-game procedures such as avatar creation. During each session, we recorded the electrical potentials measured at the corugator supercilli and zygomaticus major muscles with a 1,000 Hz sampling frequency.
We recruited a total of 84 subjects from an Internet community. The subjects comprised 74 males and 10 females with ages ranging from 19 to 34 years. In total, we obtained 192 EMG traces (corresponding to 192 game sessions) with an overall duration of 155 hours, where each game was played by 15 to 19 subjects.
Since different subjects tend to have different levels of skin conductance, the electrical potential measures cannot be used directly. Instead, we compute the variability of the electrical potentials by taking the absolute differences of successive EMG samples. More concretely, assuming that P={p1,p2, …, pn} is the time series of electrical potential samples, we define a function f of P to quantify the strength of a player's emotion as
f(P)=mean(abs(p2−p1),abs(p3−p2),…,abs(pn−pn−1)),
where mean(·) and abs(·) denote the arithmetic mean and the absolute value function, respectively. Note that n tends to be large since the EMG samples are taken at 1,000 Hz, so a 45-minute trace comprises a time series of length 45×60×1,000=2,700,000. We compute f of the EMG samples measured at the corugator supercilli muscle as CS and denote it as the strength of the negative emotion; similarly, f of the EMG samples measured at the zygomaticus major muscle is used to represent the positive emotion and denoted as ZM.
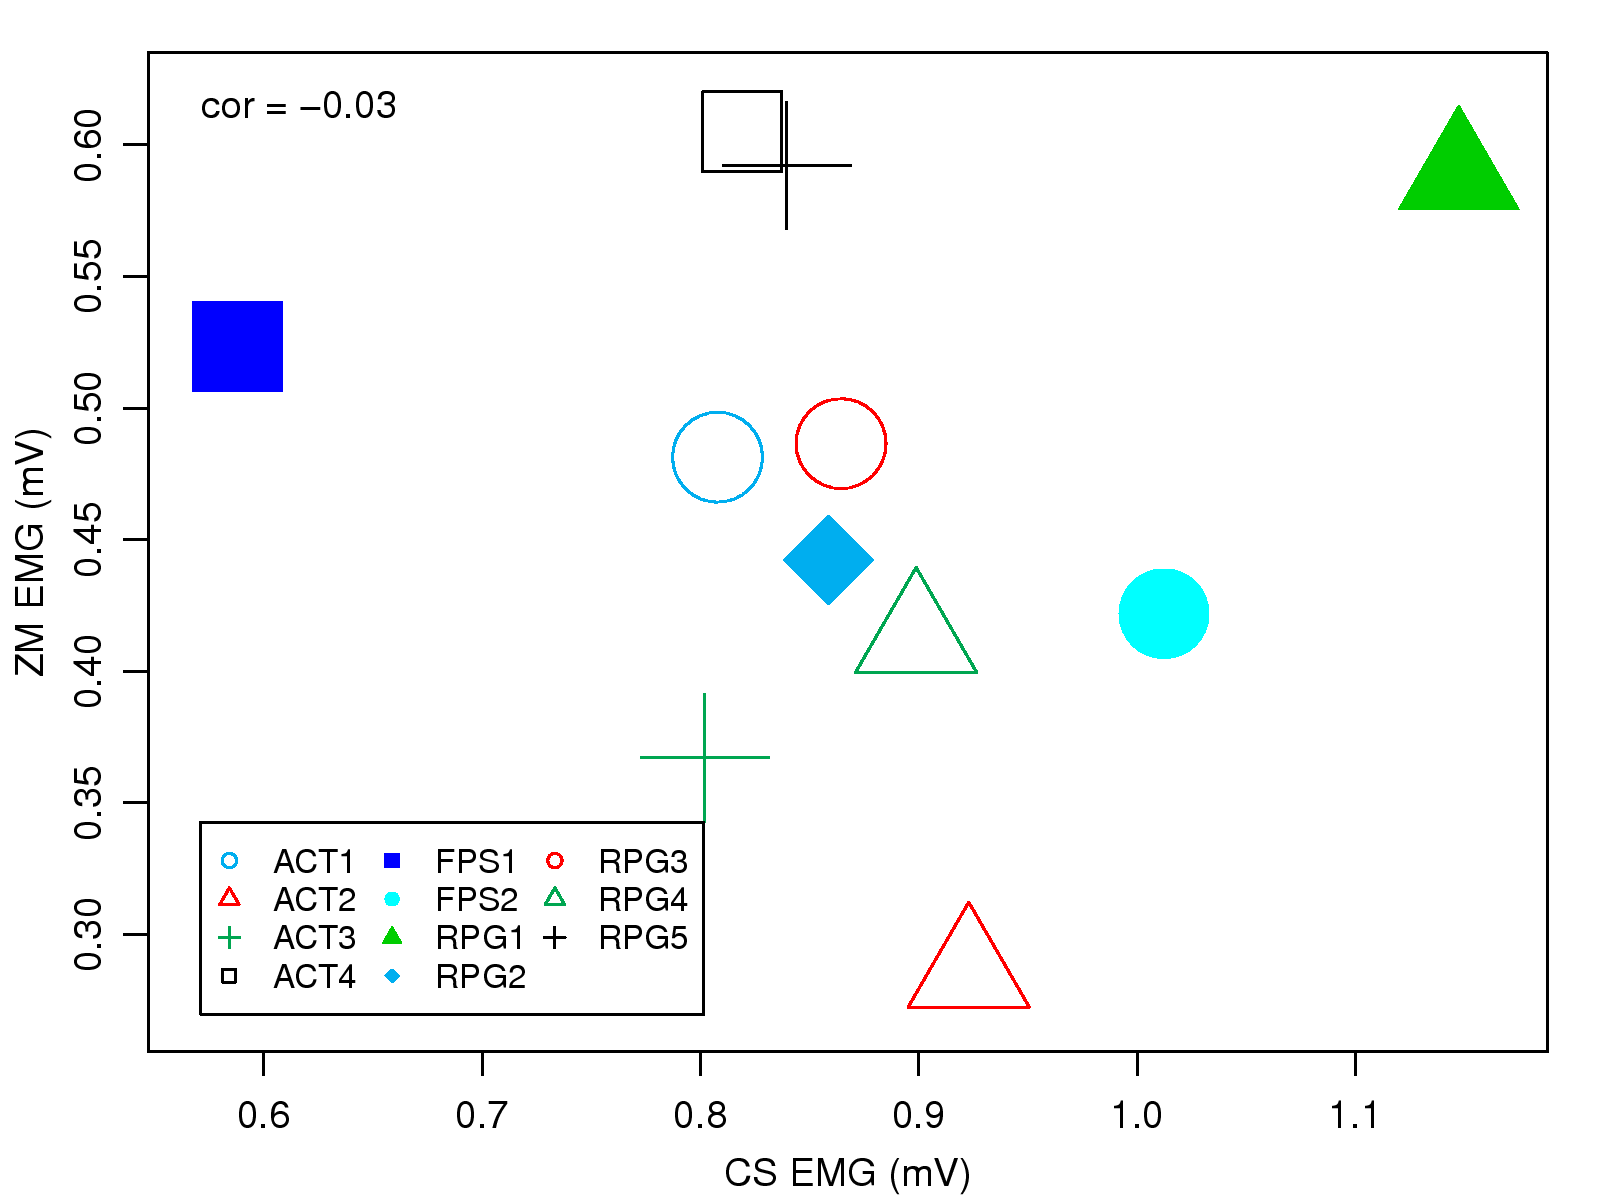
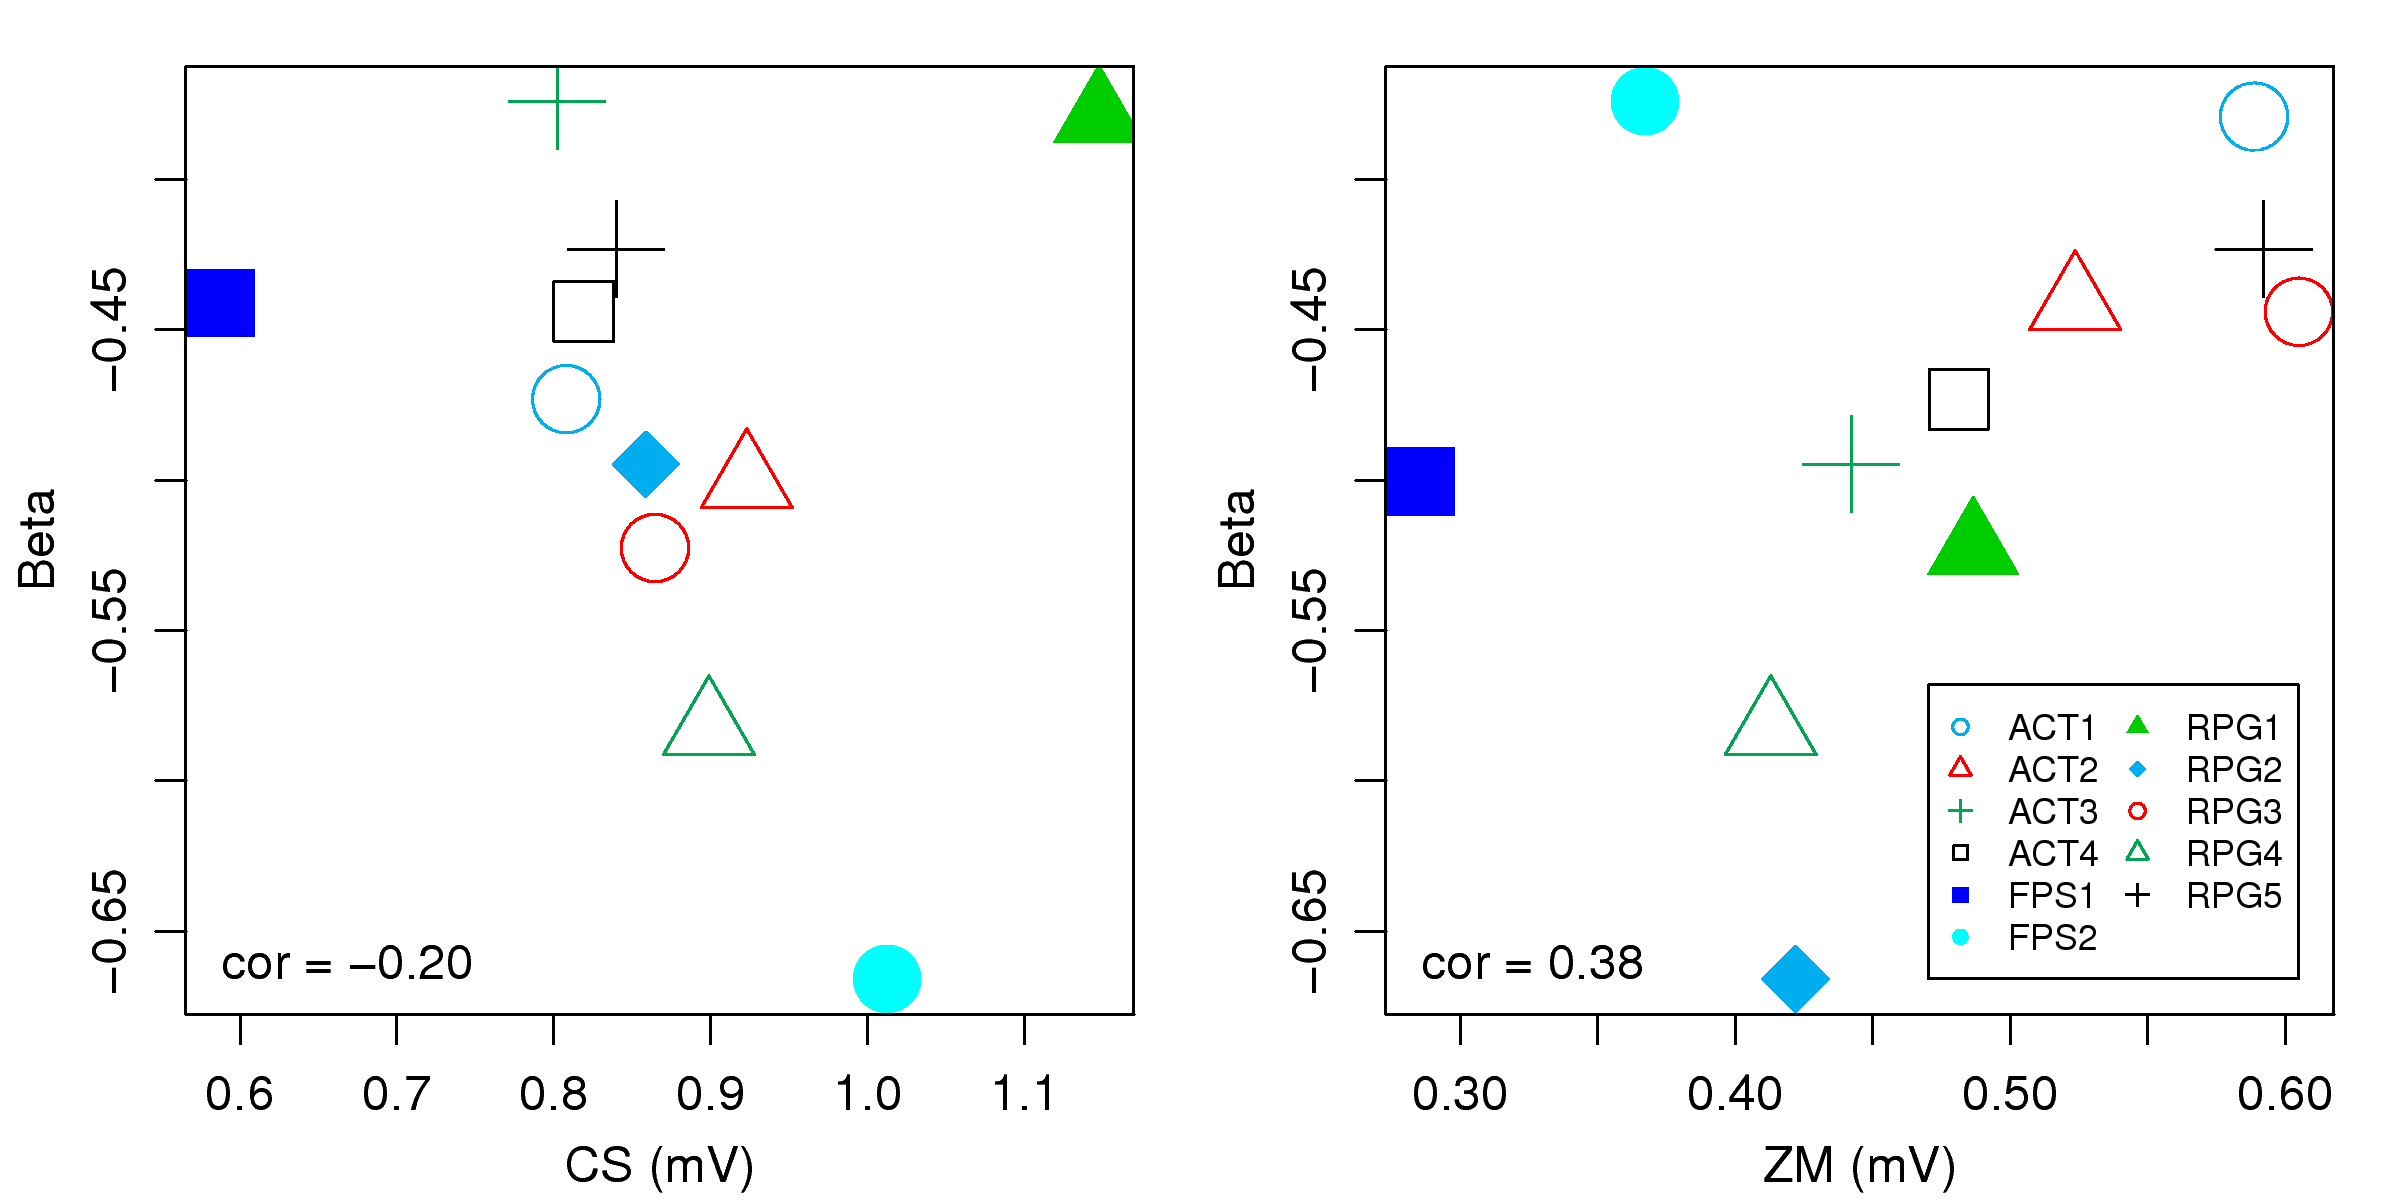
Table 3: The average strength of subjects' negative emotion (CS) and positive emotion (ZM) during gameplay.
Game CS ZM Game CS ZM
ACT1 0.80 0.48 RPG1 1.15 0.59
ACT2 0.920.28 RPG2 0.860.44
ACT3 0.80 0.36 RPG3 0.860.49
ACT4 0.82 0.60 RPG40.900.41
FPS1 0.59 0.52 RPG5 0.830.59
FPS2 1.01 0.42
We list the average CS and ZM for each of the 11 games in Table III and depict them in Figure 5. From the graph, we can see that CS and ZM do not possess any particular form of correlation (with a Pearson coefficient close to zero), which indicates that the subjects' positive and negative emotions can be independently evoked by the games.
beta_cor.png
Figure 6: The relationship between CS and β and that between ZM and β.

5  Forecasting Game Addictiveness

In this section, we develop a prediction model of the addictiveness index, β, based on CS and ZM derived from facial EMG measurements (Section IV). With the use of this model, game designers and operators can then objectively assess the addictiveness of a game with the help of a small focus group.
We start by investigating the relationship between a game's addictiveness index, β, and the strength of emotion it evoked in the user study. Figure 6 represents the relationship between CS and β and between ZM and β, respectively. We find that CS and β has a negative correlation (with a coefficient −0.2) while ZM and β has a positive correlation (with a coefficient 0.38), which is reasonable given that negative emotion (CS) should decrease a game's addictiveness and positive emotion (ZM) should increase a game's addictiveness. The reason why CS has a weaker correlation with β than ZM may be because gamers can also be entertained when they feel a release from the negative emotional responses [4].
We define an additional factor, ES (emotion strength), as the sum of CS and ZM, to denote the combined emotion strength that emerges during gameplay. By using CS, ZM, and ES, we develop a linear regression model to predict β, as presented in Table IV. As shown in this table, all the factors except CS:ES, which denotes the interaction between CS and ES, are significant at the level 0.05. Intuitively, the coefficient of ZM should be positive since a higher ZM causes a higher addictiveness; however, it turns out not to be the case because the inclusion of the interaction terms CS:ZM and ZM:ES. The adjusted R2 of our model is 0.94, which indicates a high goodness-of-fit.
beta_prediction_scatter.png
Figure 7: A scatter plot of actual and predicted addictiveness index β according to our prediction model using a leave-one-out cross-validation approach.
Table 4: The factors and their coefficients in the addictiveness prediction model.
VariableCoef.Std. ErrtPr > |t|
(constant)4.300.439.870.00018
CS−4.190.51−8.180.00044
ZM−11.591.04−11.070.00010
CS:ZM3.531.063.310.02119
CS:ES−0.210.24−0.870.42263
ZM:ES4.890.667.370.00072
To validate the effectiveness of our model, we perform cross-validation using the leave-one-out approach. That is, we pick one test game (out of 11) and predict its addictiveness based on a model trained using the remaining 10 games. The procedure is executed for 11 times so that each game serves as the test game once. The scatter plot of the actual and predicted β of the games is shown in Figure 7. The Pearson correlation coefficient between the actual and predicted β is 0.86, the Kendal-tau correlation coefficient is 0.78, and the average error rate is only 11%. All these figures indicate that our model is effective in forecasting a game's addictiveness simply based on a small set of facial EMG measurements during gameplay.

6  Conclusion

In this paper, we have proposed a methodology to forecast a game's addictiveness based on players' emotional responses when they first explore a game. Based on the account usage records of 11 commercial online games, we have shown that our model can accurately forecast a game's addictiveness according to facial EMG measures from a focus group.
We believe that our forecast model will be helpful in several ways. For example, for game development firms, the model can be used to ensure that a game's design is on the right track in its early development stages. In addition, the model can help game operators in assessing the potential market value of a game before publishing it. All in all, we hope that with our methodology, the game industry can optimize the odds of successful investments and be able to more accurately target the provision of a better entertaining experience.

Acknowledgments

This work would not have been possible without the support from Gamania Digital Entertainment. The authors are much indebted to our collaborators and supporters at Gamania, Andy Liu, Ivy Huang, Karl Hsu, and Albert Liu, among others. The authors also wish to thank the anonymous referees for their constructive criticisms. This work was supported in part by the National Science Council under the grant NSC100-2628-E-001-002-MY3.

References

[1] V. Lehdonvirta, "Virtual item sales as a revenue model: identifying attributes that drive purchase decisions," Electronic Commerce Research, vol. 9, pp. 97-113, 2009.
[2] P.-H. Tseng, N.-C. Wang, R.-M. Lin, and K.-T. Chen, "On The Battle between Online Gamers and Lags," in Proceedings of IEEE CQR 2011, May 2011.
[3] K.-T. Chen, J.-W. Jiang, P. Huang, H.-H. Chu, C.-L. Lei, and W.-C. Chen, "Identifying MMORPG Bots: A Traffic Analysis Approach," EURASIP Journal on Advances in Signal Processing, 2009.
[4] N. Ravaja, T. Saari, M. Salminen, J. Laarni, and K. Kallinen, "Phasic emotional reactions to video game events: A psychophysiological investigation," Media Psychology, vol. 8, no. 4, pp. 343-367, Nov. 2006.
[5] N. Ravaja, M. Turpeinen, T. Saari, S. Puttonen, and L. Keltikangas-Järvinen, "The psychophysiology of james bond: Phasic emotional responses to violent video game events." Emotion, vol. 8, no. 1, pp. 114-120, 2008.
[6] L. E. Nacke, M. N. Grimshaw, and C. A. Lindley, "More than a feeling: Measurement of sonic user experience and psychophysiology in a first-person shooter game," Interacting with Computers, 2010.
[7] H. Desurvire, M. Caplan, and J. A. Toth, "Using heuristics to evaluate the playability of games," Proceedings of ACM CHI'04, Apr. 2004.
[8] P. Sweetser and P. Wyeth, "Gameflow: a model for evaluating player enjoyment in games," Computers in Entertainment (CIE), vol. 3, no. 3, Jul. 2005.
[9] L. Nacke and C. A. Lindley, "Flow and immersion in first-person shooters: measuring the player's gameplay experience," in Proceedings of the 2008 Conference on Future Play, ser. Future Play '08, 2008, pp. 81-88.
[10] R. L. Mandryk and M. S. Atkins, "A fuzzy physiological approach for continuously modeling emotion during interaction with play technologies," International Journal of Human-Computer Studies, 2007.
[11] J. T. Cacioppo, G. G. Berntson, and J. T. Larsen, "The psychophysiology of emotion," Handbook of emotions, pp. 119-142, 2000.
[12] A. Achaibou, G. Pourtois, S. Schwartz, and P. Vuilleumier, "Simultaneous recording of EEG and facial muscle reactions during spontaneous emotional mimicry," Neuropsychologia, vol. 46, no. 4, pp. 1104-1113, Jan. 2008.
[13] Y.-T. Lee, K.-T. Chen, Y.-M. Cheng, and C.-L. Lei, "World of Warcraft Avatar History Dataset," in Proceedings of ACM Multimedia Systems 2011, Feb 2011.
[14] P.-Y. Tarng, K.-T. Chen, and P. Huang, "An Analysis of WoW Players Game Hours," in Proceedings of ACM NetGames 2008, 2008.
[15] D. Pittman and C. GauthierDickey, "Characterizing virtual populations in massively multiplayer online role-playing games," Advances in Multimedia Modeling, 2010.
[16] C. Chambers, W.-c. Feng, S. Sahu, and D. Saha, "Measurement-based characterization of a collection of on-line games," in Proceedings of the 5th ACM SIGCOMM conference on Internet Measurement.    USENIX Association, 2005.
[17] W. Feng, D. Brandt, and D. Saha, "A long-term study of a popular MMORPG," in Proceedings of NetGames'07, 2007, pp. 19-24.
[18] Y.-T. Lee, K.-T. Chen, H.-I. Su, and C.-L. Lei, "Are All Games Equally Cloud-Gaming-Friendly? An Electromyographic Approach," in Proceedings of IEEE/ACM NetGames 2012, Oct 2012.
[19] A. Drachen, L. E. Nacke, and G. Yannakakis, "Correlation between heart rate, electrodermal activity and player experience in first-person shooter games," in Proceedings of the 5th ACM SIGGRAPH Symposium on Video Games, 2010, pp. 49-54.

Footnotes:

1. †. Corresponding author.
2. GamesIndustry.com - Graphs MMO Revenues. http://www.gamesindustry.com/about-newzoo/todaysgamers_graphs_MMO">http://www.gamesindustry.com/about-newzoo/todaysgamers_graphs_MMO
3. Gamania Digital Entertainment, http://www.gamania.com/">http://www.gamania.com/
4. The maximum observation period, 100 days, is an arbitrary choice as we find that RoPs with OP in [1, 100] are sufficient for RoP curve modeling. Similar results will be obtained if the observation period is extended beyond this range.


Sheng-Wei Chen (also known as Kuan-Ta Chen)
http://www.iis.sinica.edu.tw/~swc 
Last Update September 28, 2019